S-1/A: General form of registration statement for all companies including face-amount certificate companies
Published on April 19, 2021
Table of Contents
As filed with the Securities and Exchange Commission on April 19, 2021.
Registration No. 333-254738
UNITED STATES
SECURITIES AND EXCHANGE COMMISSION
WASHINGTON, D.C. 20549
Amendment No. 2
to
FORM S-1
REGISTRATION STATEMENT
UNDER
THE SECURITIES ACT OF 1933
UiPath, Inc.
(Exact name of Registrant as specified in its charter)
| Delaware | 7372 | 47-4333187 | ||
| (State or other jurisdiction of incorporation or organization) |
(Primary Standard Industrial Classification Code Number) |
(I.R.S. Employer Identification Number) |
90 Park Ave, 20th Floor
New York, New York 10016
(844) 432-0455
(Address, including zip code, and telephone number, including area code, of Registrants principal executive offices)
Daniel Dines
Chief Executive Officer, Co-Founder, and Chairman
UiPath, Inc.
90 Park Ave, 20th Floor
New York, New York 10016
(844) 432-0455
(Name, address, including zip code, and telephone number, including area code, of agent for service)
Copies to:
| Nicole Brookshire Eric Jensen Matthew Dubofsky Owen Williams Cooley LLP 55 Hudson Yards New York, New York 10001 (212) 479-6000 |
Brad Brubaker Chief Legal Officer UiPath, Inc. 90 Park Ave, 20th Floor New York, New York 10016 (844) 432-0455 |
Alan F. Denenberg Byron B. Rooney Yasin Keshvargar Davis Polk & Wardwell LLP 450 Lexington Avenue New York, New York 10017 (212) 450-4000 |
Approximate date of commencement of proposed sale to the public: As soon as practicable after this registration statement is declared effective.
If any of the securities being registered on this Form are to be offered on a delayed or continuous basis pursuant to Rule 415 under the Securities Act of 1933, check the following box. ☐
If this Form is filed to register additional securities for an offering pursuant to Rule 462(b) under the Securities Act, check the following box and list the Securities Act registration statement number of the earlier effective registration statement for the same offering. ☐
If this Form is a post-effective amendment filed pursuant to Rule 462(c) under the Securities Act, check the following box and list the Securities Act registration statement number of the earlier effective registration statement for the same offering. ☐
If this Form is a post-effective amendment filed pursuant to Rule 462(d) under the Securities Act, check the following box and list the Securities Act registration statement number of the earlier effective registration statement for the same offering. ☐
Indicate by check mark whether the registrant is a large accelerated filer, an accelerated filer, a non-accelerated filer, a smaller reporting company, or an emerging growth company. See the definitions of large accelerated filer, accelerated filer, smaller reporting company and emerging growth company in Rule 12b-2 of the Exchange Act.
| Large accelerated filer |
☐ |
Accelerated filer |
☐ |
|||
| Non-accelerated filer |
☒ |
Smaller reporting company |
☐ |
|||
| Emerging growth company |
☒ |
|||||
If an emerging growth company, indicate by check mark if the registrant has elected not to use the extended transition period for complying with any new or revised financial accounting standards provided pursuant to Section 7(a)(2)(B) of the Securities Act. ☐
CALCULATION OF REGISTRATION FEE
|
|
||||||||
| Title of each Class of Securities to be Registered |
Amount to be Registered(1) |
Proposed Maximum Offering Price Per Share(2) |
Proposed Maximum Price(1)(2) |
Amount of Registration Fee(3) |
||||
| Class A common stock, par value $0.00001 per share |
27,474,393 |
$54.00 | $1,483,617,222 | $161,863 | ||||
|
|
||||||||
|
|
||||||||
| (1) | Includes 3,583,616 additional shares that the underwriters have the option to purchase. |
| (2) | Estimated solely for the purpose of calculating the registration fee in accordance with Rule 457(a) of the Securities Act of 1933, as amended. Includes the aggregate offering price of additional shares that the underwriters have the option to purchase. |
| (3) | The registrant previously paid a registration fee of $133,508 in connection with prior filings of this Registration Statement. |
The Registrant hereby amends this Registration Statement on such date or dates as may be necessary to delay its effective date until the Registrant will file a further amendment which specifically states that this Registration Statement will thereafter become effective in accordance with Section 8(a) of the Securities Act of 1933, as amended, or until the Registration Statement will become effective on such date as the Securities and Exchange Commission, acting pursuant to said Section 8(a), may determine.
Table of Contents
The information in this preliminary prospectus is not complete and may be changed. These securities may not be sold until the registration statement filed with the Securities and Exchange Commission is effective. This preliminary prospectus is not an offer to sell nor does it seek an offer to buy these securities in any jurisdiction where the offer or sale is not permitted. PROSPECTUS (Subject to Completion) Issued April 19, 2021 23,890,777 Shares CLASS A COMMON STOCK This is an initial public offering of shares of Class A common stock of UiPath, Inc. We are offering 9,416,384 shares of our Class A common stock and the selling stockholders identified in this prospectus are offering an additional 14,474,393 shares of our Class A common stock. We will not receive any proceeds from the sale of shares by the selling stockholders. Prior to this offering, there has been no public market for our Class A common stock. It is currently estimated that the initial public offering price will be between $52.00 and $54.00 per share. Following this offering, we will have two classes of common stock: Class A common stock and Class B common stock. The rights of the holders of Class A common stock and Class B common stock are identical, except with respect to voting, conversion, and transfer rights. Each share of Class A common stock is entitled to one vote. Each share of Class B common stock is entitled to 35 votes and is convertible at any time into one share of Class A common stock. In addition, all shares of Class B common stock will automatically convert into shares of Class A common stock in certain circumstances, including following the date that the number of shares of Class B common stock outstanding is less than 20% of the number of shares of Class B common stock outstanding immediately prior to the completion of this offering. See the section titled "Description of Capital Stock-Class A Common Stock and Class B Common Stock." Our Chief Executive Officer, Co-Founder, and Chairman and his controlled entities hold 100% of our outstanding Class B common stock and will hold approximately 88.1% of the voting power of our outstanding capital stock immediately following this offering, assuming no exercise of the underwriters' option to purchase additional shares of Class A common stock to cover over-allotments. We have applied to list our Class A common stock on the New York Stock Exchange under the symbol "PATH." We are an "emerging growth company" as defined under the federal securities laws and, as such, we have elected to comply with certain reduced reporting requirements for this prospectus and may elect to do so in future filings. Investing in our Class A common stock involves risks. See "Risk Factors" beginning on page 19. PRICE $ A SHARE Per Share Total Initial public offering price ................................ $ $ Underwriting discounts and commissions(1) .................. $ $ Proceeds, before expenses, to UiPath, Inc. ................... $ $ Proceeds, before expenses, to the selling stockholders .......... $ $ (1) See "Underwriting" for additional information regarding compensation payable to the underwriters. At our request, Morgan Stanley & Co. LLC has reserved up to 2.0% of the shares of Class A common stock offered by this prospectus for sale at the initial public offering price through a directed share program to certain individuals identified by our officers and directors who express an interest in purchasing Class A common stock in this offering. For additional information, see the section titled "Underwriting." We have granted the underwriters the option to purchase up to an additional 3,583,616 shares of Class A common stock from us on the same terms as set forth above to cover over-allotments, if any. Neither the Securities and Exchange Commission nor any other regulatory body has approved or disapproved these securities or determined if this prospectus is truthful or complete. Any representation to the contrary is a criminal offense. The underwriters expect to deliver the shares of Class A common stock to purchasers on , 2021. Prospectus dated , 2021. Morgan Stanley J.P. Morgan BofA Securities Credit Suisse Barclays Wells Fargo Securities SMBC Nikko BMO Capital Markets Mizuho Securities KeyBanc Capital Markets TD Securities Truist Securities Cowen Evercore ISI Macquarie Capital Nomura RBC Capital Markets Canaccord Genuity D.A. Davidson & Co. Oppenheimer & Co. Needham & Company
Table of Contents

Table of Contents

Table of Contents

Table of Contents
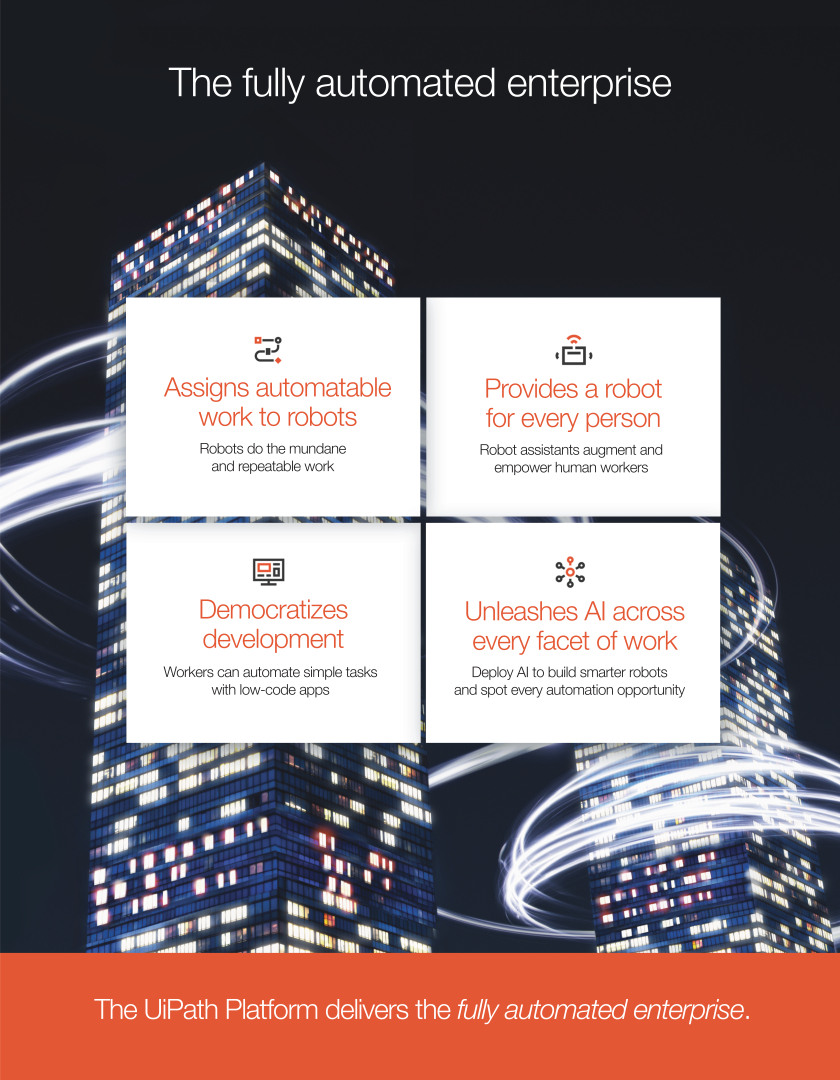
Table of Contents
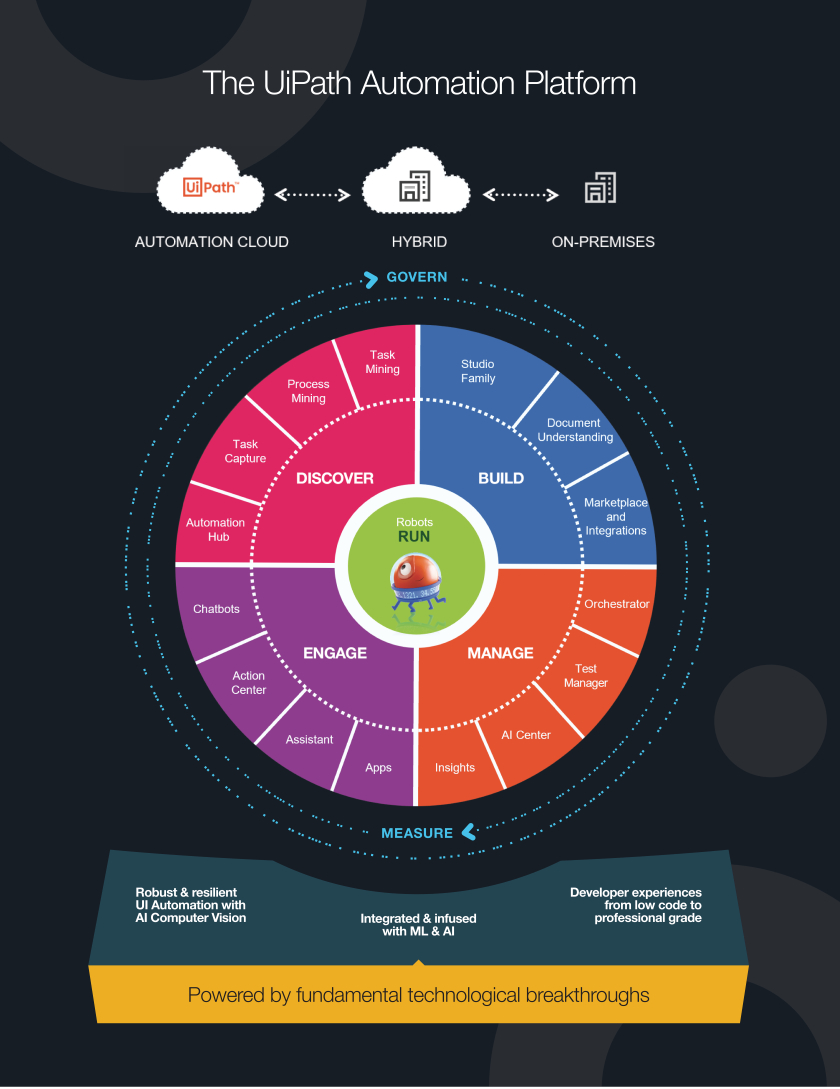
Table of Contents
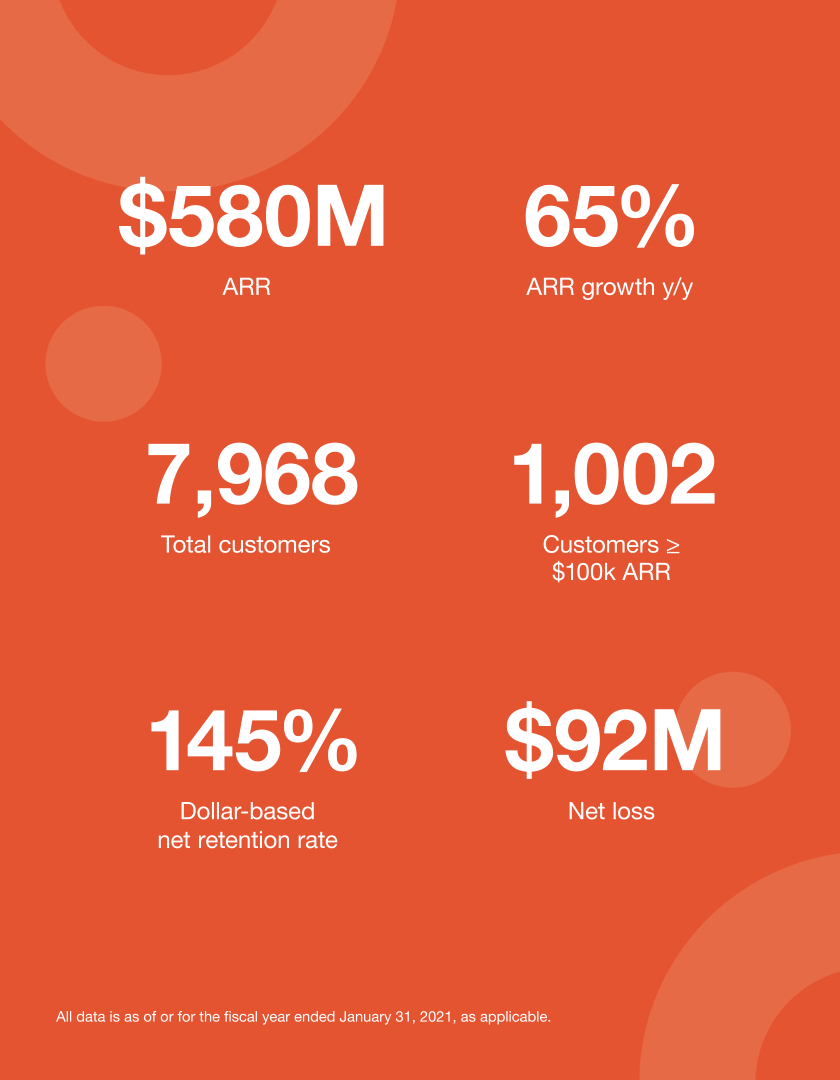
Table of Contents
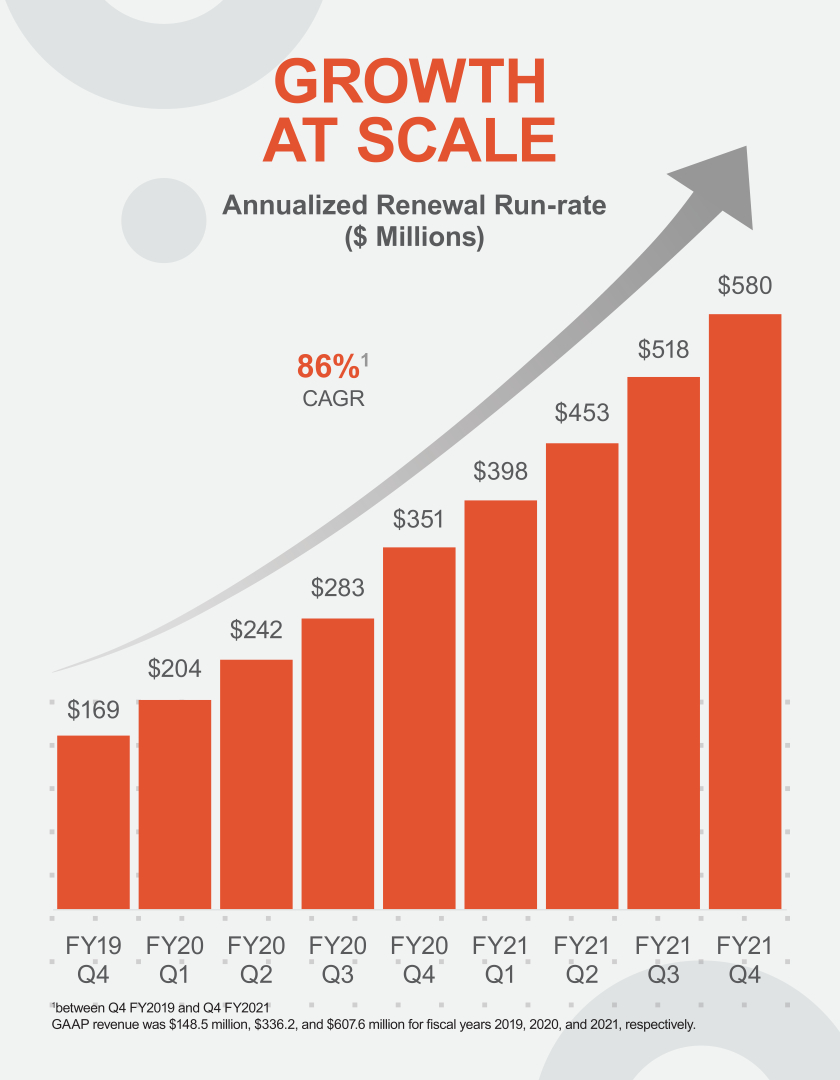
Table of Contents
Prospectus
| Page | ||||
| LETTER FROM DANIEL DINES, CHIEF EXECUTIVE OFFICER, CO-FOUNDER, AND CHAIRMAN |
iii | |||
| 1 | ||||
| 19 | ||||
| 61 | ||||
| 63 | ||||
| 64 | ||||
| 65 | ||||
| 66 | ||||
| 69 | ||||
| MANAGEMENTS DISCUSSION AND ANALYSIS OF FINANCIAL CONDITION AND RESULTS OF OPERATIONS |
72 | |||
| 105 | ||||
| 148 | ||||
| 156 | ||||
| 166 | ||||
| 171 | ||||
| 175 | ||||
| 182 | ||||
| MATERIAL U.S. FEDERAL INCOME TAX CONSEQUENCES TO NON-U.S. HOLDERS OF OUR CLASS A COMMON STOCK |
186 | |||
| 190 | ||||
| 199 | ||||
| 199 | ||||
| 199 | ||||
| F-1 | ||||
Through and including , 2021 (the 25th day after the date of this prospectus), all dealers effecting transactions in these securities, whether or not participating in this offering, may be required to deliver a prospectus. This is in addition to a dealers obligation to deliver a prospectus when acting as an underwriter and with respect to an unsold allotment or subscription.
Neither we, the selling stockholders, nor any of the underwriters have authorized anyone to provide any information or to make any representations other than those contained in this prospectus or in any free writing
-i-
Table of Contents
prospectuses we have prepared. Neither we, the selling stockholders, nor any of the underwriters take responsibility for, or can provide any assurance as to the reliability of, any other information that others may give you. We, the selling stockholders and the underwriters are offering to sell, and seeking offers to buy, shares of our Class A common stock only in jurisdictions where offers and sales are permitted. The information contained in this prospectus is accurate only as of the date of this prospectus, regardless of the time of delivery of this prospectus or of any sale of our Class A common stock.
For investors outside the United States: neither we, the selling stockholders, nor any of the underwriters have done anything that would permit this offering or possession or distribution of this prospectus in any jurisdiction where action for that purpose is required, other than in the United States. Persons outside of the United States who come into possession of this prospectus must inform themselves about, and observe any restrictions relating to, the offering of the shares of our Class A common stock and the distribution of this prospectus outside of the United States.
-ii-
Table of Contents
Table of Contents

Table of Contents
This summary highlights selected information contained elsewhere in this prospectus. This summary does not contain all of the information you should consider before investing in our Class A common stock. You should read this entire prospectus carefully, including the sections titled Risk Factors, Managements Discussion and Analysis of Financial Condition and Results of Operations, and our consolidated financial statements and the related notes included elsewhere in this prospectus, before making an investment decision. Unless the context otherwise requires, all references in this prospectus to UiPath, the company, we, our, us, or similar terms refer to UiPath, Inc. and its subsidiaries. Our fiscal year ends January 31. Our fiscal quarters end on April 30, July 31, October 31, and January 31. References to fiscal years 2019, 2020, and 2021 in this prospectus refer to our fiscal years ended January 31, 2019, 2020, and 2021.
Our Mission
Our mission is to unlock human creativity and ingenuity by enabling the fully automated enterpriseTM and empowering workers through automation.
Overview
The modern enterprise is complex as employees must navigate an ever-increasing number of systems and applications to perform their day-to-day work. This dynamic forces workers to constantly execute manual, time-consuming, and repetitive tasks to get their work done. The friction faced by workers often results in lost productivity that can have a direct impact on a companys bottom line. Traditional automation solutions intended to reduce this friction have generally been designed to be used by developers and engineers, rather than the employees directly involved in executing the actual work being automated. As a result, employees are limited by the lack of flexibility of these traditional automation technologies causing employee productivity, innovation, and satisfaction to suffer.
Our platform is designed to transform the way humans work. We provide our customers with a robust set of capabilities to discover automation opportunities and build, manage, run, engage, measure, and govern automations across departments within an organization. Our platform leverages the power of artificial intelligence, or AI, based computer vision to enable our software robots to perform a vast array of actions as a human would when executing business processes. These actions include, but are not limited to, logging into applications, extracting information from documents, moving folders, filling in forms, and updating information fields and databases. Our robots ability to learn from and replicate workers steps in executing business processes drives continuous improvements in operational efficiencies and enables companies to deliver on key digital initiatives with greater speed, agility, and accuracy.
Our platform enables employees to quickly build automations for both existing and new processes. Employees can seamlessly maintain and scale automations across multiple deployment options, constantly improve and evolve automations, and continuously track and measure the performance of automations, all without substantial technical experience.
At the core of our automation platform is a set of capabilities that emulates human behavior, which provides our customers with the ability to automate both simple and complex use cases. Automations on our platform can be built, consumed, managed, and governed by any employee who interacts with computers, resulting in the potential for broad applicability of our platform across departments within an organization. Society is at a turning point in how organizations execute work, and we believe the ability to leverage software to enrich the employee experience will unlock tremendous value and efficiency opportunities. While we are still in the early days of a multi-year journey to the fully automated enterprise, momentum is growing as organizations across the world are only now beginning to understand the power of automation.
1
Table of Contents
We believe that the success of our land-and-expand business model is centered on our ability to deliver significant value in a very short time. We grow with our customers as they identify and expand the number of business processes to automate, which increases the number of robots deployed and the number of users interacting with our robots. Our ability to expand within our customer base is demonstrated by our dollar-based net retention rate, which represents the rate of net expansion of annualized renewal run-rate, or ARR, from existing customers over the last 12 months. Our dollar-based net retention rate was 153% and 145% as of January 31, 2020 and 2021, respectively. See the sections titled Managements Discussion and Analysis Financial Condition and Result of OperationsKey Factors Affecting Our Performance for additional information regarding our dollar-based net retention rate and Managements Discussion and Analysis Financial Condition and Result of OperationsKey MetricAnnualized Renewal Run-Rate for additional information regarding our ARR.
As of January 31, 2020, we had 6,009 customers, including 80% of the Fortune 10 and 61% of the Fortune Global 500. As of January 31, 2021, we had 7,968 customers, including 80% of the Fortune 10 and 63% of the Fortune Global 500. Our customers span a variety of industries and include Adobe, Applied Materials, Chevron, Chipotle Mexican Grill, CrowdStrike, CVS Health, Deutsche Post DHL, EY, Generali, KDDI, SBA Communications, Takeda Pharmaceuticals, and Uber Technologies, Inc.
We have experienced rapid growth. Our ARR was $351.4 million and $580.4 million in the fiscal years ended January 31, 2020 and 2021, respectively, representing a growth rate of 65%. We generated revenue of $336.2 million and $607.6 million, representing a growth rate of 81%, and a net loss of $519.9 million and $92.4 million in the fiscal years ended January 31, 2020 and 2021, respectively. Our operating cash flows were $(359.4) million and $29.2 million and our free cash flows were $(380.4) million and $26.0 million in the fiscal years ended January 31, 2020 and 2021, respectively. See the section titled Managements Discussion and Analysis Financial Condition and Result of OperationsNon-GAAP Financial MeasuresNon-GAAP Free Cash Flow for additional information on free cash flow, a non-GAAP measure.
Our Industry
Explosive Growth of Cloud-Based Applications Creating a New Era of IT Complexity. Businesses around the world are spending hundreds of billions of dollars to adopt applications that help advance digital transformation and drive competitive advantages. As a result, enterprises have transitioned from managing a handful of multi-purpose, largely on-premises applications to managing hundreds and even thousands of specialized point solutions deployed across on-premises, cloud, and hybrid environments.
The Benefits of Digital Transformation Have Yet to Make Their Way to the Workforce. Modern enterprise applications enable deep and nuanced functionalities. However, despite massive functional advancement, the true promise and potential of digital transformationreallocating human capital towards cognitive, higher-value activitiesremains elusive, which is limiting improvements in productivity.
Individual Business Processes Rely on Multiple Business Applications, and Workers to Orchestrate Them. The proliferation of specialized applications has resulted in humans being the connective tissue in an enterprise, working across a wide range of applications that individually are not built to address the needs of the actual processes they are supporting.
Automation is the New Frontier of Competitive Differentiation. Enterprises are demanding a new approach to unify, tailor, and run applications without significant information technology, or IT, resources or changes to existing infrastructure. With the ability to emulate human behavior, this new approach to automation is disrupting traditional automation and transforming data processing work by allowing customers to find efficiencies without materially changing business processes and supporting infrastructure.
2
Table of Contents
Empowering Workers to Automate their Personal Workflows is Leading to a Democratization of Automation. The combination of technology that can emulate human behavior and a workforce with the knowledge and tools to create their own automations has enabled enterprises to begin to automate a significant number of use cases, from individual tasks to enterprise-wide processes.
Cost of Skilled Human Capital is Accelerating the Evolution Towards the Fully Automated Enterprise. The cost of skilled human capital continues to rise due to growing demand. We believe it is increasingly imperative for enterprises to leverage automation to liberate workers from menial, repetitive, and less productive tasks and to better utilize the positive qualities that only humans have, such as abstract thinking, making connections, dealing with ambiguity, creativity, innovation, passion, and community engagement. We believe this will drive business value and greater employee engagement.
Limitations of Existing Offerings
A number of technology companies have attempted to address the automation needs of organizations through the application of business process management, application development platform offerings, robotic process automation, or RPA, tools, and AI point offerings, as well as other horizontal software applications. However, these existing offerings are challenged by a number of inherent limitations, including:
Lack of An End-to-End Platform. Many existing automation software offerings are point technologies and cannot offer end-to-end automation capabilities on an integrated platform, which inhibits visibility, insight, and context for discovering and building additional automations.
Not Capable of Emulating Human Behavior, Relying too Heavily on APIs. Many existing offerings do not effectively integrate AI computer vision and machine learning, or ML, capabilities needed to accurately identify and emulate human actions in conjunction with application programming interfaces, or APIs. Without these capabilities, organizations are limited to pursuing automation only within the narrow pathways permitted by existing APIs.
Inability to Automate Across Applications. While business processes typically involve multiple applications, many existing automation capabilities are built into specific applications and are limited in their ability to automate business processes across multiple applications. Accordingly, enterprises build inefficient business processes to compensate for limited cross-functional automation capabilities.
Difficult to Link AI Capabilities to Execution. AI and ML, or AI/ML, capabilities are needed to automate cognitive, high-value tasks. In recent years, enterprises have made significant investments in developing AI/ML models. However, it is difficult to leverage these models as the environments for developing them, typically used by data scientists, are distinct from the environments where work processes are carried out, typically by employees using enterprise applications. This separation of environments limits the ability of an organization to deploy models that are necessary to automate complex processes.
Need to Change an Enterprises Underlying Infrastructure. Existing offerings generally are unable to emulate the humans role in executing a business process, requiring organizations to make significant changes either to their applications and infrastructure or to the business processes themselves.
Unable to Realize Full Value of Automation Throughout an Organization. Existing solutions do not typically make automations accessible to everyone within the organization as they are often built with non-intuitive user interfaces, or UIs, and code heavy technology stacks. These solutions are too technical for most knowledge workers, limiting their application to a small number of use cases and users with significant developer experience.
Lack Governance Capabilities at Scale. Existing offerings do not typically offer centralized, secure governance capabilities to enforce, manage, and deploy organizational development standards.
3
Table of Contents
Difficult to Deploy. Existing automation solutions generally require complicated, invasive implementation processes that, in turn, require extensive upfront and ongoing training and time commitment. This makes it difficult to build and maintain automations, resulting in the persistence of manual processes throughout enterprises.
Lack of Openness and Interoperability. Many existing solutions are not modular and lack the ability to integrate new, third-party technologies and operate with customized applications. Enterprises using these solutions are locked into a limited set of proprietary options not built for the future.
Lack of an Engaged Community of Automation Developers. Many existing automation vendors do not have open platforms and have not invested the time and resources required to cultivate a vibrant ecosystem of automation developers that freely exchange innovations and best practices.
Our Solution and Key Strengths
We are at the forefront of technology innovation and thought leadership in automation, creating an end-to-end platform that provides automation with user emulation at its core. Our platform leverages computer vision and AI to empower robots to emulate human behavior and execute specific business processes, eliminating the need for employees to execute certain manual and mundane tasks. Our platform allows employees to focus on more value-added work and enables organizations to seamlessly automate business processes ranging from those in legacy IT systems and on-premises applications to new cloud-native infrastructure and applications without requiring significant changes to the organizations underlying technology infrastructure. Our platform is purpose-built to be used by employees throughout a company and to address a wide variety of use cases, from simple tasks to long-running, complex business processes.
Broad Set of Complementary Solutions. Our platform combines computer vision, AI, ML, RPA, and process-discovery capabilities to enable automations across deployment environments, systems, and applications. We provide our customers with a comprehensive set of capabilities to discover, build, manage, run, engage, measure, and govern automations across departments and personas within an organization or agency.
Open Architecture. Our platform embraces an open ecosystem with hundreds of enterprise application integrations that have been built by both UiPath and the UiPath community of technology partners. Our solution includes a variety of pre-built activities and connectors so customers can quickly create and deploy robots that execute operations and seamlessly interact with third-party systems. Our open ecosystem is architecture agnostic, which allows organizations to automate existing infrastructure and accelerate digital innovation without the need to replace or make large investments in their existing infrastructure.
Built-In AI/ML Capabilities. We incorporate proprietary AI/ML into our products to drive continuous improvement of workflows. Our AI/ML capabilities broaden the applicability of our solution to address complex use cases. Our platform can learn from human interactions to continuously improve the quality and accuracy of AI algorithms and ML models.
Human Emulation Enables Addressing Expansive Use Cases. Our robots emulate human behavior and are adaptable to constantly changing external variables. Our robots ability to emulate human behavior allows organizations to leverage our platform to address a myriad of use cases, from the simple to the complex. We believe that the power of our platform is only limited by the use cases that human users can conceive.
Built for Enterprise Deployment. Our platform grows with our customers as they increase the automation footprint across their organizations. Customers can deploy our platform on-premises, in a public or private cloud, or in a hybrid environment. Our platform has been architected with security and governance at its core allowing our customers to seamlessly grow their automation footprints while giving their IT departments the tools to establish necessary guardrails around the automations.
4
Table of Contents
Adoption Across Workers and Functions. We make automation accessible to workers throughout an organization. Workers can interact with our robots in many of the same ways that they would interact with humans.
Simple, Intuitive, Quickly Deployed. Our platform is easy to use. Automations can be quickly and efficiently deployed across an organization, creating immediate time-to-value.
Resilient Automations. Our platform was built to emulate the actions of a human interacting with applications and systems to execute processes. Our robots can emulate human behavior by leveraging our proprietary AI-based computer vision capabilities to adapt and respond to changes in work environments such as interpreting highly varied document types or navigating unstable UIs. Our proprietary, AI-based computer vision also allows for increased reliability and accommodation to changes in display resolution, scale, and UI changes. In addition, we have developed a variety of features that are designed to enable resiliency in the process and execution of building automations.
Integrated and Portable AI/ML Models. Our platform enables companies to easily deploy, manage, and improve AI/ML models built by our customers or third parties allowing for greater allocation of human capital towards business problems and use cases. Our pre-trained AI/ML models have been designed for deployment and customization without the need for a data science or technical background.
Automation Performance and Business Outcome Analytics. Our platform tracks, measures, and forecasts the performance of automations enabling customers to gain powerful insights and generate key performance indicators with actionable metrics.
Built for Collaboration. Our platform was designed for people and robots to work together, allowing each to focus on the processes they execute best. Robots execute the time-consuming, manual processes that make work less interesting and satisfying, freeing up humans to think more creatively, innovate, solve complex problems, and improve customer experiences.
Accelerating the Adoption of Automation within the Enterprise
The adoption of our platform is fueled by the virality of our products, which together help organically scale our solution within an organization from the bottom up. Most of our customers start their automation journey with the development of a Center of Excellence, or COE. The COE focuses on building automations for simple, widely applicable tasks and provides those automations to the employee base to use in their day-to-day work right from their desktop. As employees become increasingly familiar and comfortable with automations, they start to build useful automations on their own, and submit these to the COE for assessment and, once approved, these automations are then deployed to the rest of the organization. This flywheel continues, spreading development across the entire enterprise and helping organically surface numerous automation ideas that likely could not be achieved through a traditional top-down approach.
Key Benefits to Organizations
Our end-to-end platform is purpose-built to power the fully automated enterprise. Our platform is designed to remove the friction that exists across employees and departments by improving transparency, promoting collaboration, and allowing people to focus on the work that matters. We enable organizations to implement highly customized, agile, and fast automations with lower overall IT infrastructure costs, with the goal of creating short time to value, improved efficiency, and increased innovation. Our platform provides the following key benefits to organizations:
Empower Customers to Deliver on Digital Initiatives. Our platform helps organizations accelerate innovation, increase productivity, drive competitive differentiation, and enrich employee and customer
5
Table of Contents
experiences by reducing the time to complete work from days and hours to minutes and seconds, allowing employees to focus on more mission-critical and innovative work.
Build Business Resiliency and Agility into Digital Business Operations. Our platform provides customers with the necessary flexibility to operate under constantly changing conditions and offers customers a virtually unlimited digital workforce capacity that operates 24 hours per day, 7 days per week.
Fast Time-to-Value. We believe our solution delivers immediate return on investment. Our platform is designed to be easy to install and intuitive to learn and use, minimizing the need for lengthy and expensive implementation and training.
Organization-Wide Automation. Our powerful and easy-to-use platform enables workers throughout an organization to build automations. Our platform is designed to automate the full spectrum of business processes and tasks, from individual tasks to complex processes that address entire enterprise divisions. We offer a development platform that reduces the technical skills required of users, effectively democratizing automation to employees throughout an organization.
Identify, Improve, and Analyze Workflow Execution. Our platform provides visibility into how work actually gets done and enables our customers to continually understand, identify, and implement automation opportunities. Our solution leverages advanced process-discovery technologies and ML models to understand individual patterns for executing work and respond to bottlenecks and inefficiencies.
Improve Employee Productivity, Experience, and Satisfaction. Our platform enables organizations to empower their employees with countless automation possibilities and the ability to digitize time-consuming, manual tasks. As a result, our customers are better positioned to retain a high-value, engaged employee base that can deliver optimal business outcomes.
Improve Accuracy and Compliance with Speed. The quick deployment and adaptability of our platform is designed to eliminate costly errors and inconsistencies that are common among individuals executing manual tasks.
Enhance Customer Experiences. Organizations leverage our robots to resolve customer issues faster and more efficiently.
Key Benefits to Employees
Our platform is designed to eliminate the need for employees to execute low-value, manual tasks, freeing up time to focus on more meaningful, strategic work. We believe the democratization of automation leads to the following benefits tied to an improved employee experience:
| | greater professional fulfillment and job satisfaction; |
| | increased creativity and innovation; |
| | improved performance and accuracy; |
| | enhanced skillsets; |
| | increased autonomy and job opportunities; and |
| | more collaboration and better human interactions. |
6
Table of Contents
Our Market Opportunity
We are disrupting a large and fast-growing market. Our platform addresses the market for Intelligent Process Automation, which International Data Corporation, or IDC, estimated would have a value of $17 billion by the end of 2020 and is expected to grow at a four-year compound annual growth rate of approximately 16% to $30 billion by the end of 2024. However, we believe that this does not fully encompass the opportunity associated with our vision of the fully automated enterprise.
We estimate our current global market opportunity to be more than $60 billion, which we expect will grow as automation adoption increases and customers continue to further explore the use cases that our platform addresses. To estimate our total market opportunity, we identified the number of companies worldwide across all industries with at least 200 employees, based on certain independent industry data from the S&P Capital IQ database. We then segmented these companies into three categories based on total number of employees: companies with 200-4,999 employees, companies with 5,000-19,999 employees, and companies with 20,000 or more employees. We then multiplied the number of companies in each category by the 90th percentile of ARR per customer in each such cohort as of December 31, 2020, among customers with at least $10,000 in ARR, which we believe represents a customer that has broadly deployed our platform across the enterprise, and then summed the results from each category.
According to an estimate by Bain & Company in the report Beyond Cost Savings: Reinventing Business Through Automation, the expansion of automation platforms by incorporating broader capabilities and technologies has increased the size of the addressable market for automation software to approximately $65 billion.
The size of our addressable market opportunity is underpinned by the substantial amount of business processes that could be improved through automation, but are not currently automated. Forrester, a global research firm, estimated there were 1.69 billion knowledge workers globally as of February 2021. We expect our estimated global market opportunity will continue to expand as customers increase the size of their business units and hire additional employees, resulting in a greater number of users and processes that can benefit from automation throughout these enterprises. Additionally, we believe that we are unlocking a myriad of still unexplored automation possibilities as we continue to contribute to this market. We believe those possibilities represent a significant greenfield opportunity for us.
Organizations across the world are only beginning to understand the power of automation and we believe we are at the forefront of a revolution in the way that people do work. We believe that the opportunity that lies ahead of us is largely untapped and has the potential to be one of the largest ever in enterprise software.
For more information regarding certain assumptions underlying these estimates of market opportunity and the forecasts of market growth included in this prospectus, see the section titled Market, Industry, and Other Data.
Our Growth Strategies
We are pursuing a large market opportunity with growth strategies that include:
| | acquire new customers; |
| | expand within our existing customer base; |
| | grow and cultivate our partner and channel network; |
| | extend our technology leadership through continued innovation and investment in our platform; |
| | foster the next generation of workers and grow our community; |
7
Table of Contents
| | continue to invest in major markets; and |
| | opportunistically pursue strategic acquisitions. |
Our Platform
Our platform is purpose-built to advance the next generation of automation. By addressing the complete lifecycle of automation, including identifying specific tasks and processes to automate, building, and managing automation robots, deploying them to execute processes, and measuring their business impact, our platform is intended to address a wide and diverse array of automation opportunities, including complex, long-running workflows. We believe our platform delivers compelling ease-of-use and intuitive user experiences through our low-code development environment and seamlessly integrates with an ever-expanding ecosystem of third-party technologies and enterprise applications without changing the existing infrastructure of an organization. In doing all of this, we enable businesses to redefine the relationship between enterprise applications and business processes.
Our platform encapsulates seven modular product pillars that together address the automation lifecycle within an enterprise:
| | Discover. Our Discover products combine AI with desktop recording, back-end mining of both human activity and system logs, and intuitive visualization tools, enabling users to discover, analyze, and identify unique processes to automate in a centralized portal. |
| | Build. Our Build products are low-code development environments with easy-to-use, drag-and-drop functionality that users in an organization can learn to use to create attended and unattended automations without any prior knowledge of coding. |
| | Manage. The products in our Manage category offer centralized tools designed to securely and resiliently manage, test, and deploy automations and ML models across the entire enterprise, with seamless access, enterprise-grade security, and endless scalability of data. |
| | Run. With our Run products, an enterprise can deploy our robots in highly immersive attended experiences or in standalone, unattended modes behind the scenes, and can leverage hundreds of native connectors built for commonly used line-of-business applications. |
| | Engage. With our Engage products, there are multiple ways for users to remain connected and interact with robots, whether they are running in a data center, in the cloud, or right on their desktop. This capability allows our customers to manage long running processes that orchestrate work between robots and humans. |
| | Measure. Our Measure products enable users to track, measure, and forecast the performance of automation in their enterprise. |
| | Govern. We offer powerful, centralized governance capabilities designed to help businesses ensure compliance with business standards. |
Our platform is powered by the following key differentiating elements that are necessary for end-to-end automation within todays enterprise:
| | AI Computer Vision. Our robots are powered by a multi-pronged approach, combining proprietary computer vision technology that uses highly-trained AI with technical introspection of visual hierarchy to dynamically recognize and interact with constantly changing elements of on-screen documents, images, and applications. |
8
Table of Contents
| | Fully AI-Enabled Platform. We have purposefully infused our platform with AI to enable organizations to use our products easily and deeply embed AI into their core operations. |
| | Document Understanding. We combine our proprietary computer vision technology with optical character recognition, natural language processing, and a variety of ML technologies to classify and extract data from unstructured, semi-structured, and structured documents and images, handwriting, and scans. |
| | Low-Code Development Experiences. Our platform is built to be intuitive and easy to use with low-code, drag-and-drop development tools, and interfaces that knowledge workers can understand. |
| | Widespread and Rich Human and Robot Interaction. Our platform facilitates a broad array of interactions between humans and robots, allowing users to easily engage with robots when, where, and how they want. |
| | Enterprise-Grade Governance and Security. We deliver centralized governance and data security capabilities built for businesses to securely and resiliently deploy and manage automations at enterprise scale. |
| | Open and Extensible Platform Architecture. Our platform delivers both UI automation and API integration on a single platform. We offer hundreds of out-of-the-box, native integrations with a wide range of enterprise applications and productivity tools from our technology partners. |
| | Flexible Deployment. We have built our platform to be multi-tenant and deployable across on-premises, private and public cloud, and hybrid environments to meet any level of scaling, availability, and infrastructure requirements. |
Risk Factors Summary
Investing in our Class A common stock involves substantial risk. The risks described in the section titled Risk Factors immediately following this summary may cause us to not realize the full benefits of our strengths or may cause us to be unable to successfully execute all or part of our strategy. Some of the more significant challenges include the following:
| | Our recent rapid growth may not be indicative of our future growth. Our limited operating history and recent rapid growth also make it difficult to evaluate our future prospects and may increase the risk that we will not be successful. |
| | We may not be able to successfully manage our growth and, if we are not able to grow efficiently, our business, financial condition, and results of operations could be harmed. |
| | Because we derive substantially all of our revenue from our automation platform, failure of this platform to satisfy customer demands could adversely affect our business, results of operations, financial condition, and growth prospects. |
| | Our business depends on our existing customers renewing their licenses and purchasing additional licenses and products from us and our channel partners. Declines in renewals or the purchase of additional licenses by our customers could harm our future operating results. |
| | If we are unable to attract new customers, our business, financial condition, and results of operations will be adversely affected. |
9
Table of Contents
| | The markets in which we participate are competitive and, if we do not compete effectively, our business, financial condition, and results of operations could be harmed. |
| | If we fail to retain and motivate members of our management team or other key employees, or fail to attract additional qualified personnel to support our operations, our business and future growth prospects would be harmed. |
| | Unfavorable conditions in our industry or the global economy, or reductions in IT spending, could limit our ability to grow our business and negatively affect our results of operations. |
| | A limited number of customers represent a substantial portion of our revenue and ARR. If we fail to retain these customers, our revenue could decline significantly. |
| | We rely on our channel partners to generate a substantial amount of our revenue, and if we fail to expand and manage our distribution channels, our revenue could decline and our growth prospects could suffer. |
| | If we are not able to introduce new features or services successfully and to make enhancements to our platform or products, our business and results of operations could be adversely affected. |
| | Real or perceived errors, failures, or bugs in our platform and products could adversely affect our business, results of operations, financial condition, and growth prospects. |
| | Incorrect or improper implementation or use of our platform and products could result in customer dissatisfaction and harm our business, results of operations, financial condition, and growth prospects. |
| | We rely upon third-party providers of cloud-based infrastructure to host our cloud-based products. Any disruption in the operations of these third-party providers, limitations on capacity, or interference with our use could adversely affect our business, financial condition, and results of operations. |
| | We expect fluctuations in our financial results, making it difficult to project future results, and if we fail to meet the expectations of securities analysts or investors with respect to our results of operations, our stock price and the value of your investment could decline. |
| | If we fail to maintain and enhance our brand, our ability to expand our customer base will be impaired and our business, financial condition, and results of operations may suffer. |
| | Any failure to obtain, maintain, protect, or enforce our intellectual property and proprietary rights could impair our ability to protect our proprietary technology and our brand. |
| | We may become subject to intellectual property disputes, which are costly and may subject us to significant liability and increased costs of doing business. |
| | Our current operations are international in scope, and we plan further geographic expansion, creating a variety of operational challenges. |
| | We and our independent registered public accounting firm identified a material weakness in our internal control over financial reporting in the past, and any failure to maintain effective internal control over financial reporting could harm us. |
10
Table of Contents
| | The dual class structure of our common stock will have the effect of concentrating voting control with our Chief Executive Officer, Co-Founder, and Chairman, which will limit your ability to influence the outcome of important decisions. |
Corporate Information
We were founded in Bucharest, Romania in 2005 and incorporated in Delaware on June 9, 2015. Our principal executive offices are located at 90 Park Avenue, 20th Floor, New York, New York 10016, and our telephone number is (844) 432-0455. Our website address is www.uipath.com. Information contained on, or that can be accessed through, our website is not incorporated by reference into this prospectus, and you should not consider information on our website to be part of this prospectus.
The UiPath logo, UiPath, Automation Cloud, and our other registered and common law trade names, trademarks, and service marks are the property of UiPath, Inc. or our subsidiaries. Other trade names, trademarks, and service marks used in this prospectus are the property of their respective owners.
Our Fiscal Year
Our fiscal year ends on January 31 each year. See Note 2 to our consolidated financial statements included elsewhere in this prospectus for additional details related to our fiscal year.
Implications of Being an Emerging Growth Company
We are an emerging growth company as defined in the Jumpstart Our Business Startups Act of 2012, or the JOBS Act. We may take advantage of certain exemptions from various public company reporting requirements, including not being required to have our internal control over financial reporting audited by our independent registered public accounting firm under Section 404 of the Sarbanes-Oxley Act of 2002, or the Sarbanes-Oxley Act, reduced disclosure obligations regarding executive compensation in our periodic reports and proxy statements and exemptions from the requirements of holding a non-binding advisory vote on executive compensation and any golden parachute payments. We may take advantage of these exemptions for up to five years or until we are no longer an emerging growth company, whichever is earlier. In addition, the JOBS Act provides that an emerging growth company can delay adopting new or revised accounting standards until those standards apply to private companies. We have elected to use the extended transition period under the JOBS Act. Accordingly, our financial statements may not be comparable to the financial statements of public companies that comply with such new or revised accounting standards.
11
Table of Contents
THE OFFERING
| Class A common stock offered by us |
9,416,384 shares |
| Class A common stock offered by the selling stockholders |
14,474,393 shares |
| Option to purchase additional shares of Class A common stock offered by us |
3,583,616 shares |
| Class A common stock to be outstanding after this offering |
436,700,983 shares |
| Class B common stock to be outstanding after this offering |
82,452,748 shares |
| Total Class A common stock and Class B common stock to be outstanding after this offering |
519,153,731 shares |
| Use of proceeds |
We estimate that our net proceeds from the sale of our Class A common stock that we are offering will be approximately $467.4 million (or approximately $647.9 million if the underwriters option to purchase additional shares of our Class A common stock from us is exercised in full), assuming an initial public offering price of $53.00 per share, the midpoint of the estimated price range set forth on the cover page of this prospectus, and after deducting estimated underwriting discounts and commissions and estimated offering expenses payable by us. We will not receive any proceeds from the sale of shares of our Class A common stock by the selling stockholders. |
| The principal purposes of this offering are to increase our capitalization and financial flexibility, facilitate an orderly distribution of shares for the selling stockholders, create a public market for our Class A common stock, and facilitate our future access to the capital markets. As of the date of this prospectus, we cannot specify with certainty all of the particular uses for the net proceeds to us from this offering. However, we currently intend to use the net proceeds we receive from this offering for general corporate purposes, including working capital, operating expenses, and capital expenditures. We also intend to donate up to $0.6 million of the net proceeds of this offering to fund our social impact and environmental, social, and governance initiatives, as more fully described in BusinessSocial Responsibility and Community Initiatives. We may use a portion of the net proceeds to acquire complementary businesses, products, services, or technologies. At this time, we do not have agreements or commitments to enter into any material acquisitions. See the section titled Use of Proceeds for additional information. |
12
Table of Contents
| Directed share program |
At our request, Morgan Stanley & Co. LLC (the DSP Underwriter) has reserved up to 2.0% of the shares of Class A common stock offered by this prospectus for sale at the initial public offering price to certain individuals identified by our officers and directors who express an interest in purchasing Class A common stock in this offering. The shares sold under the directed share program will not be subject to a lock-up, except for any shares purchased by our officers and directors. The number of shares of Class A common stock available for sale to the general public will be reduced by the number of reserved shares sold to these individuals. Any reserved shares of our Class A common stock that are not so purchased will be offered by the DSP Underwriter to the general public on the same terms as the other shares of our Class A common stock offered by this prospectus. We have agreed to indemnify the DSP Underwriter and its affiliates against certain liabilities and expenses, including liabilities under the Securities Act, in connection with sales of the reserved shares. For additional information, see the section titled Underwriting. |
| Voting rights |
We will have two classes of common stock: Class A common stock and Class B common stock. Each share of Class A common stock is entitled to one vote and each share of Class B common stock is entitled to 35 votes and is convertible at any time into one share of Class A common stock. In addition, all shares of Class B common stock will automatically convert into shares of Class A common stock in certain circumstances, including following the date that the number of shares of Class B common stock outstanding is less than 20% of the number of shares of Class B common stock outstanding immediately prior to the completion of this offering. See the section titled Description of Capital StockClass A Common Stock and Class B Common Stock. |
| Holders of Class A common stock and Class B common stock will generally vote together as a single class, unless otherwise required by law or our amended and restated certificate of incorporation that will be in effect on the closing of this offering. Our Chief Executive Officer, Co-Founder, and Chairman, Daniel Dines, and his controlled entities hold 100% of our outstanding Class B common stock and will hold approximately 88.1% of the voting power of our outstanding shares following this offering (or 88.0% of the voting power of our outstanding shares following this offering if the |
13
Table of Contents
| underwriters exercise their option in full to purchase additional shares of Class A common stock to cover over-allotments). As a result, Mr. Dines will have the ability to control the outcome of matters submitted to our stockholders for approval, including the election of our directors and the approval of any change in control transaction. See the sections titled Principal and Selling Stockholders and Description of Capital Stock for additional information. |
| Risk factors |
You should carefully read the section titled Risk Factors beginning on page 19 and the other information included in this prospectus for a discussion of facts that you should consider before deciding to invest in shares of our Class A common stock. |
| Proposed New York Stock Exchange trading symbol |
PATH |
The number of shares of Class A common stock and Class B common stock that will be outstanding after this offering as noted above is based on 425,901,431 shares of Class A common stock and 83,835,916 shares of Class B common stock outstanding as of January 31, 2021, and excludes:
| | 5,175,906 shares of Class A common stock issuable on the exercise of stock options outstanding as of January 31, 2021 under the UiPath, Inc. 2015 Stock Plan, or the 2015 Plan, with a weighted-average exercise price of $0.07 per share; |
| | 17,836,792 shares of Class A common stock issuable on the exercise of stock options outstanding as of January 31, 2021 under the UiPath, Inc. 2018 Stock Plan, or the 2018 Plan, with a weighted-average exercise price of $2.02 per share; |
| | 146,549 shares of Class A common stock issuable on the exercise of stock options granted after January 31, 2021 under the 2018 Plan, with a weighted-average exercise price of $0.10 per share; |
| | 16,646,293 shares of Class A common stock issuable on the vesting and settlement of RSUs outstanding as of January 31, 2021 under the 2018 Plan for which the performance-based vesting condition will be satisfied in connection with this offering, but for which the service-based vesting condition will not be satisfied on or before the date of this offering; |
| | 2,812,974 shares of Class A common stock issuable upon the vesting and settlement of RSUs granted after January 31, 2021 under the 2018 Plan for which the performance-based vesting condition will be satisfied in connection with this offering, but for which the service-based vesting condition will not be satisfied on or before the date of this offering; |
| | 60,109,479 shares of Class A common stock reserved for future issuance under our 2021 Equity Incentive Plan, or 2021 Plan, as well as any future increases, including annual automatic evergreen increases, in the number of shares of Class A common stock reserved for issuance thereunder, and any shares underlying stock awards outstanding under the 2015 Plan or the 2018 Plan that expire or are repurchased, forfeited, canceled, or withheld; |
| | 10,500,000 shares of Class A common stock reserved for issuance under our employee stock purchase plan, or ESPP, as well as any future increases, including annual automatic evergreen increases, in the number of shares of Class A common stock reserved for future issuance under our ESPP; and |
14
Table of Contents
| | 2,810,082 shares of our Class A common stock that we have reserved and may donate to fund our social impact and environmental, social, and governance initiatives, as more fully described in BusinessSocial Responsibility and Community Initiatives. |
In addition, unless we specifically state otherwise, the information in this prospectus reflects:
| | a 10-for-1 forward stock split of our then-outstanding Class A common stock, Class B common stock, and each series of convertible preferred stock effected on June 6, 2018 without any change in the par value per share; |
| | a 3-for-1 forward stock split of our then-outstanding Class A common stock, Class B common stock, and each series of convertible preferred stock effected on July 9, 2020 without any change in the par value per share; |
| | the conversion of 26,817,582 shares of Class B common stock into an equivalent number of shares of Class A common stock prior to the closing of this offering, or the Class B Conversion; |
| | the filing of our amended and restated certificate of incorporation and the effectiveness of our amended and restated bylaws, each of which will occur immediately prior to the closing of this offering; |
| | the net issuance of 17,606,860 shares of Class A common stock following the closing of this offering from the settlement of certain outstanding RSUs for which the service based vesting condition was satisfied on or before the date of this offering and for which the performance-based vesting condition will be satisfied in connection with this offering; |
| | the conversion of all outstanding shares of convertible preferred stock into an aggregate of 306,300,407 shares of Class A common stock, which will occur immediately prior to the closing of this offering, and which includes the 12,043,202 shares of our Series F convertible preferred stock issued and sold in February 2021 for an aggregate purchase price of approximately $750.0 million in private placements, or the Series F Financing; |
| | no exercise of the underwriters option to purchase up to an additional 3,583,616 shares of Class A common stock from us in this offering; |
| | no exercise of the outstanding stock options or settlement of the outstanding RSUs described above for which the service-based vesting condition will not be satisfied on or before the date of this offering; and |
| | no purchase of our Class A common stock by executive officers, directors and existing stockholders through the directed share program described under Underwriting. |
15
Table of Contents
Summary Consolidated Financial and Other Data
The summary consolidated statement of operations data for the fiscal years ended January 31, 2020 and 2021 and the summary consolidated balance sheet data as of January 31, 2021 have been derived from our audited consolidated financial statements included elsewhere in this prospectus. The summary consolidated statement of operations data for the fiscal year ended January 31, 2019 has been derived from our unaudited consolidated financial statements not included in this prospectus. We have prepared the unaudited financial information on the same basis as the audited consolidated financial statements and have included, in our opinion, all adjustments, consisting only of normal recurring adjustments, we consider necessary for a fair statement of the financial information set forth in those statements. You should read the consolidated financial data set forth below in conjunction with our consolidated financial statements and the accompanying notes and the information in the section titled Managements Discussion and Analysis of Financial Condition and Results of Operations contained elsewhere in this prospectus. Our historical results are not necessarily indicative of the results to be expected for the full year or any other period in the future.
| Fiscal Year Ended January 31, | ||||||||||||
| 2019 | 2020 | 2021 | ||||||||||
| (in thousands except share and per share amounts) |
||||||||||||
| Consolidated Statement of Operations Data |
||||||||||||
| Revenue: |
||||||||||||
| Licenses |
$ | 94,910 | $ | 201,648 | $ | 346,035 | ||||||
| Maintenance and support |
47,287 | 119,612 | 232,542 | |||||||||
| Services and other |
6,268 | 14,896 | 29,066 | |||||||||
|
|
|
|
|
|
|
|||||||
| Total revenue |
148,465 | 336,156 | 607,643 | |||||||||
|
|
|
|
|
|
|
|||||||
| Cost of revenue: |
||||||||||||
| Licenses |
472 | 3,760 | 7,054 | |||||||||
| Maintenance and support(1) |
6,669 | 16,503 | 24,215 | |||||||||
| Services and other(1) |
35,187 | 39,142 | 34,588 | |||||||||
|
|
|
|
|
|
|
|||||||
| Total cost of revenue |
42,328 | 59,405 | 65,857 | |||||||||
|
|
|
|
|
|
|
|||||||
| Gross profit |
106,137 | 276,751 | 541,786 | |||||||||
|
|
|
|
|
|
|
|||||||
| Operating expenses: |
||||||||||||
| Sales and marketing(1) |
189,717 | 483,344 | 380,154 | |||||||||
| Research and development(1) |
66,923 | 131,066 | 109,920 | |||||||||
| General and administrative(1) |
106,688 | 179,624 | 162,035 | |||||||||
|
|
|
|
|
|
|
|||||||
| Total operating expenses |
363,328 | 794,034 | 652,109 | |||||||||
|
|
|
|
|
|
|
|||||||
| Operating loss |
(257,191 | ) | (517,283 | ) | (110,323 | ) | ||||||
| Interest income |
1,172 | 6,741 | 1,152 | |||||||||
| Other (expense) income, net |
(2,819 | ) | (6,597 | ) | 14,513 | |||||||
|
|
|
|
|
|
|
|||||||
| Loss before income taxes |
(258,838 | ) | (517,139 | ) | (94,658 | ) | ||||||
| Provision for (benefit from) income taxes |
2,811 | 2,794 | (2,265 | ) | ||||||||
|
|
|
|
|
|
|
|||||||
| Net loss |
$ | (261,649 | ) | $ | (519,933 | ) | $ | (92,393 | ) | |||
|
|
|
|
|
|
|
|||||||
| Net loss per share attributable to common stockholders, basic and diluted(2) |
$ | (1.67 | ) | $ | (3.41 | ) | $ | (0.55 | ) | |||
|
|
|
|
|
|
|
|||||||
| Weighted-average shares used to compute net loss per share attributable to common stockholders, basic and diluted(2) |
156,954,470 | 152,382,428 | 168,255,480 | |||||||||
|
|
|
|
|
|
|
|||||||
16
Table of Contents
| Fiscal Year Ended January 31, | ||||||||||||
| 2019 | 2020 | 2021 | ||||||||||
| (in thousands except share and per share amounts) |
||||||||||||
| Pro forma net loss per share attributable to common stockholders, basic and diluted (unaudited)(3) |
$ | (0.64 | ) | |||||||||
|
|
|
|||||||||||
| Weighted-average shares used to compute pro forma net loss per share attributable to common stockholders, basic and diluted (unaudited)(3) |
492,162,747 | |||||||||||
|
|
|
|||||||||||
| Other Data |
||||||||||||
| Annualized renewal run-rate (ARR)(4) |
$ | 168,528 | $ | 351,441 | $ | 580,483 | ||||||
| (1) | Includes stock-based compensation expense as follows: |
| Fiscal Year Ended January 31, | ||||||||||||
| 2019 | 2020 | 2021 | ||||||||||
| (in thousands) | ||||||||||||
| Cost of revenue |
$ | 1,236 | $ | 2,813 | $ | 2,373 | ||||||
| Sales and marketing |
13,234 | 26,754 | 16,356 | |||||||||
| Research and development |
37,852 | 45,235 | 11,435 | |||||||||
| General and administrative |
64,082 | 63,060 | 56,003 | |||||||||
|
|
|
|
|
|
|
|||||||
| Total stock-based compensation expense |
$ | 116,404 | $ | 137,862 | $ | 86,167 | ||||||
|
|
|
|
|
|
|
|||||||
| (2) | See Note 15 to our consolidated financial statements included elsewhere in this prospectus for an explanation of the calculations of our basic and diluted net loss per share attributable to common stockholders and the weighted-average number of shares used in the computation of the per share amounts. |
| (3) | Pro forma net loss per share gives effect to (a) the automatic conversion of all of our outstanding shares of convertible preferred stock into an aggregate of 306,300,407 shares of Class A common stock (after giving effect to the Series F Financing), (b) the net conversion of 17,606,860 RSUs into shares of Class A common stock for which the service-based vesting condition was satisfied on or before the date of the offering and for which the performance-based vesting condition will be satisfied in connection with this offering, after withholding an aggregate of 165,841 shares to satisfy associated estimated income tax obligations from certain tax jurisdictions (based on an assumed 45% tax withholding rate), and (c) stock-based compensation expenses of approximately $224.9 million related to RSUs for which the service-based vesting condition was satisfied and for which the performance-based vesting condition will be satisfied in connection with this offering. |
| (4) | We define ARR as annualized invoiced amounts per solution sku from subscription licenses and maintenance obligations assuming no increases or reductions in their subscriptions. ARR is not a calculation of revenue and does not include invoiced amounts reported as perpetual licenses or professional services revenue in our consolidated statements of operations. See the section titled Managements Discussion and Analysis of Financial Condition and Results of OperationsKey MetricAnnualized Renewal Run-Rate included elsewhere in this prospectus for additional information on our ARR metric. |
17
Table of Contents
| As of January 31, 2021 | ||||||||||||
| Actual | Pro Forma(1) |
Pro
Forma As Adjusted(2)(3)(4) |
||||||||||
| (in thousands) | ||||||||||||
| Consolidated Balance Sheet Data |
||||||||||||
| Cash, cash equivalents, restricted cash, and marketable securities |
$ | 474,018 | $ | 1,224,018 | $ | 1,692,115 | ||||||
| Total assets |
866,461 | 1,616,461 | 2,083,064 | |||||||||
| Working capital(5) |
369,274 | 1,110,484 | 1,579,342 | |||||||||
| Accrued expenses and other current liabilities |
36,660 | 45,450 | 44,689 | |||||||||
| Convertible preferred stock |
1,221,968 | | | |||||||||
| Total stockholders (deficit) equity |
(803,704 | ) | 1,159,474 | 1,626,838 | ||||||||
| (1) | The pro forma consolidated balance sheet data gives effect to (a) the automatic conversion of all of our outstanding shares of convertible preferred stock into an aggregate of 306,300,407 shares of Class A common stock (after giving effect to the Series F Financing), (b) the filing and effectiveness of our amended and restated certificate of incorporation immediately prior to the closing of this offering, (c) the net conversion of 17,606,860 RSUs into shares of Class A common stock for which the service-based vesting condition was satisfied on or before the date of the offering and for which the performance-based vesting condition will be satisfied in connection with this offering, after withholding an aggregate of 165,841 shares to satisfy associated estimated income tax obligations from certain tax jurisdictions (based on an assumed 45% tax withholding rate), (d) the related increase in accrued expenses and other current liabilities and a corresponding decrease in additional paid-in capital for the associated tax liabilities related to the net settlement of the RSUs; and (e) stock-based compensation expenses of approximately $224.9 million related to RSUs for which the service-based vesting condition was satisfied and for which the performance-based vesting condition will be satisfied in connection with this offering. |
| (2) | The pro forma as adjusted consolidated balance sheet data reflects (a) the pro forma adjustments set forth above, (b) our receipt of $467.4 million in net proceeds from the issuance and sale of 9,416,384 shares of Class A common stock that we are offering at an assumed initial public offering price of $53.00 per share, the midpoint of the estimated price range set forth on the cover page of this prospectus, after deducting the estimated underwriting discounts and commissions and estimated offering expenses payable by us, and (c) the conversion of 1,383,168 shares of Class B common stock into an equal number of shares of Class A common stock in connection with the sale of such shares by the selling stockholders in this offering. For more information, see the section titled Principal and Selling Stockholders. We will not receive any proceeds from the sale of shares of our Class A common stock by the selling stockholders. Accordingly, there is no impact on the pro forma as adjusted consolidated balance sheet for these shares. |
| (3) | A $1.00 increase (decrease) in the assumed initial public offering price of $53.00 per share, the midpoint of the estimated price range set forth on the cover page of this prospectus, would increase (decrease) each of our pro forma as adjusted cash, cash equivalents, restricted cash, and marketable securities, and total assets, working capital and total stockholders (deficit) equity by approximately $9.0 million, assuming that the number of shares offered by us, as set forth on the cover page of this prospectus, remains the same, and after deducting the estimated underwriting discounts and commissions. Similarly, each increase (decrease) of 1,000,000 shares in the number of shares of Class A common stock offered by us would increase (decrease) each of our pro forma as adjusted cash, cash equivalents, restricted cash, and marketable securities, and total assets, working capital and total stockholders (deficit) equity by $50.4 million, assuming the assumed initial public offering price of $53.00 per share of Class A common stock remains the same, and after deducting the estimated underwriting discounts and commissions. |
| (4) | Pro forma as adjusted cash, cash equivalents, restricted cash, and marketable securities, and total assets do not give effect to $0.7 million of deferred offering costs that had been paid as of January 31, 2021. |
| (5) | Working capital is defined as current assets less current liabilities. |
18
Table of Contents
Investing in our Class A common stock involves a high degree of risk. You should consider and read carefully all of the risks and uncertainties described below, as well as other information included in this prospectus, including our consolidated financial statements and related notes appearing elsewhere in this prospectus, before making an investment decision. The risks described below are not the only ones we face. The occurrence of any of the following risks or additional risks and uncertainties not presently known to us or that we currently believe to be immaterial could materially and adversely affect our business, financial condition, or results of operations. In such case, the trading price of our Class A common stock could decline, and you may lose some or all of your original investment.
Risks Related to Our Business, Products, Operations, and Industry
Our recent rapid growth may not be indicative of our future growth. Our limited operating history and recent rapid growth also make it difficult to evaluate our future prospects and may increase the risk that we will not be successful.
Our annualized renewal run-rate, or ARR, was $351.4 million and $580.4 million in the fiscal years ended January 31, 2020 and 2021, respectively, representing a growth rate of 65%. We generated revenue of $336.2 million and $607.6 million for the fiscal years ended January 31, 2020 and 2021, respectively, representing a growth rate of 81%. You should not, however, rely on the ARR or revenue growth of any prior quarterly or annual fiscal period as an indication of our future performance. We were incorporated in June 2015, and as a result of our limited operating history, our ability to accurately forecast our future results of operations is limited and subject to a number of uncertainties, including our ability to plan for and model future growth. Even if our ARR and revenue continue to increase, we expect that our ARR and revenue growth rates will decline in the future as a result of a variety of factors, including the maturation of our business, increased competition, changes to technology, a decrease in the growth of our overall market, or our failure, for any reason, to continue to take advantage of growth opportunities. Overall growth of our business depends on a number of additional factors, including our ability to:
| | price our products effectively so that we are able to attract new customers and expand sales to our existing customers; |
| | expand the functionality and use cases for the products we offer on our platform; |
| | maintain and expand the rates at which customers purchase and renew licenses to our platform; |
| | provide our customers with support that meets their needs; |
| | continue to introduce and sell our products to new markets; |
| | continue to develop new products and new functionality for our platform and successfully further optimize our existing products and infrastructure; |
| | successfully identify and acquire or invest in businesses, products, or technologies that we believe could complement or expand our platform; and |
| | increase awareness of our brand on a global basis and successfully compete with other companies. |
We may not successfully accomplish any of these objectives, and as a result, it is difficult for us to forecast our future results of operations. If the assumptions that we use to plan our business are incorrect or change in reaction to changes in our market, or if we are unable to maintain consistent ARR, revenue, or ARR or revenue
19
Table of Contents
growth, our stock price could be volatile, and it may be difficult to achieve and maintain profitability. You should not rely on our ARR or revenue for any prior quarterly or annual fiscal periods as an indication of our future ARR or revenue or ARR or revenue growth.
In addition, we expect to continue to expend substantial financial and other resources on:
| | our technology infrastructure, including systems architecture, scalability, availability, performance, and security; |
| | our sales and marketing organization to engage our existing and prospective customers, increase brand awareness, and drive adoption of our products; |
| | product development, including investments in our product development team and the development of new products and new functionality for our platform as well as investments in further optimizing our existing products and infrastructure; |
| | acquisitions or strategic investments; |
| | our international operations and continued international expansion; and |
| | general administration, including increased legal and accounting expenses associated with being a public company. |
These investments may not be successful on the timeline we anticipate or at all, and may not result in increased ARR or revenue growth. For instance, we anticipate that our customers will continue to increase adoption of our cloud offerings in future periods. We have offered our cloud-based products for only a short period of time, and we cannot predict how increased adoption of our cloud-based products will change the buying patterns of our customers or impact our future ARR or revenue. If we are unable to maintain or increase our ARR or revenue at a rate sufficient to offset the expected increase in our costs, our business, financial position, and results of operations will be harmed, and we may not be able to achieve or maintain profitability over the long term. Additionally, we have encountered, and may in the future encounter, risks and uncertainties frequently experienced by growing companies in rapidly changing industries, such as unforeseen operating expenses, difficulties, complications, delays, and other known or unknown factors that may result in losses in future periods. If our ARR or revenue growth does not meet our expectations in future periods, our business, financial position, and results of operations may be harmed, and we may not achieve or maintain profitability in the future.
In addition, we will need to appropriately scale our internal business systems and our services organization, including customer support and professional services, to serve our growing customer base. Any failure of or delay in these efforts could result in impaired system performance and reduced customer satisfaction, resulting in decreased sales to new customers, lower dollar-based net retention rates, the issuance of service credits, or requested refunds, which would hurt our ARR or revenue growth and our reputation. Even if we are successful in our expansion efforts, they will be expensive and complex, and require the dedication of significant management time and attention. We could also face inefficiencies or service disruptions as a result of our efforts to scale our internal infrastructure. We cannot be sure that the expansion of and improvements to our internal infrastructure will be effectively implemented on a timely basis, if at all, and such failures could harm our business, financial condition, and results of operations.
We may not be able to successfully manage our growth and, if we are not able to grow efficiently, our business, financial condition, and results of operations could be harmed.
As usage of our platform capabilities grow, we will need to devote additional resources to improving and maintaining our infrastructure and integrating with third-party applications. In addition, we will need to
20
Table of Contents
appropriately scale our internal business systems and our services organization, including customer support and professional services, to serve our growing customer base. Any failure of or delay in these efforts could result in impaired system performance and reduced customer satisfaction, resulting in decreased sales to new customers, lower dollar-based net retention rates, the issuance of service credits, or requested refunds, which would hurt our revenue growth and our reputation. Even if we are successful in our expansion efforts, they will be expensive and complex, and require the dedication of significant management time and attention. We could also face inefficiencies or service disruptions as a result of our efforts to scale our internal infrastructure. We cannot be sure that the expansion of and improvements to our internal infrastructure will be effectively implemented on a timely basis, if at all, and such failures could harm our business, financial condition, and results of operations.
Because we derive substantially all of our revenue from our automation platform, failure of this platform to satisfy customer demands could adversely affect our business, results of operations, financial condition, and growth prospects.
We derive and expect to continue to derive substantially all of our revenue from our automation platform. As such, market adoption of our automation platform is critical to our continued success. Demand for our automation platform may be affected by a number of factors, many of which are beyond our control, including continued market acceptance and integration of our platform into our customers operations, the continued volume, variety, and velocity of automated tasks that are generated through use of our platform, timing of development, and release of new offerings by our competitors, technological change, and the rate of growth in our market. Additionally, the utility of our automation platform and products relies in part on the ability of our customers to use our automation products in connection with other third-party software products that are important to our customers business. If these third-party software providers were to modify the terms of their licensing arrangements with our customers in a manner that would reduce the utility of our products, or increase the cost to use our products, in connection with these third-party software products then our customers may no longer choose to adopt our automation platform or continue to use our products. If we are unable to continue to meet the demands of our customers and the developer community, our business operations, financial results, and growth prospects will be materially and adversely affected.
Our business depends on our existing customers renewing their licenses and purchasing additional licenses and products from us and our channel partners. Declines in renewals or the purchase of additional licenses by our customers could harm our future operating results.
Part of our growth strategy relies on our ability to deliver significant value in a short time to our customers, so that our customers will scale the use of our platform throughout their enterprise. Accordingly, our future success depends in part on our ability to exhibit this value and sell additional licenses and products to our existing customers, and our customers renewing their licenses with us and our channel partners when the contract term expires. Our license agreements primarily have annual terms, and some of our license agreements have multi-year terms. We generally do not sell standalone licenses with a term of less than one year. However, during the term of an annual contract or the last year of a multi-year contract, our customers may enter into an additional license agreement with a termination date that is coterminous with the anniversary date of such annual contract. Our customers have no obligation to renew their licenses for our products after the expiration of their license period. We also provide some customers the opportunity to use our automation platform and products for free prior to purchasing a license. We also work with our customers to identify opportunities for follow-on sales to increase our footprint within their businesses.
In order for us to maintain or improve our results of operations, it is important that our customers renew or expand their licenses with us and our channel partners. We cannot accurately predict our renewals and dollar-based net retention rate given the diversity of our customer base, in terms of size, industry, and geography. Our renewals and dollar-based net retention rate may decline or fluctuate as a result of a number of factors, many of which are outside our control, including the business strength or weakness of our customers, customer usage, including the ability of our customers to quickly integrate our products into their businesses and continually find
21
Table of Contents
new uses for our products within their businesses, customer satisfaction with our products and platform capabilities and customer support, the utility of our platform to cost-effectively integrate with third-party software products, our prices, the capabilities and prices of competing products, mergers and acquisitions affecting our customer base, consolidation of affiliates multiple paid business accounts into a single paid business account or loss of business accounts in their entirety, the effects of global economic conditions, or reductions in our customers spending on information technology, or IT, solutions or their spending levels generally, perceived security or data privacy risks from the use of our products, changes in regulatory regimes that effect our customers or our ability to sell our products, or the views of the industry and public with regard to our products and robotic process automation, or RPA, products generally, including as a result of increased automation and displacement of human workforces. These factors may also be exacerbated if, consistent with our growth strategy, our customer base continues to grow to encompass larger enterprises, which may also require more sophisticated and costly sales efforts. If our customers do not purchase additional licenses and products from us or our customers fail to renew their licenses, our revenue may decline and our business, financial condition, and results of operations may be harmed.
If we are unable to attract new customers, our business, financial condition, and results of operations will be adversely affected.
To increase our revenue, we must continue to attract new customers. Our success will depend to a substantial extent on the widespread adoption of our platform and products as an alternative to existing solutions, including as an alternative to traditional systems relying on manual tasks and processes. Many enterprises have invested substantial personnel and financial resources to integrate traditional human-driven processes into their business architecture and, therefore, may be reluctant or unwilling to migrate to an automation solution. Accordingly, the adoption of automation solutions may be slower than we anticipate. A large proportion of our target market still uses traditional systems relying on manual tasks and processes for the major part of their operations. This market may need further education on the value of automation solutions in general and our platform and products in particular, and on how to integrate them into current operations. A lack of education as to how our automation solutions operate may cause potential customers to prefer more traditional methodologies, to be cautious about investing in our platform and products, or to have difficulty integrating our platform and products into their business architecture. If we are unable to educate potential customers and change the markets readiness to accept our technology, we may experience slower than projected growth.
In addition, as our market matures, our products evolve, and competitors introduce lower cost or differentiated products that are perceived to be alternatives to our platform and products, our ability to sell licenses for our products could be impaired. Similarly, our license sales could be adversely affected if customers or users within these organizations perceive that features incorporated into competitive products reduce the need for our products or if they prefer to purchase other products that are bundled with solutions offered by other companies that operate in adjacent markets and compete with our products. As a result of these and other factors, we may be unable to attract new customers, which may have an adverse effect on our business, financial condition, and results of operations.
The markets in which we participate are competitive and, if we do not compete effectively, our business, financial condition, and results of operations could be harmed.
Our platform and products provide automation solutions that our customers can integrate throughout their businesses. Accordingly, we compete with companies that provide RPA and other automation solutions, including Appian Corporation, Automation Anywhere, Inc., Blue Prism Group PLC, Celonis Inc., EdgeVerve Systems Limited, Kofax Inc., Kyron Systems Inc., Microsoft Corporation, NICE LTD., NTT Ltd., Pegasystems Inc., and WorkFusion, Inc. In addition to RPA software providers, we compete with automation lifecycle technology providers, such as low-code, iBPMS, iPaaS, process mining, and test automation vendors, which develop and market automation capabilities as extensions of their core platforms, and enterprise platform vendors, which provide horizontal applications and productivity tools and are acquiring, building, or investing in
22
Table of Contents
RPA functionality or partnering with RPA providers. We also compete with companies that provide and support the traditional systems relying on manual tasks and processes that our platform and products are designed to replace, including companies that facilitate outsourcing of such tasks and processes to lower cost workers. Our customers may also internally develop their own automated solutions to address tasks particular to their business. Our market may need further education on the value of automation solutions and our platform and products, and on how to integrate them into current operations. A lack of education as to how our automation platform and products operate may cause potential customers to prefer more traditional methodologies or their limited, internally-developed automated processes, to be cautious about investing in our platform and products, or to have difficulty integrating our platform and products into their business architecture. If we are unable to educate potential customers and change the markets readiness to accept our technology, then our business, results of operations, and financial condition may be harmed.
The RPA market is one of the fastest growing enterprise software markets and is increasingly competitive. With the introduction of new technologies and market entrants, we expect that the competitive environment will remain intense going forward. For instance, as our market becomes increasingly driven by cloud-based solutions, native cloud providers may enter this market and provide competitive offerings at lower prices. Additionally, open source alternatives for automation that are offered freely may impact our ability to sell our products to certain customers who may prefer to rely on these tools at no cost. Some of our actual and potential competitors have been acquired by other larger enterprises, have made or may make acquisitions, may enter into partnerships or other strategic relationships that may provide more comprehensive products than they individually had offered or may achieve greater economies of scale than us. In addition, new entrants not currently considered to be competitors may enter the market through acquisitions, partnerships, or strategic relationships. As we look to market and sell our products and platform capabilities to potential customers with existing internal solutions, we must convince their internal stakeholders that our products and platform capabilities are superior to their current solutions.
If we fail to continue to differentiate our platform and products from those offered by our competitors, then our business, results of operations, and financial condition may be harmed.
Our competitors vary in size and in the breadth and scope of the products offered. Many of our competitors and potential competitors have greater name recognition, longer operating histories, more established customer relationships and installed customer bases, larger marketing budgets, and greater resources than we do. Further, other potential competitors not currently offering competitive solutions may expand their product or service offerings to compete with our products and platform capabilities. For instance, a number of our potential competitors already have close, integrated relationships with our customers and potential customers for other service offerings. If any of these potential competitors were to provide an automation solution within their current service offerings as a single, integrated solution, our customers and potential customers may choose to adopt the integrated solution due to administrative ease or other factors that are outside our control. Our current and potential competitors may also establish cooperative relationships among themselves or with third parties that may further enhance their resources and product offerings in our addressable market. Our competitors may be able to respond more quickly and effectively than we can to new or changing opportunities, technologies, standards, and customer requirements. An existing competitor or new entrant could introduce new technology that reduces demand for our products and platform capabilities. In addition to product and technology competition, we face pricing competition. Some of our competitors offer their on-premises or cloud solutions at a lower price, which has resulted in, and may continue to result in, pricing pressures.
For all of these reasons, we may not be able to compete successfully against our current or future competitors, and this competition could result in the failure of our platform to continue to achieve or maintain market acceptance, which would harm our business, results of operations, and financial condition.
23
Table of Contents
If we fail to retain and motivate members of our management team or other key employees, or fail to attract additional qualified personnel to support our operations, our business and future growth prospects would be harmed.
Our success and future growth depend largely upon the continued services of our executive officers, particularly Daniel Dines, our Chief Executive Officer, Co-Founder, and Chairman, as well as our other key employees in the areas of research and development and sales and marketing. Additionally, many members of our management team have been with us for a short period of time or have served in their current roles for a short period of time, including Ashim Gupta, our Chief Financial Officer, who joined us in February 2018 and was promoted to the position of Chief Financial Officer in November 2019, Brad Brubaker, our General Counsel and Chief Legal Officer, who joined us in April 2019, Ted Kummert, our Executive Vice President of Product and Engineering, who joined us in March 2020, and Thomas Hansen, our Chief Revenue Officer, who joined us in April 2020. From time to time, there may be changes in our executive management team or other key employees resulting from hiring or the departure of these personnel. Our executive officers and other key employees are employed on an at-will basis, which means that these personnel could terminate their employment with us at any time. The loss of one or more of our executive officers, or the failure by our executive team to effectively work with our employees and lead our company, could harm our business. We also are dependent on the continued service of our existing software engineers because of the complexity of our products and platform capabilities.
In addition, to execute our growth plan, we must attract and retain highly-qualified personnel. Competition for these personnel is intense, especially for engineers experienced in designing and developing RPA, artificial intelligence, or AI, and machine learning, or ML, applications, and experienced sales professionals. If we are unable to attract such personnel in cities where we are located, we may need to hire in other locations, which may add to the complexity and costs of our business operations. From time to time, we have experienced, and we expect to continue to experience, difficulty in hiring and retaining employees with appropriate qualifications. Many of the companies with which we compete for experienced personnel have greater resources than we have. If we hire employees from competitors or other companies, their former employers may attempt to assert that these employees or we have breached their legal obligations, resulting in a diversion of our time and resources. In addition, prospective and existing employees often consider the value of the equity awards they receive in connection with their employment. If the perceived value of our equity awards declines, experiences significant volatility, or increases such that prospective employees believe there is limited upside to the value of our equity awards, it may adversely affect our ability to recruit and retain key employees. If we fail to attract new personnel or fail to retain and motivate our current personnel, our business and future growth prospects would be harmed.
We have a history of operating losses and have not been profitable in the past. We may not be able to reach and maintain profitability in the future.
We have experienced net losses in each fiscal year since inception. We generated net loss of $519.9 million and $92.4 million for the fiscal years ended January 31, 2020 and 2021, respectively. As of January 31, 2021, we had an accumulated deficit of $970.4 million. While we have experienced significant revenue growth in recent periods, and have not been profitable in prior periods, we are not certain whether we will obtain a high enough volume of sales to sustain or increase our growth or reach and maintain profitability in the future. We also expect our costs and expenses to increase in future periods, which could negatively affect our future results of operations if our revenue does not increase. In particular, we intend to continue to expend significant funds to further develop our platform, including by introducing new products and functionality, and to expand our inside sales team and enterprise sales force to drive new customer adoption, expand use cases and integrations, and support international expansion. We will also face increased compliance costs associated with growth, the expansion of our customer base, and being a public company. Our efforts to grow our business may be costlier than we expect, or the rate of our growth in revenue may be slower than we expect, and we may not be able to increase our revenue enough to offset our increased operating expenses. We may incur significant losses in the future for a number of reasons, including the other risks described herein, and unforeseen expenses, difficulties, complications, or delays, and other unknown events. If we are unable to sustain profitability, the value of our business and Class A common stock may significantly decrease.
24
Table of Contents
The ongoing COVID-19 pandemic and any related economic downturn could negatively impact our business, financial condition, and results of operations.
The ongoing COVID-19 pandemic may prevent us or our employees, customers, partners, suppliers, or vendors or other parties with whom we do business from conducting certain marketing and other business activities for an indefinite period of time, which could adversely impact our business, financial position, and results of operations. Further, in response to the COVID-19 pandemic, many state, local, and foreign governments have put in place, and others in the future may put in place or reinstate, quarantines, executive orders, shelter-in-place orders, and similar government orders and restrictions in order to control the spread of the disease. The reaction to COVID-19, including as a result of such orders or restrictions (or the perception that such orders or restrictions could occur or reoccur), have resulted in business closures, work stoppages, slowdowns, and delays, work-from-home policies, travel restrictions, and cancellation of events, among other effects that could negatively impact productivity and disrupt our operations or those of our customers, partners, suppliers, or vendors or other parties with whom we do business.
In light of the uncertain and rapidly evolving situation relating to the spread of COVID-19 and in compliance with shelter-in-place orders and other government executive orders directing that all non-essential businesses close their physical operations, we have taken measures intended to help minimize the risk of the virus to our employees and the communities in which we participate. These measures include temporarily suspending all non-essential travel worldwide for our employees, canceling, postponing, or holding virtually any UiPath events and discouraging employee attendance at any industry events or in-person work-related meetings. In addition, although we have recently and may continue to selectively reopen certain of our offices in compliance with applicable government orders and public health guidelines, the vast majority of our employees continue to work remotely. We have a distributed workforce and our employees are accustomed to working remotely and working with others who are working remotely. However, the temporary suspension of travel and in-person meetings could negatively impact our marketing efforts, the length or variability of our sales cycles, our international operations and continued international operations, or the length of our average recruiting cycle for employees across the organization. Further, operational or other challenges could arise as we and our customers, partners, suppliers, and vendors and other parties with whom we do business continue to operate remotely. In addition, our management team has spent, and will likely continue to spend, significant time, attention, and resources monitoring the COVID-19 pandemic and seeking to manage its effects on our business and workforce. COVID-19 could also adversely affect workforces, economies, and financial markets globally, potentially leading to an economic downturn and a reduction in customer spending on our products or an inability for our customers, partners, suppliers, or vendors or other parties with whom we do business to meet their contractual obligations.
While it is not possible at this time to predict the duration and extent of the impact that COVID-19 could have on worldwide economic activity and our business in particular, the continued spread of COVID-19, the timeline associated with the roll-out of vaccines, and the measures taken by governments, businesses, and other organizations in response to COVID-19 could adversely impact our business, financial condition, and results of operations. In addition, as a public company we may provide guidance about our business and future operating results, which we expect will be based on assumptions, estimates, and expectations as of the date such guidance is given. Guidance is necessarily speculative in nature and is inherently subject to significant business, economic, and competitive uncertainties and contingencies, many of which are expected to be beyond our control, such as the global economic uncertainty and financial market conditions caused by the COVID-19 pandemic. If we were to revise or fail to meet our announced guidance or expectations of analysts as a result of these factors, the price of our Class A common stock could be negatively affected. Moreover, to the extent the COVID-19 pandemic adversely affects our business, financial condition, and results of operations, it may also have the effect of heightening many of the other risks described in this Risk Factors section, including, but not limited to, those related to our ability to expand within our existing customer base, acquire new customers, develop and expand our sales and marketing capabilities, and expand internationally.
25
Table of Contents
Unfavorable conditions in our industry or the global economy, or reductions in IT spending, could limit our ability to grow our business and negatively affect our results of operations.
Our results of operations may vary based on the impact of changes in our industry or the global economy on us or our customers and potential customers. Unfavorable conditions in the economy both in the United States and abroad, including conditions resulting from changes in gross domestic product growth in the United States or abroad, financial and credit market fluctuations, international trade relations, political turmoil, natural catastrophes, outbreaks of contagious diseases (such as the ongoing COVID-19 pandemic), warfare, and terrorist attacks on the United States, Europe, the Asia Pacific region, or elsewhere, could cause a decrease in business investments, including spending on IT, disrupt the timing and cadence of key industry events, and negatively affect the growth of our business and our results of operations. For example, these types of unfavorable conditions have in the past and could in the future disrupt the timing of and attendance at key industry events, which we rely upon in part to generate sales of our products. If those events are disrupted in the future, our marketing investments, sales pipeline, and ability to generate new customers and sales of our products could be negatively and adversely affected. In addition, our competitors, many of whom are larger and have greater financial resources than we do, may respond to challenging market conditions by lowering prices in an attempt to attract our customers and may be less dependent on key industry events to generate sales for their products. In addition, the increased pace of consolidation in certain industries may result in reduced overall spending on our products. Further, to the extent there is a general economic downturn and our platform is perceived by customers and potential customers as costly, or too difficult to deploy or migrate to, our revenue may be disproportionately affected by delays or reductions in general IT spending. We cannot predict the timing, strength, or duration of any economic slowdown, instability, or recovery, generally or within any particular industry. If the economic conditions of the general economy or markets in which we operate worsen from present levels, our business, results of operations, and financial condition could be adversely affected.
A limited number of customers represent a substantial portion of our revenue and ARR. If we fail to retain these customers, our revenue and ARR could decline significantly.
We derive a substantial portion of our revenue and ARR from sales to our top 10% of customers. As a result, our revenue and ARR could fluctuate materially and could be materially and disproportionately impacted by purchasing decisions of these customers or any other significant future customer. Any of our significant customers may decide to purchase less than they have in the past, may alter their purchasing patterns at any time with limited notice, or may decide not to continue to license our platform and products at all, any of which could cause our revenue and ARR to decline and adversely affect our financial condition and results of operations. If we do not further diversify our customer base, we will continue to be susceptible to risks associated with customer concentration.
We rely on our channel partners to generate a substantial amount of our revenue, and if we fail to expand and manage our distribution channels, our revenue could decline and our growth prospects could suffer.
Our success significantly depends upon maintaining and growing our relationships with a variety of channel partners and we anticipate that we will continue to depend on these partners in order to grow our business. Our channel partners enable us to extend our local and global reach, in particular with smaller customers and in geographies where we have less direct sales presence. For the fiscal years ended January 31, 2020 and 2021, we derived a substantial amount of our revenue from sales through channel partners, and we expect to continue to derive a substantial amount of our revenue from channel partners in future periods. Our agreements with our channel partners are generally non-exclusive and do not prohibit them from working with our competitors or offering competing products, and many of our channel partners may have more established relationships with our competitors. If our channel partners choose to place greater emphasis on products of their own or those offered by our competitors, do not effectively market and sell our products, or fail to meet the needs of our customers, then our ability to grow our business and sell our products may be adversely affected. In addition, the loss of one or more of our larger channel partners, who may cease marketing our products with limited or no notice, and our
26
Table of Contents
possible inability to replace them, could adversely affect our sales. Moreover, our ability to expand our distribution channels depends in part on our ability to educate our channel partners about our platform and products, which can be complex. Our failure to recruit additional channel partners, or any reduction or delay in their sales of our products or conflicts between channel sales and our direct sales and marketing activities may harm our results of operations. Even if we are successful, these relationships may not result in greater customer usage of our products or increased revenue. We also bear the risk that our channel partners will fail to comply with U.S. or international anti-corruption or anti-competition laws, in which case we might be fined or otherwise penalized as a result of the agency relationship with such partners.
In addition, the financial health of our channel partners and our continuing relationships with them are important to our success. Some of these channel partners may be unable to withstand adverse changes in economic conditions, which could result in insolvency and/or the inability of such distributors to obtain credit to finance purchases of our products and services. In addition, weakness in the end-user market could negatively affect the cash flows of our channel partners who could, in turn, delay paying their obligations to us, which would increase our credit risk exposure. Our business could be harmed if the financial condition of some of these channel partners substantially weakened and we were unable to timely secure replacement channel partners.
If we and our channel partners fail to provide sufficient high-quality consulting, training, support, and maintenance resources to enable our customers to realize significant business value from our platform, we may see a decrease in customer adoption of our platform.
Our customers sometimes request consulting and training to assist them in integrating our platform into their business, and rely on our customer support personnel to resolve issues and realize the full benefits that our platform provides. As a result, an increase in the number of customers is likely to increase demand for consulting, training, support, and maintenance related to our products. Given that our customer base and products continue to grow, we will need to provide our customers with more consulting, training, support, and maintenance to enable them to realize significant business value from our platform. We rely on our ecosystem of partners that build, train, and certify skills on our technology, as well as deploy our technology on behalf of their customers. We have been increasing our channel partner and customer enablement through our UiPath Academy and other training initiatives designed to create an ecosystem of people that are skilled in the use and integration of our platform in business operations. However, if we and our channel partners are unable to provide sufficient high-quality consulting, training, integration, and maintenance resources, our customers may not effectively integrate our automation platform into their business or realize sufficient business value from our products to justify follow-on sales, which could impact our future financial performance. Additionally, if our channel partners fail to perform or if the brand for any of our channel partners is harmed, our customers may not choose to rely on our channel partners for consulting, training, integration, and maintenance resources as well. Further, some of our customers are industry leaders, and our contracts with them receive significant public attention. If we or our channel partners encounter problems in helping these customers implement our platform or if there is negative publicity regarding these engagements (even if unrelated to our services or products) our reputation could be harmed and our future financial performance could be negatively impacted. Finally, the investments required to meet the increased demand for our consulting services could strain our ability to deliver our consulting engagements at desired levels of profitability, thereby impacting our overall profitability and financial results.
If we are not able to introduce new features or services successfully and to make enhancements to our platform or products, our business and results of operations could be adversely affected.
Our ability to attract new customers and increase revenue from existing customers depends in part on our ability to enhance and improve our platform and to introduce new features and services. To grow our business and remain competitive, we must continue to enhance our platform with features that reflect the constantly evolving nature of automation and AI technology and our customers evolving needs. The success of new products, enhancements, and developments depends on several factors including, but not limited to: our
27
Table of Contents
anticipation of market changes and demands for product features, including successful product design and timely product introduction and conclusion, sufficient customer demand, cost effectiveness in our product development efforts, and the proliferation of new technologies that are able to deliver competitive products and services at lower prices, more efficiently, more conveniently, or more securely. In addition, because our platform is designed to operate with a variety of systems, applications, data, and devices, we will need to continuously modify and enhance our platform to keep pace with changes in such systems. We may not be successful in developing these modifications and enhancements. Furthermore, the addition of features and solutions to our platform will increase our research and development expenses. Any new features that we develop may not be introduced in a timely or cost-effective manner or may not achieve the market acceptance necessary to generate sufficient revenue to justify the related expenses. It is difficult to predict customer adoption of new features. Such uncertainty limits our ability to forecast our future results of operations and subjects us to a number of challenges, including our ability to plan for and model future growth. If we cannot address such uncertainties and successfully develop new features, enhance our software, or otherwise overcome technological challenges and competing technologies, our business and results of operations could be adversely affected.
We also offer professional services including consulting and training and must continually adapt to assist our customers in deploying our platform in accordance with their specific automation strategies. If we cannot introduce new services or enhance our existing services to keep pace with changes in our customers deployment strategies, we may not be able to attract new customers, retain existing customers, and expand their use of our software or secure renewal contracts, which are important for the future of our business.
We offer free trials and a free tier of our platform to drive awareness of our products, and encourage use and adoption. If these marketing strategies fail to lead to customers purchasing paid licenses, our ability to grow our revenue will be adversely affected.
To encourage awareness, use, familiarity, and adoption of our platform and products, we offer a community edition and enterprise trial version of our software, each of which provides free, online access to certain of our products. This try-before-you-buy strategy may not be successful in driving developer education regarding or leading customers to purchase our products. Many users of our free tier may not lead to others within their organization purchasing and deploying our platform and products. To the extent that users do not become, or we are unable to successfully attract paying customers, we will not realize the intended benefits of these marketing strategies and our ability to grow our revenue will be adversely affected.
We target enterprise customers, and sales to these customers involve risks that may not be present or that are present to a lesser extent with sales to smaller entities.
Our enterprise sales force focuses on sales to large enterprise, organizational, and government agency customers. As of January 31, 2019, we had 305 customers with ARR of $100,000 or more and 21 customers with ARR of $1.0 million or more, which accounted for 69% and 27% of our revenue, respectively, for the fiscal year then ended. As of January 31, 2020, we had 597 customers with ARR of $100,000 or more and 43 customers with ARR of $1.0 million or more, which accounted for 69% and 25% of our revenue, respectively, for the fiscal year then ended. As of January 31, 2021, we had 1,002 customers with ARR of $100,000 or more and 89 customers with ARR of $1.0 million or more, which accounted for 75% and 35% of our revenue, respectively, for the fiscal year then ended. See the section titled Managements Discussion and Analysis of Financial Condition and Results of OperationsKey MetricAnnualized Renewal Run-Rate for a description of ARR. Sales to large customers involve risks that may not be present or that are present to a lesser extent with sales to smaller entities, such as longer sales cycles, more complex customer requirements (and higher contractual risk as a result), substantial upfront sales costs, less favorable terms, and less predictability in completing some of our sales. For example, enterprise customers may require considerable time to evaluate and test our solution and those of our competitors prior to making a purchase decision and placing an order. A number of factors influence the length and variability of our sales cycle, including the need to educate potential customers about the uses and benefits of our automation platform and products, the discretionary nature of purchasing and budget cycles and, the competitive nature of
28
Table of Contents
evaluation and purchasing approval processes. As a result, the length of our sales cycle, from identification of the opportunity to deal closure, may vary significantly from customer to customer, with sales to large enterprises typically taking longer to complete and requiring greater organizational resources. Moreover, large enterprise customers often begin to deploy our products on a limited basis, but nevertheless demand configuration, integration services, and pricing negotiations, which increase our upfront investment in the sales effort with no guarantee that these customers will deploy our products widely enough across their organization to justify our substantial upfront investment.
Real or perceived errors, failures, or bugs in our platform and products could adversely affect our business, results of operations, financial condition, and growth prospects.
Our platform and products are complex and use novel technology. Undetected errors, failures, or bugs have occurred in our platform and products in the past and may occur in the future. Our platform and products are used throughout our customers business environments and with different operating systems, system management software, applications, devices, databases, servers, storage, middleware, custom and third-party applications and equipment, and networking configurations, which may cause errors or failures in the business environment into which our platform and products are deployed. This diversity of applications increases the likelihood of errors or failures in those business environments. Despite testing by us, real or perceived errors, failures, or bugs may not be found until our customers use our platform and products. Such failures or bugs can cause reputational damage, and in some cases can affect our revenue due to the impact of service level commitments that we offer to our customers, as described below.
Our platform and products also empower our customers to develop their own use cases for our automation platform and products. We cannot guarantee that these user-developed automations will be effective or that they do not include errors, failures, or bugs that then may be attributed, correctly or not, to our underlying technologies. For instance, our customers may use our products in a manner in which they were not intended and that could cause our platform or products to be implicated in any resulting errors or failures. Real or perceived errors, failures, or bugs in our platform and products could result in negative publicity, loss of or delay in market acceptance of our platform and products, regulatory investigations and enforcement actions, harm to our brand, weakening of our competitive position, claims by customers for losses sustained by them, or failure to meet the stated service level commitments in our customer agreements. In such an event, we may be required, or may choose, for customer relations or other reasons, to expend significant additional resources in order to help correct the problem. Any errors, failures, or bugs in our platform or products could also impair our ability to attract new customers, retain existing customers, or expand their use of our software, which would adversely affect our business, results of operations, and financial condition.
Incorrect or improper implementation or use of our platform and products could result in customer dissatisfaction and harm our business, results of operations, financial condition, and growth prospects.
Our automation platform and products and related services are designed to be deployed in a wide variety of technology environments, including in large-scale, complex technology environments across a wide range of use cases. We believe our future success will depend, at least in part, on our ability and the ability of our channel partners to support such deployments. Implementations of our platform may be technically complicated and it may not be easy to maximize the value of our platform without proper implementation and training. If our customers are unable to implement our platform successfully, or in a timely manner, or if our customers perceive that the implementation of our platform is too complex or time consuming, customer perceptions of our company and our software may be impaired, our reputation and brand may suffer, and customers may choose not to renew their licenses or increase their purchases of our related services.
We regularly train our customers and channel partners in the proper use of and the variety of benefits that can be derived from our automation platform and products to maximize its potential. We and our channel partners often work with our customers to achieve successful implementations, particularly for large, complex
29
Table of Contents
deployments. Our failure or the failure of our channel partners to train customers on how to efficiently and effectively deploy and use our platform and products, or our failure or the failure of our channel partners to provide effective support or professional services to our customers, whether actual or perceived, may result in negative publicity or legal actions against us. Also, as we continue to expand our customer base, any actual or perceived failure by us or our channel partners to properly provide these services will likely result in lost opportunities for follow-on sales of our related services.
We rely upon third-party providers of cloud-based infrastructure to host our cloud-based products. Any disruption in the operations of these third-party providers, limitations on capacity, or interference with our use could adversely affect our business, financial condition, and results of operations.
Our continued growth depends in part on the ability of our existing and potential customers to continue to adopt and utilize our cloud-based products in conjunction with our platform. We outsource substantially all of the infrastructure relating to our cloud-based products to third-party hosting services. Customers of our cloud-based products expect to be able to access these products at any time, without material interruption or degradation of performance. Our cloud-based products depend on protecting the virtual cloud infrastructure hosted by third-party hosting services by maintaining its configuration, architecture, features, and interconnection specifications, as well as the information stored in these virtual data centers, which is transmitted by third-party internet service providers. Any disruption as a result of cyber-attacks or similar issues, or any limitation on the capacity of our third-party hosting services, could impede our ability to onboard new customers or expand the usage of our existing customers or otherwise adversely affect our business, which could adversely affect our financial condition and results of operations. Due the fact that we rely on third-party providers of cloud-based infrastructure to host our cloud-based products, it may become increasingly difficult to maintain and improve their performance, especially during peak usage times and as our cloud capabilities become more complex and our user traffic increases, because we do not control the infrastructure supporting these services. In addition, any incident affecting our third-party hosting services infrastructure that may be caused by cyber-attacks, natural disasters, fire, flood, severe storm, earthquake, power loss, telecommunications failures, outbreaks of contagious diseases, terrorist or other attacks, and other similar events beyond our control could negatively affect our cloud-based products. If our cloud-based products are unavailable or if our users are unable to access our cloud-based products within a reasonable amount of time or at all, we may experience a loss of customers, lost or delayed market acceptance of our platform and products, delays in payment to us by customers, injury to our reputation and brand, legal claims against us, and the diversion of our resources. We may also incur significant costs for using alternative equipment or taking other actions in preparation for, or in reaction to, events that damage the third-party hosting services we use.
In the event that our service agreements with our third-party hosting services are terminated, or there is a lapse of service, elimination of services or features that we utilize, interruption of internet service provider connectivity or damage to such facilities, we could experience interruptions in access to our cloud-based products as well as significant delays and additional expense in arranging or creating new facilities and services and/or re-architecting our cloud-based products for deployment on a different cloud infrastructure service provider, which could adversely affect our business, financial condition, and results of operations.
We expect fluctuations in our financial results, making it difficult to project future results, and if we fail to meet the expectations of securities analysts or investors with respect to our results of operations, our stock price and the value of your investment could decline.
Our results of operations have fluctuated in the past and are expected to fluctuate in the future due to a variety of factors, many of which are outside of our control. As a result, our past results may not be indicative of our future performance. In addition to the other risks described herein, factors that may affect our results of operations include the following:
| | fluctuations in demand for or pricing of our platform and products; |
30
Table of Contents
| | fluctuations in usage of our platform and products; |
| | fluctuations in our mix of revenue from licenses and service arrangements; |
| | our ability to attract new customers; |
| | our ability to retain our existing customers; |
| | customer expansion rates and the pricing and quantity of licenses renewed; |
| | timing and amount of our investments to expand the capacity of our third-party cloud infrastructure providers; |
| | seasonality; |
| | the investment in new products and features relative to investments in our existing infrastructure and products; |
| | the timing of our customer purchases; |
| | fluctuations or delays in purchasing decisions in anticipation of new products or enhancements by us or our competitors; |
| | changes in customers budgets and in the timing of their budget cycles and purchasing decisions; |
| | our ability to control costs, including our operating expenses; |
| | the amount and timing of payment for operating expenses, particularly sales and marketing and research and development expenses, including commissions; |
| | the amount and timing of non-cash expenses, including stock-based compensation, goodwill impairments, and other non-cash charges; |
| | the amount and timing of costs associated with recruiting, training, and integrating new employees and retaining and motivating existing employees; |
| | the effects of acquisitions and their integration; |
| | general economic conditions, both domestically and internationally, as well as economic conditions specifically affecting industries in which our customers participate; |
| | the impact of new accounting pronouncements; |
| | changes in regulatory or legal environments that may cause us to incur, among other elements, expenses associated with compliance; |
| | changes in the competitive dynamics of our market, including consolidation among competitors or customers; and |
| | significant security breaches of, technical difficulties with, or interruptions to, the delivery and use of our products and platform capabilities. |
31
Table of Contents
Any of these and other factors, or the cumulative effect of some of these factors, may cause our results of operations to vary significantly. If our quarterly results of operations fall below the expectations of investors and securities analysts who follow our stock, the price of our Class A common stock could decline substantially, and we could face lawsuits that are costly and may divert managements attention, including securities class action suits.
Seasonality may cause fluctuations in our sales and results of operations.
Historically, we have experienced seasonality in new and renewal customer bookings, as typically we enter into a higher percentage of license agreements with new customers and renewals with existing customers in the fourth quarter of our fiscal year. We believe that this seasonality results from the procurement, budgeting, and deployment cycles of many of our customers, particularly our enterprise customers. While we believe that this seasonality has affected and will continue to affect our quarterly results, our rapid growth has largely masked seasonal trends to date. We expect that this seasonality will become more pronounced as we continue to target larger enterprise customers and as our rapid growth begins to slow. Seasonal fluctuations in our sales means that our revenue may not be consistent from period to period. Accordingly, you should not expect our quarterly results to be predictive of any future period.
Our key operating metric, ARR, and certain other operational data in this prospectus are subject to assumptions and limitations and may not provide an accurate indication of our future or expected results.
ARR is based on numerous assumptions and limitations, is calculated using our internal data that have not been independently verified by third parties and may not provide an accurate indication of our future or expected results. We define ARR as annualized invoiced amounts per solution sku from subscription licenses and maintenance obligations assuming no increases or reductions in their subscriptions. ARR does not include the costs we may incur to obtain such subscription licenses or provide such maintenance, and does not include invoiced amounts reported as perpetual licenses or professional services revenue in our consolidated statements of operations. ARR is not a forecast of revenue and does not reflect any actual or anticipated reductions in invoiced value due to contract non-renewals or service cancellations other than for specific bad debt or disputed amounts. In addition, dollar-based net retention rate and dollar-based gross retention rate may fluctuate based on the customers that qualify to be included in the cohort used to calculate such metrics. As a result, ARR and our other operational data, like dollar-based net retention rate and dollar-based gross retention rate, may not reflect our actual performance, and investors should consider these metrics in light of the assumptions used in calculating such metrics and limitations as a result thereof. In addition, investors should not place undue reliance on these metrics as an indicator of our future or expected results. Moreover, these metrics may differ from similarly titled metrics presented by other companies and may not be comparable to such other metrics. See the sections titled Managements Discussion and Analysis of Financial Condition and Results of OperationsKey MetricAnnualized Renewal Run-Rate for additional information regarding our ARR and Managements Discussion and Analysis of Financial Condition and Results of OperationsKey Factors Affecting Our Performance for additional information regarding our dollar-based gross retention rate and our dollar-based net retention rate.
If the estimates and assumptions we have used to calculate the size of our addressable market opportunity are inaccurate, our future growth rate may be limited.
We have estimated the size of our addressable market opportunity based on data published by third parties and on internally generated data and assumptions. While we believe our market size information is generally reliable, such information is inherently imprecise, and relies on our and third parties projections, assumptions, and estimates within our target market, which are necessarily subject to a high degree of uncertainty and risk due to a variety of factors, including those described in this prospectus. If such third-party or internally generated data prove to be inaccurate or we make errors in our projections, assumptions, or estimates based on that data, including how current customer data and trends may apply to potential future customers and the number and type
32
Table of Contents
of potential customers, our addressable target market opportunity and/or our future growth rate may be less than we currently estimate. In addition, these inaccuracies or errors may cause us to misallocate capital and other business resources, which could divert resources from more valuable alternative projects and harm our business.
The variables that go into the calculation of our market opportunity are subject to change over time, and there is no guarantee that any particular number or percentage of addressable users or companies covered by our addressable target market opportunity estimates will purchase our products at all or generate any particular level of revenue for us. Any expansion in our market depends on a number of factors, including the cost, performance, and perceived value associated with our platform and products and those of our competitors. Even if our target market meets our size estimates, our business could fail to grow at similar rates, if at all. Our growth is subject to many factors, including our success in expanding our international operations, continuing to expand the use of our products by our customers and otherwise implementing our business strategy, which are subject to many risks and uncertainties. Accordingly, the information regarding the size of our addressable market opportunity included in this prospectus should not be taken as indicative of our future growth.
We may require additional capital to support the growth of our business, and this capital might not be available on acceptable terms, if at all.
We have funded our operations since inception primarily through customer payments and net proceeds from sales of equity securities. We cannot be certain when or if our operations will generate sufficient cash to fully fund our ongoing operations, our planned investments or the growth of our business. We also intend to continue to invest heavily to grow our business to take advantage of our market opportunity rather than optimize for profitability or cash flow in the near term. For example, in the fiscal year ended January 31, 2021, we continued our focus on demonstrating the operational leverage in our business model, while prioritizing investments that will allow us to continue to achieve best-in-class growth and business scale and to capitalize on our significant market opportunity. Our planned investments to drive growth may require us to engage in equity or debt financings to secure additional funds. Additional financing may not be available on terms favorable to us, if at all. If adequate funds are not available on acceptable terms, we may be unable to invest in future growth opportunities, which could harm our business, operating results, and financial condition. If we incur debt, the debt holders would have rights senior to holders of Class A common stock to make claims on our assets, and the terms of any future debt could restrict our operations, including our ability to pay dividends on our Class A common stock. Furthermore, if we issue additional equity securities, stockholders will experience dilution, and the new equity securities could have rights senior to those of our Class A common stock. Because our decision to issue securities in the future will depend on numerous considerations, including factors beyond our control, we cannot predict or estimate the amount, timing, or nature of any future issuances of debt or equity securities. As a result, our stockholders bear the risk of future issuances of debt or equity securities reducing the value of our Class A common stock and diluting their interests.
If we fail to maintain and enhance our brand, our ability to expand our customer base will be impaired and our business, financial condition, and results of operations may suffer.
We believe that maintaining and enhancing the UiPath brand is important to support the marketing and sale of our existing and future products to new customers and expand sales of our platform and products to existing customers. We also believe that the importance of brand recognition will increase as competition in our market increases. Successfully maintaining and enhancing our brand will depend largely on the effectiveness of our marketing efforts, our ability to provide reliable products that continue to meet the needs of our customers at competitive prices, our ability to maintain our customers trust, our ability to show that our products improve efficiency for our customers while improving engagement and satisfaction of their employees, our ability to continue to develop new functionality and use cases, our ability to successfully differentiate our products and platform capabilities from competitive products and our ability to adequately obtain and protect our trademarks and trade names. Our brand promotion activities may not generate customer awareness or yield increased revenue, and even if they do, any increased revenue may not offset the expenses we incur in building our brand.
33
Table of Contents
Our ability to maintain and enhance our brand may also be subject to factors that are outside of our control. For instance, media stories regarding the potential effects on employment of automation and technologies that replace traditional, human-driven systems are commonplace. Unfavorable publicity regarding the impact automation may have on unemployment could harm our brand and reputation, even if unrelated to our products. Such negative publicity could also reduce the potential demand and size of the market for our products and decrease our revenue.
We may not be able to protect all of our registered or unregistered trademarks or trade names relevant to our brand and our rights may be challenged, infringed, circumvented, declared generic, lapsed, or determined to be infringing on or dilutive of other marks. If we are unable to protect our rights in these trademarks and trade names, third parties may file for registration of trademarks similar or identical to our trademarks, thereby impeding our ability to build brand identity and possibly leading to market confusion. If we fail to successfully promote and maintain our brand, our business, financial condition, and results of operations may suffer.
If we cannot maintain our company culture as we grow, our success and our business and competitive position may be harmed.
We believe our culture has been a key contributor to our success to date and that the critical nature of the technology that we develop promotes a sense of greater purpose and fulfillment in our employees. We have developed a culture in which our employees adhere to our core tenets of being humble, bold, immersed, and fast. As we continue to hire more employees to keep pace with our growth, it may become more difficult for us to find employees that exhibit these virtues or to instill them in our new employees. Any failure to preserve our culture could negatively affect our ability to retain and recruit personnel, which is critical to our growth, and to effectively focus on and pursue our corporate objectives. As we grow and develop the infrastructure of a public company, we may find it difficult to maintain these important aspects of our culture. If we fail to maintain our company culture, our business and competitive position may be harmed.
Indemnity provisions in various agreements to which we are party potentially expose us to substantial liability for infringement, misappropriation, or other violation of intellectual property rights, data protection, and other losses.
Our agreements with our customers and other third parties may include indemnification provisions under which we agree to indemnify or otherwise be liable to them for losses suffered or incurred as a result of claims of infringement, misappropriation, or other violation of intellectual property rights, data protection, damages caused by us to property or persons, or other liabilities relating to or arising from our software, services, or platform, our acts or omissions under such agreements, or other contractual obligations. Some of these indemnity agreements provide for uncapped liability and some indemnity provisions survive termination or expiration of the applicable agreement. Large indemnity payments could harm our business, financial condition, and results of operations. Although we attempt to contractually limit our liability with respect to such indemnity obligations, we are not always successful and may still incur substantial liability related to them, and we may be required to cease use of certain functions of our platform or products as a result of any such claims. Any dispute with a customer or other third party with respect to such obligations could have adverse effects on our relationship with such customer or other third party and other existing or prospective customers, reduce demand for our products and services, and adversely affect our business, financial conditions, and results of operations. In addition, although we carry general liability and cyber security insurance, our insurance may not be adequate to indemnify us for all liability that may be imposed or otherwise protect us from liabilities or damages with respect to claims alleging compromises of customer data, and any such coverage may not continue to be available to us on acceptable terms or at all.
34
Table of Contents
Acquisitions, strategic investments, partnerships, or alliances could be difficult to identify, pose integration challenges, divert the attention of management, disrupt our business, dilute stockholder value, and adversely affect our business, financial condition, and results of operations.
We have in the past and may in the future seek to acquire or invest in businesses, joint ventures, products and platform capabilities, or technologies that we believe could complement or expand our services and platform capabilities, enhance our technical capabilities, or otherwise offer growth opportunities. Further, our anticipated proceeds from this offering increase the likelihood that we will devote resources to exploring larger and more complex acquisitions and investments than we have previously attempted. Any such acquisition or investment may divert the attention of management and cause us to incur various expenses in identifying, investigating, and pursuing suitable opportunities, whether or not the transactions are completed, and may result in unforeseen operating difficulties and expenditures. In particular, we may encounter difficulties assimilating or integrating the businesses, technologies, products and platform capabilities, personnel or operations of any acquired companies, particularly if the key personnel of an acquired company choose not to work for us, their software is not easily adapted to work with our platform, or we have difficulty retaining the customers of any acquired business due to changes in ownership, management, or otherwise. For instance, we previously acquired certain products to support our platforms technology through third-party acquisitions, and we may similarly acquire additional technologies in the future to further support the development of our platform. If we cannot adequately integrate these technologies into our platform or if the acquired technologies do not perform as expected, it may harm our product development efforts. Additionally, these transactions may also disrupt our business, divert our resources, and require significant management attention that would otherwise be available for development of our existing business. Any such transactions that we are able to complete may not result in any synergies or other benefits we had expected to achieve, which could result in impairment charges that could be substantial. In addition, we may not be able to find and identify desirable acquisition targets or business opportunities or be successful in entering into an agreement with any particular strategic partner. These transactions could also result in dilutive issuances of equity securities or the incurrence of debt, which could adversely affect our results of operations. In addition, if the resulting business from such a transaction fails to meet our expectations, our business, financial condition, and results of operations may be adversely affected or we may be exposed to unknown risks or liabilities.
Our business, financial condition, results of operations, or cash flows could be significantly hindered by the occurrence of a natural disaster, terrorist attack, or other catastrophic event.
Our business operations may be susceptible to outages due to fire, floods, unusual weather conditions, power loss, telecommunications failures, terrorist attacks, and other events beyond our control. Natural disasters including tornados, hurricanes, floods, and earthquakes may damage the facilities of our customers or those of their suppliers or retailers or their other operations, which could lead to reduced revenue for our customers and thus reduced sales. In addition, a substantial portion of our operations rely on support from our headquarters in New York City and our office in Bucharest, Romania. To the extent that fire, floods, unusual weather conditions, power loss, telecommunications failures, terrorist attacks, and other events beyond our control materially impacts our ability to operate those offices, it may have a material impact on our business operations as a whole.
To the extent that such events disrupt our business or the business of our current or prospective customers, or adversely impact our reputation, such events could adversely affect our business, financial condition, results of operations, and cash flows.
Any future litigation against us could be costly and time-consuming to defend.
We are, and may become, subject to legal proceedings and claims that arise in the ordinary course of business, such as claims brought by our customers in connection with commercial disputes or employment claims made by our current or former employees. Litigation might result in substantial costs and may divert managements attention and resources, which might seriously harm our business, financial condition, and results of operations. Insurance might not cover such claims, might not provide sufficient payments to cover all the costs
35
Table of Contents
to resolve one or more such claims, and might not continue to be available on terms acceptable to us. A claim brought against us that is uninsured or underinsured could result in unanticipated costs, potentially harming our business, financial position, and results of operations.
Risks Related to Data Privacy and Cybersecurity
We are subject to stringent and changing laws, regulations and standards, information security policies, and contractual obligations related to data privacy and security.
We have legal and contractual obligations regarding confidentiality and the protection and appropriate use of personally identifiable information and other proprietary or confidential information. Data privacy has become a significant issue in the United States, countries in the European Union, or EU, and in many other countries in which we operate and where we offer our platform for sale. The regulatory framework for privacy issues worldwide is rapidly evolving and is likely to remain uncertain for the foreseeable future. Many government bodies and agencies have adopted or are considering adopting laws and regulations regarding the collection, use, storage, and disclosure of personal information and breach notification procedures. We are also required to comply with laws, rules, and regulations relating to data security. Interpretation of these privacy and security laws, rules, and regulations and their application to our platform in applicable jurisdictions is ongoing and cannot be fully determined at this time.
In the United States, these include rules and regulations promulgated under the authority of the Federal Trade Commission, the Electronic Communications Privacy Act, the Computer Fraud and Abuse Act, the California Consumer Privacy Act, or CCPA, and other U.S. state and federal laws relating to privacy and data security. The CCPA requires covered businesses to provide new disclosures to California residents and to provide them new ways to opt-out of the sale of personal information, and provides a private right of action and statutory damages for data breaches. Although there are limited exemptions under the CCPA (for example, business-to-business communications), the CCPA could impact our business depending on how the CCPA will be interpreted and exemplifies the vulnerability of our business to the evolving regulatory environment related to personal information. The CCPA may increase our compliance costs and potential liability. Other jurisdictions in the United States are beginning to propose laws similar to the CCPA. Some observers have noted that the CCPA could mark the beginning of a trend toward more stringent privacy legislation in the United States, which could increase our potential liability and adversely affect our business, results of operations, and financial condition. In addition, California voters recently approved the California Privacy Rights Act of 2020, or CPRA, that goes into effect on January 1, 2023. It is expected that the CPRA would, among other things, give California residents the ability to limit the use of their sensitive information, provide for penalties for CPRA violations concerning California residents under the age of 16, and establish a new California Privacy Protection Agency to implement and enforce the law.
As a result of our international operations, we must comply with a multitude of data security and privacy laws that may vary significantly from jurisdiction to jurisdiction. Virtually every jurisdiction in which we operate has established or is in the process of establishing data security and privacy legal frameworks with which we or our customers must comply. Our failure to comply with the laws of each jurisdiction may subject us to significant penalties. For example, the data protection landscape in Europe is currently unstable, resulting in possible significant operational costs for internal compliance and risk to our business. The European Economic Area, or EEA, Switzerland, and the United Kingdom adopted the General Data Protection Regulation, or GDPR, which went into effect in May 2018 and contains strict requirements for processing the personally identifiable information of individuals residing in the EEA, Switzerland, and the United Kingdom. The GDPR has increased, and will continue to increase, our compliance burdens, including by mandating potentially burdensome documentation requirements and granting certain rights to individuals to control how we collect, use, disclose, retain, and process information about them. In particular, under the GDPR, fines of up to 20 million euros or up to 4% of the annual global revenue of the noncompliant company, whichever is greater, could be imposed for violations of certain of the GDPRs requirements. Such penalties are in addition to any civil litigation claims by customers and data subjects. The GDPR requirements apply not only to third-party transactions, but also to transfers of information between us and our subsidiaries, including employee information.
36
Table of Contents
European data protection laws including the GDPR also generally prohibit the transfer of personal data from Europe, including the EEA and Switzerland, to the United States and most other countries unless the parties to the transfer have implemented specific safeguards to protect the transferred personal data. One of the primary safeguards used for transfers of personal data from the EU to the United States, namely, the Privacy Shield framework administered by the U.S. Department of Commerce, was recently invalidated by a decision of the EUs highest court. The Swiss Federal Data Protection and Information Commissioner also recently opined that the Swiss-U.S. Privacy Shield is inadequate for transfers of data from Switzerland to the United States. These decisions also cast doubt on our ability to use one of the primary alternatives to the Privacy Shield, namely, the European Commissions Standard Contractual Clauses, to lawfully transfer personal data from Europe to the United States and most other countries. At present, there are few if any viable alternatives to the Standard Contractual Clauses, on which we have relied for transfers of personal data from the EEA and Switzerland to the United States and other countries. The European Commission recently proposed updates to the Standard Contractual Clauses. As such, our transferring of personal data from the EEA and Switzerland may not comply with European data protection law; may increase our exposure to the GDPRs heightened sanctions for violations of its cross-border data transfer restrictions; and may reduce demand for our services from companies subject to European data protection laws. Loss of our ability to transfer personal data from the EEA or Switzerland may also require us to increase our data processing capabilities in those jurisdictions at significant expense. Inability to import personal information from the EEA or Switzerland to the United States may decrease demand for our products and services as our customers that are subject to the GDPR may seek alternatives that do not involve personal information transfers out of those jurisdictions. Additionally, other countries outside of Europe have enacted or are considering enacting similar cross-border data transfer restrictions and laws requiring local data residency, which could increase the cost and complexity of delivering our services and operating our business.
Further, the United Kingdoms decision to leave the EU, often referred to as Brexit, created uncertainty with regard to data protection regulation in the United Kingdom. Following December 31, 2020, the GDPRs data protection obligations continue to apply to the United Kingdom in substantially unvaried form under the so called UK GDPR. More explicitly, the GDPR continues to form part of the laws in the United Kingdom by virtue of section 3 of the European Union (Withdrawal) Act 2018, as amended (including by the various Data Protection, Privacy and Electronic Communications (EU Exit) Regulations), which potentially exposes us to two parallel data protection regimes, each of which authorizes fines and the potential for divergent enforcement actions. In addition, it is still unclear whether the transfer of personal data from the EU to the United Kingdom will in the future continue to remain lawful under the GDPR. For example, pursuant to a post-Brexit agreement between the United Kingdom and the EU, the European Commission will continue to treat the United Kingdom as if it remained a member state of the EU in relation to transfers of personal data from the EEA to the United Kingdom, meaning such transfers may be made without a need for additional safeguards, for four months from January 1, 2021, with a potential additional two month extension. This transition period, however, will end if and when the European Commission adopts an adequacy decision in respect of the United Kingdom or the United Kingdom amends certain UK data protection laws, or relevant aspects thereof, without the EUs consent (unless those amendments are made simply to align those UK data protection laws with the EUs data protection regime). If the European Commission does not adopt an adequacy decision with regard to personal data transfers to the United Kingdom before the expiration of the transition period, from that point onwards, the United Kingdom will be a third country under the GDPR and such transfers will need to be made subject to GDPR-compliant safeguards (for example, the Standard Contractual Clauses). Additionally, countries outside of Europe, including without limitation Brazil that recently enacted the General Data Protection Law, or LGPD, are implementing significant limitations on the processing of personal information similar to those in the GDPR.
Complying with privacy and data protection laws and regulations may cause us to incur substantial operational costs or require us to change our business practices. Despite our efforts to bring practices into compliance with these laws and regulations, we may not be successful in our efforts to achieve compliance either due to internal or external factors such as resource allocation limitations or a lack of vendor cooperation. Noncompliance could result in proceedings against us by governmental and regulatory entities, customers, data subjects or others. We may also experience difficulty retaining or obtaining new European or multi-national customers due to the legal requirements, compliance cost, potential risk exposure and uncertainty for these entities, and we may experience significantly increased liability with respect to these customers pursuant to the terms set forth in our engagements with them. In addition to government regulation, privacy advocates and
37
Table of Contents
industry groups may propose new and different self-regulatory standards that may apply to us. Because the interpretation and application of privacy and data protection laws are uncertain, it is possible that these laws and other actual or alleged legal obligations, such as contractual or self-regulatory obligations, may be interpreted and applied in a manner that is inconsistent with our existing data management practices or the features of our platform or in a manner inconsistent across the various jurisdictions in which we operate. If so, in addition to the possibility of fines, lawsuits, and other claims, we could be required to fundamentally change our business activities and practices or modify our platform, which could have an adverse effect on our business. Any inability to adequately address privacy concerns, even if unfounded, or comply with applicable privacy or data protection laws, regulations, and policies, could result in additional cost and liability to us, damage our reputation, inhibit sales, and adversely affect our business, results of operations, and financial condition.
Additionally, we publish privacy policies and other documentation regarding our collection, processing, use, and disclosure of personal information. Although we endeavor to comply with our published policies and other documentation, we may at times fail to do so or may be perceived to have failed to do so. Moreover, despite our efforts, we may not be successful in achieving compliance if our employees, contractors, service providers, or vendors fail to comply with our published policies and documentation. Such failures can subject us to potential foreign, federal, state, and local action if they are found to be deceptive, unfair, or misrepresentative of our actual practices. Claims that we have violated individuals privacy rights or failed to comply with data protection laws or applicable privacy notices, even if we are not found liable, could be expensive and time-consuming to defend and could result in adverse publicity that could harm our business.
If the security of the personal information that we (or our vendors) collect, store, or process is compromised or is otherwise accessed without authorization, or if we fail to comply with our commitments and assurances regarding the privacy and security of such information, our reputation may be harmed and we may be exposed to liability and loss of business.
We collect and maintain data about individuals and customers, including personally identifiable information, as well as other confidential or proprietary information. We may use third-party service providers and sub-processors to help us deliver services to our customers. These vendors may store or process personal information on our behalf.
Cyberattacks and other malicious internet-based activity continue to increase. In addition to traditional computer hackers, malicious code (such as viruses and worms), employee theft or misuse, and denial-of-service attacks, sophisticated nation-state and nation-state supported actors now engage in attacks (including advanced persistent threat intrusions). We cannot guarantee that our or our vendors security measures will be sufficient to protect against unauthorized access to or other compromise of personal information and our confidential or proprietary information. Due to the COVID-19 pandemic, our employees are temporarily working remotely, which may pose additional data security risks. The techniques used to sabotage or to obtain unauthorized access to our or our vendors platforms, systems, networks and/or physical facilities in which data is stored or through which data is transmitted change frequently, and we or our vendors may be unable to implement adequate preventative measures or stop security breaches while they are occurring. The recovery systems, security protocols, network protection mechanisms, and other security measures that we have integrated into our platform, systems, networks, and physical facilities and any such measures implemented by our vendors, which are designed to protect against, detect, and minimize security breaches, may not be adequate to prevent or detect service interruption, system failure, or data loss. Our platform, systems, networks, and physical facilities, and those of our vendors, in the past have been, and in the future could be, breached and personal information has been and could be otherwise compromised. Third parties could attempt to fraudulently induce our employees or our customers to disclose information or user names and/or passwords, or otherwise compromise the security of our platform, networks, systems, and/or physical facilities. Third parties have exploited in the past, and could exploit in the future, vulnerabilities in, or could obtain unauthorized access to, platforms, systems, networks, and/or physical facilities utilized by our vendors.
We are required to comply with laws, rules, regulations and other obligations that require us to maintain the security of personal information. We may have contractual and other legal obligations to notify relevant stakeholders of security breaches. We operate in an industry that is prone to cyber-attacks. We have previously
38
Table of Contents
and may in the future become the target of cyber-attacks by third parties seeking unauthorized access to such data, including our or our customers data or to disrupt our ability to provide our services. Failure to prevent or mitigate cyber-attacks could result in the unauthorized access to personal information. Most jurisdictions have enacted laws requiring companies to notify individuals, regulatory authorities, and others of security breaches involving certain types of data. In addition, our agreements with certain customers and partners may require us to notify them in the event of a security breach. Such mandatory disclosures are costly, could lead to negative publicity, may cause our customers to lose confidence in the effectiveness of our security measures and require us to expend significant capital and other resources to respond to and/or alleviate problems caused by the actual or perceived security breach. A security breach of any of our vendors that processes personal information of our customers may pose similar risks. The costs to respond to a security breach and/or to mitigate any security vulnerabilities that may be identified could be significant, our efforts to address these issues may not be successful, and these issues could result in interruptions, delays, cessation of service, negative publicity, loss of customer trust, diminished use of our products and services as well as other harms to our business and our competitive position. Remediation of any potential security breach may involve significant time, resources, and expenses. Any security breach may result in regulatory inquiries, litigation or other investigations, and can affect our financial and operational condition.
A security breach may cause us to breach customer contracts. Our agreements with certain customers may require us to use industry-standard or reasonable measures to safeguard personal information. We also may be subject to laws that require us to use industry-standard or reasonable security measures to safeguard personal information. A security breach could lead to claims by our customers or other relevant stakeholders that we have failed to comply with such legal or contractual obligations. As a result, we could be subject to legal action or our customers could end their relationships with us. There can be no assurance that the limitations of liability in our contracts would be enforceable or adequate or would otherwise protect us from liabilities or damages, and in some cases our customer agreements do not limit our remediation costs or liability with respect to data breaches.
Litigation resulting from security breaches may adversely affect our business. Unauthorized access to our platform, systems, networks, or physical facilities, or those of our vendors, could result in litigation with our customers or other relevant stakeholders. These proceedings could force us to spend money in defense or settlement, divert managements time and attention, increase our costs of doing business, or adversely affect our reputation. We could be required to fundamentally change our business activities and practices or modify our products and/or platform capabilities in response to such litigation, which could have an adverse effect on our business. If a security breach were to occur, and the confidentiality, integrity, or availability of personal information was disrupted, we could incur significant liability, or our platform, systems, or networks may be perceived as less desirable, which could negatively affect our business and damage our reputation.
We may not have adequate insurance coverage for security incidents or breaches. The successful assertion of one or more large claims against us that exceeds our available insurance coverage, or results in changes to our insurance policies (including premium increases or the imposition of large deductible or co-insurance requirements), could have an adverse effect on our business. In addition, we cannot be sure that our existing insurance coverage and coverage for errors and omissions will continue to be available on acceptable terms or that our insurers will not deny coverage as to any future claim.
Risks Related to Regulatory Compliance and Governmental Matters
We are subject to anti-corruption, anti-bribery, anti-money laundering, and similar laws and noncompliance with such laws can subject us to criminal or civil liability and harm our business, financial condition, and results of operations.
We are subject to the U.S. Foreign Corrupt Practices Act, or FCPA, U.S. domestic bribery laws, the United Kingdom Bribery Act, and other anti-corruption and anti-money laundering laws in the countries in which we conduct activities. Due to the international scope of our operations, we must comply with these laws in each jurisdiction where we operate. Additionally, many anti-bribery and anti-corruption laws, including the FCPA, have
39
Table of Contents
long-arm statutes that can expand the applicability of these laws to our operations worldwide. Accordingly, we must incur significant operational costs to support our ongoing compliance with anti-bribery and anti-corruption laws at all levels of our business. If we fail to comply with these laws we may be subject to significant penalties. Anti-corruption and anti-bribery laws have been enforced aggressively in recent years and are interpreted broadly to generally prohibit companies, their employees and their third-party intermediaries from authorizing, offering, or providing, directly or indirectly, improper payments or benefits to recipients in the public or private sector. As we increase our international sales and business and sales to the public sector, we may engage with business partners and third-party intermediaries to market our products and to obtain necessary permits, licenses, and other regulatory approvals. In addition, we or our third-party intermediaries may have direct or indirect interactions with officials and employees of government agencies or state-owned or affiliated entities. We can be held liable for the corrupt or other illegal activities of these third-party intermediaries, our employees, representatives, contractors, partners, and agents, even if we do not explicitly authorize such activities.
While we have policies and procedures to address compliance with such laws, we cannot assure you that all of our employees and agents will not take actions in violation of our policies and applicable law, for which we may be ultimately held responsible. As we increase our international sales and business, our risks under these laws may increase.
Detecting, investigating, and resolving actual or alleged violations of anti-corruption laws can require a significant diversion of time, resources, and attention from senior management. In addition, noncompliance with anti-corruption, anti-bribery, or anti-money laundering laws could subject us to whistleblower complaints, investigations, sanctions, settlements, prosecution, enforcement actions, fines, damages, other civil or criminal penalties or injunctions, suspension or debarment from contracting with certain persons, reputational harm, adverse media coverage, and other collateral consequences. If any subpoenas or investigations are launched, or governmental or other sanctions are imposed, or if we do not prevail in any possible civil or criminal proceeding, our business, financial condition, and results of operations could be harmed. In addition, responding to any action will likely result in a materially significant diversion of managements attention and resources and significant defense costs and other professional fees.
Sales to government entities and highly regulated organizations are subject to a number of challenges and risks.
We currently sell, and anticipate continuing to sell, to U.S. federal, state, and local, as well as foreign, governmental agency customers, as well as to customers in highly regulated industries such as financial services and healthcare. Sales to such customers are subject to a number of challenges and risks. Selling to such customers can be highly competitive, expensive, and time-consuming, often requiring significant upfront time and expense without any assurance that these efforts will generate a sale. These current and prospective customers may also be required to comply with stringent regulations in connection with purchasing and implementing our platform and products or particular regulations regarding third-party vendors that may be interpreted differently by different customers. In addition, regulatory agencies may impose requirements on third-party vendors generally, or our company in particular, that we may not be able to, or may not choose to, meet. In addition, government customers and customers in these highly regulated industries often have a right to conduct audits of our systems, products, and practices. In the event that one or more customers determine that some aspect of our business does not meet regulatory requirements, we may be limited in our ability to continue or expand our business. In addition, if our platform and products do not meet the standards of new or existing regulations, we may be in breach of our contracts with these customers, allowing them to terminate their agreements.
Government contracting requirements may also change and in doing so restrict our ability to sell into the government sector until we have attained the requisite approvals. Government demand and payment for our products are affected by public sector budgetary cycles and funding authorizations, with funding reductions or delays adversely affecting public sector demand for our products.
40
Table of Contents
These customers may also be subject to a rapidly evolving regulatory framework that may implicate their ability to use our platform and products. Moreover, changes in the underlying statutory and regulatory conditions that affect these types of customers could harm our ability to efficiently provide them access to our platform and to grow or maintain our customer base. If we are unable to enhance our platform and products to keep pace with evolving customer requirements, or if new technologies emerge that are able to deliver competitive products at lower prices, more efficiently, more conveniently, or more securely than our platform, our business, financial condition, and results of operations could be adversely affected.
Further, governmental and highly regulated entities may demand contract terms that differ from our standard arrangements and are less favorable than terms agreed with private sector customers, including preferential pricing or most favored nation terms and conditions or are contract provisions that are otherwise time-consuming and expensive to satisfy. In the United States, applicable federal contracting regulations change frequently, and the President may issue executive orders requiring federal contractors to adhere to new compliance requirements after a contract is signed. If we undertake to meet special standards or requirements and do not meet them, we could be subject to significant liability from our customers or regulators. Even if we do meet these special standards or requirements, the additional costs associated with providing our platform to government and highly regulated customers could harm our operating results. In addition, engaging in sales activities to foreign governments introduces additional compliance risks specific to the FCPA, the United Kingdom Bribery Act, and other similar statutory requirements prohibiting bribery and corruption in the jurisdictions in which we operate.
Such entities may have statutory, contractual, or other legal rights to terminate contracts with us or our partners for convenience or for other reasons. Any such termination may adversely affect our ability to contract with other government customers as well as our reputation, business, financial condition, and results of operations.
We are subject to governmental export and import controls that could impair our ability to compete in international markets or subject us to liability if we violate the controls.
Our business activities are subject to various export, import, and trade and economic sanction laws and regulations, including, among others, the U.S. Export Administration Regulations, administered by the U.S. Department of Commerces Bureau of Industry and Security, and economic and trade sanctions regulations maintained by the U.S. Department of the Treasurys Office of Foreign Assets Control, which we refer to collectively as Trade Controls. Trade Controls may prohibit or restrict the sale or supply of certain products, including encryption items and other technology, and services to certain governments, persons, entities, countries, and territories, including those that are the target of comprehensive sanctions.
While we have implemented controls designed to promote and achieve compliance with applicable Trade Controls, our platform and products may have in the past, and could in the future, violate, or be provided in violation of, such laws, despite the precautions we take. Any failure to comply with applicable Trade Controls may materially affect us through reputational harm, as well as other negative consequences, including government investigations and penalties. Accordingly, we must incur significant operational costs to support our ongoing compliance with Trade Controls at all levels of our business.
Also, various countries, in addition to the United States, have enacted Trade Controls that could limit our ability to distribute our platform and products or could limit our customers ability to implement our platform and products in those countries. Changes in our platform or products or future changes in Trade Controls may create delays in the introduction of our platform and products in international markets or, in some cases, prevent the export or import of our platform and products to certain countries, governments, or persons altogether. Any change in Trade Controls could result in decreased use of our platform and products by, or in our decreased ability to export or sell our platform and products to, existing or potential customers. Any decreased use of our
41
Table of Contents
platform or products or limitation on our ability to export or sell our platform and products would adversely affect our business, results of operations, and growth prospects.
Risks Related to our Intellectual Property
Any failure to obtain, maintain, protect, or enforce our intellectual property and proprietary rights could impair our ability to protect our proprietary technology and our brand.
Our success depends to a significant degree on our ability to obtain, maintain, protect, and enforce our intellectual property rights, including our proprietary technology, know-how, and our brand. We rely on a combination of trademarks, trade secret laws, patents, copyrights, service marks, contractual restrictions, and other intellectual property laws and confidentiality procedures to establish and protect our proprietary rights. However, the steps we take to obtain, maintain, protect, and enforce our intellectual property rights may be inadequate. We may not be able to protect our intellectual property rights if, for example, we are unable to enforce our rights against infringement or misappropriation, or if we do not detect unauthorized use of our intellectual property rights. If we fail to protect our intellectual property rights adequately, our competitors may gain access to our proprietary technology and develop and commercialize substantially identical products, services, or technologies and our business, financial condition, results of operations, or prospects may be harmed.
In addition, defending our intellectual property rights may entail significant expense. Any patent, trademark, or other intellectual property rights that we have or may obtain may be challenged or circumvented by others or invalidated or held unenforceable through administrative processes, including re-examination, inter partes review, interference, and derivation proceedings and equivalent proceedings in foreign jurisdictions (e.g., opposition, invalidation, and cancellation proceedings) or litigation. Moreover, there can be no assurance that our pending patent applications will result in issued patents. Even if we continue to seek patent protection in the future, we may be unable to obtain or maintain patent protection for our technology. In addition, any patents issued from pending or future patent applications or licensed to us in the future may not be sufficiently broad to protect our proprietary technologies, may not provide us with competitive advantages, or may be successfully challenged by third parties. The United States Patent and Trademark Office and various foreign governmental patent and trademark agencies also require compliance with a number of procedural, documentary, fee payment, and other similar provisions during the patent and trademark application process and after a patent or trademark registration has issued. There are situations in which noncompliance can result in abandonment or lapse of the patent, patent application, or trademark filing, resulting in partial or complete loss of patent or trademark rights in the relevant jurisdiction. If this occurs, our competitors might be able to enter the market.
Furthermore, legal standards relating to the validity, enforceability, and scope of protection of intellectual property rights are uncertain. Despite our precautions, it may be possible for unauthorized third parties to copy our brands, products and platform capabilities, and use information that we regard as proprietary to create brands and products that compete with ours. Effective patent, trademark, copyright, and trade secret protection may not be available to us or commercially feasible in every country in which our products are available. Further, intellectual property law, including statutory and case law, particularly in the United States, is constantly developing, and any changes in the law could make it harder for us to enforce our rights. The value of our intellectual property could diminish if others assert rights in or ownership of our trademarks, patents, and other intellectual property rights, or adopt trademarks that are similar to our trademarks. We may be unable to successfully resolve these types of conflicts to our satisfaction. In some cases, as noted below, litigation or other actions may be necessary to protect or enforce our trademarks, patents, and other intellectual property rights against infringement or misappropriation. As we expand our international activities, our exposure to unauthorized copying and use of our products and platform capabilities and proprietary information will likely increase. Moreover, policing unauthorized use of our technologies, trade secrets, and intellectual property may be difficult, expensive, and time-consuming, particularly in foreign countries where the laws may not be as protective of intellectual property rights as those in the United States and where mechanisms for enforcement of intellectual property rights may be weak or inadequate. Accordingly, despite our efforts, we may be unable to
42
Table of Contents
prevent third parties from infringing upon, misappropriating, or otherwise violating our intellectual property rights. Any of the foregoing could adversely impact our business, financial condition, and results of operations.
We may become subject to intellectual property disputes, which are costly and may subject us to significant liability and increased costs of doing business.
We are from time-to-time subject to intellectual property disputes. Our success depends, in part, on our ability to develop and commercialize our products and services without infringing, misappropriating, or otherwise violating the intellectual property rights of third parties. However, we may not be aware that our products or services are infringing, misappropriating, or otherwise violating third-party intellectual property rights and such third parties may bring claims alleging such infringement, misappropriation, or violation. As one example, there may be issued patents of which we are not aware, held by third parties that, if found to be valid and enforceable, could be alleged to be infringed by our current or future technologies or products. There also may be pending patent applications of which we are not aware that may result in issued patents, which could be alleged to be infringed by our current or future technologies or products. Because patent applications can take years to issue and are often afforded confidentiality for some period of time there may currently be pending applications, unknown to us, that later result in issued patents that could cover our current or future technologies or products.
Lawsuits can be time-consuming and expensive to resolve and can divert managements time and attention. The software industry in which we operate is characterized by the existence of a large number of patents, copyrights, trademarks, trade secrets, and other intellectual and proprietary rights. Companies in the software industry are often required to defend against litigation claims based on allegations of infringement, misappropriation, or other violations of intellectual property rights. Our technologies may not be able to withstand any third-party claims against their use. In addition, many companies have the capability to dedicate substantially greater resources to enforce their intellectual property rights and to defend claims that may be brought against them, than we can. In a patent infringement claim against us, we may assert, as a defense, that we do not infringe the relevant patent claims, that the patent is invalid, or both. The strength of our defenses may depend on the patents asserted, the interpretation of these patents, or our ability to invalidate the asserted patents. However, we could be unsuccessful in advancing non-infringement and/or invalidity arguments in our defense. In the United States, issued patents enjoy a presumption of validity, and the party challenging the validity of a patent claim must present clear and convincing evidence of invalidity, which is a high burden of proof. Conversely, the patent owner need only prove infringement by a preponderance of the evidence, which is a lower burden of proof. We do not currently have a large number of issued patents, which could prevent us from deterring patent infringement claims through our own patent portfolio, and our competitors and others may now and in the future have significantly larger and more mature patent portfolios than we have. Any litigation may also involve patent holding companies or other adverse patent owners that have no relevant product revenue, and therefore, our patents may provide little or no deterrence as we would not be able to assert them against such entities or individuals.
An adverse result in any infringement or misappropriation proceeding could subject us to significant damages, injunctions, and reputational harm. If a third party is able to obtain an injunction preventing us from accessing such third-party intellectual property rights, or if we cannot license or develop alternative technology for any infringing aspect of our business, we may be forced to limit or stop sales of our relevant products and platform capabilities or cease business activities related to such intellectual property. Although we carry general liability and intellectual property insurance, our insurance may not cover potential claims of this type or may not be adequate to indemnify us for all liability that may be imposed. We cannot predict the outcome of lawsuits and cannot ensure that the results of any such actions will not have an adverse effect on our business, financial condition, or results of operations. Any intellectual property litigation to which we might become a party, or for which we are required to provide indemnification, may require us to do one or more of the following:
| | cease selling or using products or services that incorporate the intellectual property rights that we allegedly infringe, misappropriate, or violate; |
43
Table of Contents
| | make substantial payments for legal fees, settlement payments, or other costs or damages; |
| | obtain a license, which may not be available on reasonable terms or at all, to sell or use the relevant technology; |
| | redesign the allegedly infringing products to avoid infringement, misappropriation, or violation, which could be costly, time-consuming, or impossible; |
| | rebrand our products and services and/or be prevented from selling some of our products or services if third parties successfully oppose or challenge our trademarks or successfully claim that we infringe, misappropriate or otherwise violate their trademarks or other intellectual property rights; and |
| | limit the manner in which we use our brands, or prevent us from using our brands in particular jurisdictions. |
Even if the claims do not result in litigation or are resolved in our favor, these claims, and the time and resources necessary to resolve them, could divert the resources of our management and harm our business and operating results. Moreover, there could be public announcements of the results of hearings, motions, or other interim proceedings or developments and if securities analysts or investors perceive these results to be negative, it could have a substantial adverse effect on the price of our common stock. The occurrence of infringement and misappropriation claims may grow as the market for our platform and products grows. Accordingly, our exposure to damages resulting from infringement claims could increase and this could further exhaust our financial and management resources. Any of the foregoing could adversely impact our business, financial condition, and results of operations.
We may become involved in lawsuits to protect or enforce our intellectual property, which could be expensive, time consuming, and unsuccessful.
Third parties, including our competitors, could be infringing, misappropriating, or otherwise violating our intellectual property rights. In order to protect our intellectual property rights, we may be required to spend significant resources to monitor and protect our intellectual property rights. Litigation may be necessary in the future to enforce our intellectual property rights and to protect our trade secrets. Litigation brought to protect and enforce our intellectual property rights could be costly, time-consuming, and distracting to management, and could result in the impairment or loss of portions of our intellectual property.
Further, our efforts to enforce our intellectual property rights may be met with defenses, counterclaims, and countersuits attacking the validity and enforceability of our intellectual property rights and if such defenses, counterclaims, or countersuits are successful, we could lose valuable intellectual property rights. An adverse determination of any litigation proceedings could put our intellectual property at risk of being invalidated or interpreted narrowly and could put our related patents, patent applications, and trademark filings at risk of being invalidated, not issuing, or being cancelled. Furthermore, because of the substantial amount of discovery required in connection with intellectual property litigation, there is a risk that some of our confidential or sensitive information could be compromised by disclosure in the event of litigation. In addition, during the course of litigation there could be public announcements of the results of hearings, motions, or other interim proceedings or developments. If securities analysts or investors perceive these results to be negative, it could have a substantial adverse effect on the price of our common stock. Our inability to protect our proprietary technology against unauthorized copying or use, as well as any costly litigation or diversion of our managements attention and resources, could delay further sales or the implementation of our products and platform capabilities, impair the functionality of our products and platform capabilities, delay introductions of new solutions, result in our substituting inferior or more costly technologies into our products, or injure our reputation. Any of the foregoing could adversely impact our business, financial condition, and results of operations.
44
Table of Contents
If we are unable to protect the confidentiality of our trade secrets, our business and competitive position would be harmed.
We rely heavily on trade secrets and confidentiality agreements to protect our unpatented know-how, technology, and other proprietary information, and to maintain our competitive position. However, trade secrets and know-how can be difficult to protect. We seek to protect these trade secrets and other proprietary technology, in part, by entering into non-disclosure and confidentiality agreements with parties who have access to them, such as our employees, consultants, and other third parties, including suppliers and other partners. However, we cannot guarantee that we have entered into such agreements with each party that has or may have had access to our proprietary information, know-how, and trade secrets. Moreover, no assurance can be given that these agreements will be effective in controlling access to, distribution, use, misuse, misappropriation, reverse engineering, or disclosure of our proprietary information, know-how, and trade secrets. Further, these agreements may not prevent our competitors from independently developing technologies that are substantially equivalent or superior to our products and platform capabilities. These agreements may be breached, and we may not have adequate remedies for any such breach. For example, past employees have sought to misappropriate source code relevant to certain of our products. While we have taken steps to enjoin misappropriation that we are aware of, such steps may not ultimately be successful and we may not be aware of all such misappropriation. Any of the foregoing could adversely impact our business, financial condition, and results of operations.
We may be subject to claims that our employees, consultants, or advisors have wrongfully used or disclosed alleged trade secrets of their current or former employers or claims asserting ownership of what we regard as our own intellectual property.
Many of our employees and consultants are currently or were previously employed at other companies in our field, including our competitors or potential competitors. Although we try to ensure that our employees and consultants do not use the proprietary information or know-how of others in their work for us, we may be subject to claims that we or these individuals have used or disclosed intellectual property, including trade secrets or other proprietary information, of any such individuals current or former employer. Litigation may be necessary to defend against these claims. If we fail in defending any such claims, in addition to paying monetary damages, we may lose valuable intellectual property rights or personnel. Even if we are successful in defending against such claims, litigation could result in substantial costs and be a distraction to management.
In addition, while it is our policy to require our employees and contractors who may be involved in the conception or development of intellectual property to execute agreements assigning such intellectual property to us, we may be unsuccessful in executing such an agreement with each party who, in fact, conceives or develops intellectual property that we regard as our own. The assignment of intellectual property rights may not be self-executing, or the assignment agreements may be breached, and we may be forced to bring claims against third parties, or defend claims that they may bring against us, to determine the ownership of what we regard as our intellectual property. Any of the foregoing could adversely impact our business, financial condition, and results of operations.
We use open source software in our products, which could negatively affect our ability to sell our services or subject us to litigation or other actions.
We use open source software in our products and we expect to continue to incorporate open source software in our services in the future. Few of the licenses applicable to open source software have been interpreted by courts, and there is a risk that these licenses could be construed in a manner that could impose unanticipated conditions or restrictions on our ability to commercialize our products. Moreover, we cannot ensure that we have not incorporated additional open source software in our products in a manner that is inconsistent with the terms of the applicable license or our current policies and procedures. If we fail to comply with these licenses, we may be subject to certain requirements, including requirements that we offer our products that incorporate the open source software for no cost, that we make available source code for modifications or derivative works we create
45
Table of Contents
based upon, incorporating, or using the open source software and that we license such modifications or derivative works under the terms of applicable open source licenses. In addition, although we employ open source software license screening measures, if we were to combine our proprietary software products with open source software in a certain manner we could, under certain open source licenses, be required to release the source code of our proprietary software products. If an author or other third party that distributes such open source software were to allege that we had not complied with the conditions of one or more of these licenses, we could be required to incur significant legal expenses defending against such allegations and could be subject to significant damages, enjoined from the sale of our products that contained the open source software and required to comply with onerous conditions or restrictions on these products, which could disrupt the distribution and sale of these products.
From time to time, there have been claims challenging the ownership rights in open source software against companies that incorporate it into their products and the licensors of such open source software provide no warranties or indemnities with respect to such claims. As a result, we and our customers could be subject to lawsuits by parties claiming ownership of what we believe to be open source software. Litigation could be costly for us to defend, have a negative effect on our business, financial condition, and results of operations, or require us to devote additional research and development resources to change our products. Some open source projects have known vulnerabilities and architectural instabilities and are provided on an as-is basis, which, if not properly addressed, could negatively affect the performance of our product. If we inappropriately use or incorporate open source software subject to certain types of open source licenses that challenge the proprietary nature of our products, we may be required to re-engineer such products, discontinue the sale of such products, or take other remedial actions, any of which could adversely impact our business, financial condition, and results of operations.
If we cannot license rights to use technologies on reasonable terms, we may be unable to license rights that are critical to our business.
In the future we may identify additional third-party intellectual property that we may need to license in order to engage in our business, including to develop or commercialize new products or services. However, such licenses may not be available on acceptable terms or at all. The licensing or acquisition of third-party intellectual property rights is a competitive area, and several more established companies may pursue strategies to license or acquire third-party intellectual property rights that we may consider attractive or necessary. These established companies may have a competitive advantage over us due to their size, capital resources, and greater development or commercialization capabilities. In addition, companies that perceive us to be a competitor may be unwilling to assign or license rights to us. Even if such licenses are available, we may be required to pay the licensor substantial royalties based on sales of our products and services. Such royalties are a component of the cost of our products or services and may affect the margins on our products and services. If we are unable to enter into the necessary licenses on acceptable terms or at all, it could adversely impact our business, financial condition, and results of operations.
Risks Related to our International Operations
Our current operations are international in scope, and we plan further geographic expansion, creating a variety of operational challenges.
We currently operate internationally, and a component of our growth strategy involves the further expansion of our operations and customer base internationally. Customers outside the United States generated 66% and 61% of our revenue as of January 31, 2020 and 2021, respectively. Beyond the United States, we have operational presence internationally, including, among others, in Australia, Austria, Belgium, Brazil, Canada, China, Denmark, France, Germany, India, Israel, Italy, Japan, Mexico, the Netherlands, Romania, Russia, Singapore, South Korea, Sweden, Turkey, the United Arab Emirates, and the United Kingdom. We are continuing to adapt to and develop strategies to further address international markets, but there is no guarantee
46
Table of Contents
that such efforts will have the desired effect. For example, we anticipate that we will need to establish relationships with new partners in order to expand into certain countries, and if we fail to identify, establish, and maintain such relationships, we may be unable to execute on our expansion plans. As of January 31, 2021, approximately 72% of our full-time employees were located outside of the United States. We expect that our international activities will continue to grow for the foreseeable future as we continue to pursue opportunities in existing and new international markets, which will require significant dedication of management attention and financial resources.
Our current and future international business and operations involve a variety of risks, including:
| | slower than anticipated availability and adoption of our platform and products by international businesses; |
| | changes in a specific countrys or regions political, regulatory, or economic conditions; |
| | the need to adapt and localize our products for specific countries; |
| | greater difficulty collecting accounts receivable and longer payment cycles; |
| | potential changes in trade relations, regulations, or laws; |
| | unexpected changes in laws, regulatory requirements, or tax laws; |
| | more stringent regulations relating to privacy and data security and the unauthorized use of, or access to, commercial and personal information, particularly in Europe; |
| | differing and potentially more onerous labor regulations, especially in Europe, where labor laws are generally more advantageous to employees as compared to the United States, including deemed hourly wage and overtime regulations in these locations; |
| | challenges inherent in efficiently managing, and the increased costs associated with, an increased number of employees over large geographic distances, including the need to implement appropriate systems, policies, benefits, and compliance programs that are specific to each jurisdiction; |
| | potential changes in laws, regulations, and costs affecting our U.K. operations and local employees due to Brexit; |
| | difficulties in managing a business in new markets with diverse cultures, languages, customs, legal systems, alternative dispute systems, and regulatory systems; |
| | increased travel, real estate, infrastructure, and legal compliance costs associated with international operations; |
| | currency exchange rate fluctuations and the resulting effect on our revenue and expenses and the cost and risk of entering into hedging transactions if we chose to do so in the future; |
| | limitations on our ability to reinvest earnings from operations in one country to fund the capital needs of our operations in other countries; |
| | laws and business practices favoring local competitors or general market preferences for local vendors; |
| | limited or insufficient intellectual property protection or difficulties obtaining, maintaining, protecting, or enforcing our intellectual property rights, including our trademarks and patents; |
47
Table of Contents
| | political instability or terrorist activities; |
| | an outbreak of a contagious disease, which may cause us or our third-party providers and/or customers to temporarily suspend our or their respective operations in the affected city or country; |
| | exposure to liabilities under anti-corruption and anti-money laundering laws, including the FCPA, U.S. bribery laws, the United Kingdom Bribery Act, and similar laws and regulations in other jurisdictions; |
| | exposure to anti-competition laws in foreign jurisdictions that may conflict with or be more restrictive than similar U.S. anti-competition laws; and |
| | adverse changes to domestic and foreign tax law and the burdens of foreign exchange controls that could make it difficult to repatriate earnings and cash. |
If we invest substantial time and resources to further expand our international operations and are unable to do so successfully and in a timely manner, our business and results of operations will suffer.
Risks Related to Tax and Accounting Matters
We and our independent registered public accounting firm identified a material weakness in our internal control over financial reporting in the past, and any failure to maintain effective internal control over financial reporting could harm us.
Our management is responsible for establishing and maintaining adequate internal control over financial reporting. Internal control over financial reporting is a process designed to provide reasonable assurance regarding the reliability of financial reporting and the preparation of financial statements in accordance with U.S. generally accepted accounting principles, or GAAP. Under standards established by the United States Public Company Accounting Oversight Board, a material weakness is a deficiency, or combination of deficiencies, in internal control over financial reporting such that there is a reasonable possibility that a material misstatement of annual or interim financial statements will not be prevented or detected and corrected on a timely basis.
Prior to changing the end of our fiscal year from December 31 to January 31, we and our independent registered public accounting firm identified a material weakness in our internal controls over financial reporting related to revenue recognition for the fiscal year ended December 31, 2018, which resulted in the improper allocation of stand-alone selling price and certain errors in deferred revenue and contract assets. The material weakness was caused by, among other things, a lack of oversight and technical competence and experience within our finance department to identify such errors. We have completed the following steps to address this material weakness:
| | engaged third-party service providers to assist in technical accounting matters; |
| | increased oversight and reviews of technical accounting assessments performed by outside consultants; |
| | designed and implemented internal controls related to revenue recognition accounting; and |
| | hired experienced professionals to key revenue recognition accounting positions. |
We believe that this material weakness has been remediated through the steps we have taken as noted above, and we did not incur any material costs related to this remediation. However, neither we nor our independent registered public accounting firm have tested the effectiveness of our internal control over financial reporting and we cannot assure you that we will not suffer from this or other material weaknesses in the future.
48
Table of Contents
Upon completion of this offering, we will be required to document and test our internal controls over financial reporting pursuant to Section 404, or Section 404, of Sarbanes-Oxley Act of 2002, or the Sarbanes-Oxley Act, so that our management can certify as to the effectiveness of our internal controls over financial reporting. Likewise, our independent registered public accounting firm will be required to provide an attestation report on the effectiveness of our internal control over financial reporting at such time as we cease to be an emerging growth company, as defined in the Jumpstart our Business Startups Act of 2012, or the JOBS Act. At such time, our independent registered public accounting firm may issue a report that is adverse if a material weakness is identified.
We have recently commenced the costly and challenging process of compiling the system and processing documentation necessary to perform the evaluation needed to comply with Section 404, but we may not be able to complete our evaluation, testing and any required remediation in a timely fashion once initiated. Our compliance with Section 404 will require that we incur substantial expenses and expend significant management efforts. We will need to hire additional accounting and financial staff with appropriate public company experience and technical accounting knowledge and compile the system and process documentation necessary to perform the evaluation needed to comply with Section 404.
If our management is unable to conclude that we have effective internal controls over financial reporting, or to certify the effectiveness of such controls, or if our independent registered public accounting firm cannot render an unqualified opinion on managements assessment and the effectiveness of our internal control over financial reporting, or if material weaknesses in our internal controls are identified in the future, we could be subject to regulatory scrutiny and a loss of public confidence, which could have a material adverse effect on our business and our stock price. In addition, if we do not maintain adequate financial and management personnel, processes and controls, we may not be able to manage our business effectively or accurately report our financial performance on a timely basis, which could cause a decline in our common stock price and adversely affect our business, financial condition, and results of operations.
We are exposed to fluctuations in currency exchange rates, which could negatively affect our results of operations.
While our sales contracts are denominated predominantly in U.S. dollars, we also have sales contracts representing a large portion of our revenue denominated in foreign currencies. Therefore, a portion of our revenue is subject to fluctuations due to changes in foreign currency exchange rates. Additionally, for our foreign sales contracts denominated in U.S. dollars, a strengthening of the U.S. dollar could increase the real cost of our products and platform capabilities to these customers outside of the United States, which could adversely affect our results of operations.
Further, an increasing portion of our operating expenses are incurred outside the United States. We conduct our business and incur costs in the local currency of most countries in which we operate. We incur currency transaction risk whenever one of our operating subsidiaries enters into either a purchase or a sales transaction using a different currency from the currency in which it operates, or holds assets or liabilities in a currency different from its functional currency. Changes in exchange rates can also affect our results of operations when the value of sales and expenses of foreign subsidiaries are translated to U.S. dollars. We cannot accurately predict the impact of future exchange rate fluctuations on our results of operations. If we are not able to successfully hedge against the risks associated with currency fluctuations, our results of operations could be adversely affected. Further, given the volatility of exchange rates, we may not be able to effectively manage our currency risks, and any volatility in currency exchange rates may increase the price of our products in local currency to our foreign customers or increase the manufacturing cost of our products, either of which may have an adverse effect on our financial condition, cash flows, and profitability.
49
Table of Contents
Our corporate structure and intercompany arrangements cause us to be subject to the tax laws of various jurisdictions, and we could be obligated to pay additional taxes, which could materially adversely affect our business, financial condition, results of operations, and prospects.
We have been rapidly expanding our international operations and personnel to support our business in numerous international markets. We generally conduct our international operations through directly or indirectly wholly-owned subsidiaries, and we are or may be required to report our taxable income in various jurisdictions worldwide with increasingly complex tax laws based upon our business operations in those jurisdictions. Our intercompany relationships and agreements are subject to complex transfer pricing regulations administered by tax authorities in various jurisdictions with potentially divergent tax laws. Tax authorities may disagree with tax positions that we have taken. For example, the U.S Internal Revenue Service, or the IRS, or another tax authority could challenge our allocation of income by tax jurisdiction and the amounts paid between our affiliated companies pursuant to our intercompany arrangements and transfer pricing policies, including amounts paid with respect to our intellectual property in connection with our intercompany research and development cost sharing arrangement and legal structure.
The amount of taxes we pay in different jurisdictions may depend on the application of the tax laws of the various jurisdictions, including the United States, to our international business activities, changes in tax rates, new or revised tax laws or interpretations of existing tax laws and policies, and our ability to operate our business in a manner consistent with our corporate structure and intercompany arrangements. The authorities in these jurisdictions could review our tax returns or require us to file tax returns in jurisdictions in which we are not currently filing and could impose additional tax, interest, and penalties. In addition, the authorities could claim that various withholding requirements apply to us or our subsidiaries, assert that benefits of tax treaties are not available to us or our subsidiaries, or challenge our methodologies for valuing developed technology or intercompany arrangements, including our transfer pricing. If such a challenge or disagreement were to occur, and our position was not sustained, we could be required to pay additional taxes, interest, and penalties, which could result in one-time tax charges, higher effective tax rates, reduced cash flows, and lower overall profitability of our operations. Our financial statements could fail to reflect adequate reserves to cover such a contingency. Furthermore, we are subject to periodic audits in the various jurisdictions in which we operate, which if determined aversely could have an adverse impact on our financial conditions.
Changes in tax laws or tax rulings could materially affect our financial position, results of operations, and cash flows.
The tax regimes we are subject to or operate under, including income and non-income taxes, may be subject to significant change. Changes in tax laws, regulations, or rulings, or changes in interpretations of existing laws and regulations, could materially affect our financial position and results of operations. For example, the 2017 Tax Cuts and Jobs Act, or the Tax Act, made broad and complex changes to the U.S. tax code, including changes to U.S. federal tax rates, additional limitations on the deductibility of interest, both positive and negative changes to the utilization of future net operating loss, or NOL, carryforwards, allowing for the expensing of certain capital expenditures and putting into effect the migration from a worldwide system of taxation to a territorial system. The Tax Act and issuance of additional regulatory or accounting guidance related to the Tax Act could materially affect our tax obligations, deferred tax assets, and effective tax rate in the period issued and in the future. In addition, many countries in Europe, as well as a number of other countries and organizations, have recently proposed or recommended changes to existing tax laws or have enacted new laws that could significantly increase our tax obligations in the countries where we do business or require us to change the manner in which we operate our business.
During the course of his campaign and after his election, President Biden proposed to increase the tax rate for corporations and high-income individuals, double the tax rate on global intangible low-taxed income, and impose a new 15% minimum tax on global book income and other tax measures. If such proposals are passed, they may have a material impact on our financial statements.
50
Table of Contents
The Organization for Economic Cooperation and Development, or OECD, has been working on a Base Erosion and Profit Shifting Project, and issued a report in 2015, an interim report in 2018, and is expected to continue to issue guidelines and proposals that may change various aspects of the existing framework under which our tax obligations are determined in many of the countries in which we do business. While this project is in an advanced stage, we cannot predict what its outcome will be or what potential impact it may have on our tax obligations and operations.
The European Commission and several countries have issued proposals that would change various aspects of the current tax framework under which we are taxed. These proposals include changes to the existing framework to calculate income tax, as well as proposals to change or impose new types of non-income taxes, including taxes based on a percentage of revenue. The Council of the European Union stated publicly that an EU digital levy may be designed as a measure separate from the OECD framework, which could represent a significant departure from the understanding to date regarding digital services taxes serving as a backstop to such framework. In addition, several countries have proposed or enacted taxes applicable to digital services, which could apply to our business.
Due to the large and expanding scale of our international business activities, these types of changes to the taxation of our activities could increase our worldwide effective tax rate, increase the amount of taxes imposed on our business, and harm our financial position. Such changes may also apply retroactively to our historical operations and result in taxes greater than the amounts estimated and recorded in our financial statements.
Changes in our effective tax rate or tax liability may have an adverse effect on our results of operations.
We are subject to income taxes in the United States and various foreign jurisdictions. The determination of our worldwide provision for income taxes and other tax liabilities requires significant judgment by management, and there are many transactions where the ultimate tax determination is uncertain. We believe that our provision for income taxes is reasonable, but the ultimate tax outcome may differ from the amounts recorded in our consolidated financial statements and may materially affect our financial results in the period or periods in which such outcome is determined.
Our effective tax rate could increase due to several factors, including:
| | changes in the relative amounts of income before taxes in the various jurisdictions in which we operate that have differing statutory tax rates; |
| | changes in tax laws, tax treaties, and regulations or the interpretation of them, including the Tax Act and the Coronavirus Aid, Relief, and Economic Security Act, or CARES Act; |
| | changes to our assessment about our ability to realize our deferred tax assets that are based on estimates of our future results, the prudence and feasibility of possible tax planning strategies, and the economic and political environments in which we do business; |
| | the outcome of current and future tax audits, examinations, or administrative appeals; |
| | changes international tax frameworks; and |
| | the effects of acquisitions. |
Any of these developments could adversely affect our results of operations.
51
Table of Contents
We could be required to collect additional sales or indirect taxes or be subject to other tax liabilities that may increase the costs our customers would have to pay for our products and adversely affect our results of operations.
We currently collect and remit applicable sales and indirect taxes and other applicable transfer taxes in jurisdictions where we, through our employees or economic activity, have a presence and where we have determined, based on applicable legal precedents, that sales or licensing of our products are classified as taxable. We do not currently collect and remit state and local excise, utility user and ad valorem taxes, fees, or surcharges in jurisdictions where we believe we do not have sufficient nexus. There is uncertainty as to what constitutes sufficient nexus for a state or local jurisdiction to levy taxes, fees and surcharges for sales made over the internet, and there is also uncertainty as to whether our characterization of our products as not taxable in certain jurisdictions will be accepted by state and local tax authorities.
An increasing number of states have considered or adopted laws that attempt to impose tax collection obligations on out-of-state companies. Additionally, the Supreme Court of the United States recently ruled in South Dakota v. Wayfair, Inc. et al, or Wayfair, that online sellers can be required to collect sales and use tax despite not having a physical presence in the buyers state. In response to Wayfair, or otherwise, states or local governments may adopt, or begin to enforce, laws requiring us to calculate, collect, and remit taxes on sales in their jurisdictions. A successful assertion by one or more states requiring us to collect taxes where we presently do not do so, or to collect more taxes in a jurisdiction in which we currently do collect some taxes, could result in substantial tax liabilities, including taxes on past sales, as well as penalties and interest. The imposition by state governments or local governments of sales tax collection obligations on out-of-state sellers could also create additional administrative burdens for us, put us at a competitive disadvantage if they do not impose similar obligations on our competitors, and decrease our future sales, which could have a material adverse effect on our business and results of operations.
Our ability to use our NOLs to offset future taxable income may be subject to certain limitations.
Our NOLs could expire unused and be unavailable to offset future income tax liabilities because of their limited duration or because of restrictions under U.S. or foreign tax law. NOLs generated in taxable years beginning before January 1, 2018 are permitted to be carried forward for only 20 taxable years under applicable U.S. federal income tax law. Under the Tax Act, as modified by the CARES Act, NOLs arising in taxable years beginning after December 31, 2017, and before January 1, 2021 may be carried back to each of the five tax years preceding the tax year of such loss, and NOLs arising in tax years beginning after December 31, 2020 may not be carried back. Moreover, under the Tax Act as modified by the CARES Act, NOLs generated in taxable years beginning after December 31, 2017 may be carried forward indefinitely, but the deductibility of such NOLs generally will be limited in taxable years beginning after December 31, 2020 to 80% of current year taxable income. The extent to which state income tax law will conform to the Tax Act and CARES Act is uncertain.
In general, under Section 382 of the Internal Revenue Code of 1986, as amended, or the Code, a corporation that undergoes an ownership change (as defined under Section 382 of the Code and applicable Treasury Regulations) is subject to limitations on its ability to utilize its pre-change NOLs to offset future taxable income. We have identified Section 382 ownership changes in April 2017 and July 2020 and, accordingly, our NOLs are subject to limitation. We do not believe, based on our preliminary analysis, that we experienced a subsequent ownership change in connection with the Series F Financing. We do not believe that any Section 382 limitations will prevent us from fully utilizing our NOLs. It is possible that we have in the past undergone and may in the future undergo, additional ownership changes that we have not identified and that could result in additional limitations on our NOLs. Furthermore, our ability to utilize NOLs of companies that we have acquired or may acquire in the future may be subject to limitations. There is also a risk that due to regulatory changes, such as suspensions on the use of NOLs or other unforeseen reasons, our existing NOLs could expire or otherwise be unavailable to reduce future income tax liabilities, including for state tax purposes. For these reasons, we may not be able to utilize a material portion of the NOLs reflected on our balance sheets, even if we attain profitability,
52
Table of Contents
which could potentially result in increased future tax liability to us and could adversely affect our operating results and financial condition.
Our reported financial results may be adversely affected by changes in GAAP.
GAAP is subject to interpretation by the Financial Accounting Standards Board, U.S. Securities and Exchange Commission, or the SEC, and various bodies formed to promulgate and interpret appropriate accounting principles. A change in these principles or interpretations could have a significant effect on our reported results of operations and could affect the reporting of transactions already completed before the announcement of a change.
If our estimates or judgments relating to our critical accounting policies prove to be incorrect, our results of operations could be adversely affected.
The preparation of financial statements in conformity with GAAP requires management to make estimates and assumptions that affect the amounts reported in our consolidated financial statements. We base our estimates on historical experience and on various other assumptions that we believe to be reasonable under the circumstances. The results of these estimates form the basis for making judgments about the carrying values of assets, liabilities, and equity, and the amount of revenue and expenses that are not readily apparent from other sources. Significant estimates and judgments involve revenue recognition and the valuation of our stock-based compensation awards, including the determination of fair value of our common stock, among others. Our results of operations may be adversely affected if our assumptions change or if actual circumstances differ from those in our assumptions, which could cause our results of operations to fall below the expectations of securities analysts and investors, resulting in a decline in the market price of our Class A common stock.
Our revenue recognition policy and other factors may distort our financial results in any given period and make them difficult to predict.
We derive our revenue from the sale of our software licenses for use of our proprietary software, maintenance and support for our licenses, right to access certain products that are hosted by us (i.e., software as a service, or SaaS), and professional services. Under Accounting Standards Update No. 2014-09 (Topic 606), Revenue from Contracts with Customers, we recognize revenue when a customer obtains control of promised goods or services are delivered. The amount of revenue recognized reflects the consideration that we expect to receive in exchange for these goods or services. Our licenses revenue is mainly derived from the sale of term-based licenses hosted on-premises, which is recognized when we transfer control of the respective license to the customer. Revenue from SaaS and revenue from maintenance and support are recognized ratably over time since control passes to our customers over the arrangements contractual period.
Furthermore, the presentation of our financial results requires us to make estimates and assumptions that may affect revenue recognition. In some instances, we could reasonably use different estimates and assumptions, and changes in estimates are likely to occur from period to period.
Given the foregoing factors, our actual results could differ significantly from our estimates. Comparing our revenue and operating results on a period-to-period basis may not be meaningful, and our past results may not be indicative of our future performance.
Risks Related to Ownership of Our Class A Common Stock
The dual class structure of our common stock will have the effect of concentrating voting control with our Chief Executive Officer, Co-Founder, and Chairman, which will limit your ability to influence the outcome of important decisions.
Our Class B common stock has 35 votes per share and our Class A common stock, which is the stock we are offering hereby, has one vote per share. Our Chief Executive Officer, Co-Founder, and Chairman, Daniel Dines,
53
Table of Contents
who, collectively with his controlled entities, holds all our outstanding shares of Class B common stock, will beneficially own shares representing approximately 88.1% of the voting power of our outstanding capital stock following the completion of this offering. As a result, Mr. Dines will have the ability to control the outcome of matters requiring stockholder approval, including the election of directors and approval of significant corporate transactions, such as a merger or other sale of our company or our assets, even if his stock ownership represents less than 50% of the outstanding aggregate number of shares of our capital stock. This concentration of ownership will limit the ability of other stockholders to influence corporate matters and may cause us to make strategic decisions that could involve risks to you or that may not be aligned with your interests. As a board member, Mr. Dines owes a fiduciary duty to our stockholders and is legally obligated to act in good faith and in a manner he reasonably believes to be in the best interests of our stockholders. As a stockholder, Mr. Dines is entitled to vote his shares in his own interests, which may not always be in the interests of our stockholders generally. Mr. Dines control may adversely affect the market price of our Class A common stock.
Further, future transfers by holders of our Class B common stock will generally result in those shares converting into shares of our Class A common stock, subject to limited exceptions, such as certain transfers effected for tax or estate planning purposes.
We have not elected to take advantage of the controlled company exemption to the corporate governance rules for publicly-listed companies but may do so in the future.
Because our Chief Executive Officer, Co-Founder, and Chairman, Daniel Dines, who, collectively with his controlled entities, holds all our outstanding shares of Class B common stock, will beneficially own shares representing in excess of 50% of the voting power of our outstanding capital stock following the completion of this offering, we are eligible to elect the controlled company exemption to the corporate governance rules for publicly-listed companies. We have not elected to do so. If we decide to become a controlled company under the corporate governance rules for publicly-listed companies, we would not be required to have a majority of our board of directors be independent, nor would we be required to have a compensation committee or an independent nominating function. If we choose controlled company status in the future, our status as a controlled company could cause our Class A common stock to be less attractive to certain investors or otherwise harm our trading price.
We cannot predict the impact our dual class structure may have on the market price of our Class A common stock.
We cannot predict whether our dual class structure, combined with the concentrated control of our Chief Executive Officer, Co-Founder, and Chairman, who holds all of the outstanding shares of our Class B common stock, will result in a lower or more volatile market price of our Class A common stock or in adverse publicity or other adverse consequences. Certain index providers have announced restrictions on including companies with multiple-class share structures in certain of their indexes. For example, in July 2017, FTSE Russell and Standard & Poors announced that they would cease to allow most newly public companies utilizing dual or multi-class capital structures to be included in their indices. Under the announced policies, our dual class capital structure would make us ineligible for inclusion in any of these indices. Given the sustained flow of investment funds into passive strategies that seek to track certain indexes, exclusion from stock indexes would likely preclude investment by many of these funds and could make our Class A common stock less attractive to other investors. As a result, the market price of our Class A common stock could be adversely affected.
No public market for our Class A common stock currently exists, and an active public trading market may not develop or be sustained following this offering.
No public market for our Class A common stock currently exists. An active public trading market for our Class A common stock may not develop following the completion of this offering or, if developed, it may not be sustained. The lack of an active market may impair your ability to sell your shares at the time you wish to sell
54
Table of Contents
them or at a price that you consider reasonable. The lack of an active market may also reduce the fair value of your shares. An inactive market may also impair our ability to raise capital to continue to fund operations by selling shares and may impair our ability to acquire other companies or technologies by using our shares as consideration.
We will have broad discretion in the use of the net proceeds to us from this offering and may not use them effectively.
We will have broad discretion in the application of the net proceeds to us from this offering, including for any of the purposes described in the section titled Use of Proceeds, and you will not have the opportunity as part of your investment decision to assess whether the net proceeds are being used appropriately. Because of the number and variability of factors that will determine our use of the net proceeds from this offering, our ultimate use may vary substantially from our currently intended use. Investors will need to rely upon the judgment of our management with respect to the use of proceeds. Pending use, we may invest the net proceeds from this offering in short-term, investment-grade, interest-bearing securities, such as money market accounts, certificates of deposit, commercial paper, and guaranteed obligations of the U.S. government that may not generate a high yield for our stockholders. We may use a portion of the net proceeds to acquire complementary businesses, products, services, or technologies. At this time, we do not have agreements or commitments to enter into any material acquisitions. If we do not use the net proceeds that we receive in this offering effectively, our business, financial condition, results of operations, and prospects could be harmed and the market price of our Class A common stock could decline.
Future sales of our Class A common stock in the public market could cause the market price of our Class A common stock to decline.
Sales of a substantial number of shares of our Class A common stock in the public market following the completion of this offering, or the perception that these sales might occur, could depress the market price of our Class A common stock and could impair our ability to raise capital through the sale of additional equity securities. Many of our existing equity holders have substantial unrecognized gains on the value of the equity they hold based upon the price of this offering, and therefore they may take steps to sell their shares or otherwise secure the unrecognized gains on those shares. We are unable to predict the timing of or the effect that such sales may have on the prevailing market price of our Class A common stock.
All of the Class A common stock sold in this offering will be freely tradable without restrictions or further registration under the Securities Act of 1933, as amended, or the Securities Act, except for any shares held by our affiliates as defined in Rule 144 under the Securities Act, or Rule 144.
All of our directors and executive officers, the selling stockholders, and the holders of substantially all of our Class A common stock, Class B common stock and securities exercisable for, or convertible into, our Class A common stock outstanding immediately on the closing of this offering, are subject to lock-up agreements with the underwriters or agreements with market stand-off provisions with us pursuant to which they have agreed that they will not, and will not publicly disclose an intention to, during the period ending immediately prior to the opening of trading on the NYSE on the second full trading day following the release of our regular earnings announcement for our second fiscal quarter following the completion of this offering (such period, the restricted period), offer, pledge, sell, contract to sell, sell any option or contract to purchase, purchase any option or contract to sell, grant any option, right or warrant to purchase, lend, or otherwise transfer or dispose of, directly or indirectly, any of our shares of common stock, any options or warrants to purchase any of our shares of common stock or any securities convertible into or exchangeable for or that represent the right to receive shares of our common stock or enter into any swap or other arrangement that transfers to another, in whole or in part, any of the economic consequences of ownership of our common stock; provided that Morgan Stanley & Co. LLC and J.P. Morgan Securities LLC on behalf of the underwriters may release any of the securities subject to these lock-up agreements at any time, subject to the applicable notice requirements.
55
Table of Contents
In addition, the restricted period may be shortened with respect to a portion of the locked-up securities held by certain lock-up parties, and the lock-up agreements are subject to a number of exceptions. These agreements are further described in the sections titled Shares Eligible for Future Sale and Underwriting. If not earlier released, all of the shares of Class A common stock not sold in this offering will become eligible for sale upon expiration of the restricted period, except for any shares held by our affiliates as defined in Rule 144.
In addition, there were 57,765,481 shares of Class A common stock issuable upon the exercise of options and upon the vesting and settlement of restricted stock units outstanding as of January 31, 2021. We intend to register all of the shares of Class A common stock issuable upon exercise of outstanding options, the vesting and settlement of outstanding restricted stock units, and other equity incentives we may grant in the future, for public resale under the Securities Act. The shares of Class A common stock will become eligible for sale in the public market to the extent such options are exercised or restricted stock unites vested and settled, subject to the lock-up agreements described above and compliance with applicable securities laws.
Further, based on shares outstanding as of January 31, 2021, holders of approximately 293,297,557 shares of Class A common stock, or 56.5% of our capital stock after the completion of this offering, will have rights, subject to some conditions, to require us to file registration statements covering the sale of their shares or to include their shares in registration statements that we may file for ourselves or other stockholders.
Sales, short sales, or hedging transactions involving our equity securities, whether before or after this offering and whether or not we believe them to be prohibited, could adversely affect the price of our Class A common stock.
You will experience immediate and substantial dilution in the net tangible book value of the shares of Class A common stock you purchase in this offering.
The initial public offering price of our Class A common stock will be substantially higher than the pro forma net tangible book value per share of our common stock immediately after this offering. If you purchase shares of our Class A common stock in this offering, you will suffer immediate dilution of $50.02 per share, or $49.70 per share if the underwriters exercise their over-allotment option in full, representing the difference between our pro forma as adjusted net tangible book value per share as of January 31, 2021 after giving effect to the sale of Class A common stock in this offering and the assumed public offering price of $53.00 per share, the midpoint of the price range set forth on the cover page of this prospectus. See the section titled Dilution.
We do not intend to pay dividends for the foreseeable future and, as a result, your ability to achieve a return on your investment will depend on appreciation in the price of our Class A common stock.
We have never declared or paid any cash dividends on our capital stock, and we do not intend to pay any cash dividends in the foreseeable future. Any determination to pay dividends in the future will be at the discretion of our board of directors. Accordingly, you may need to rely on sales of our Class A common stock after price appreciation, which may never occur, as the only way to realize any future gains on your investment.
We are an emerging growth company, and we cannot be certain if the reduced reporting and disclosure requirements applicable to emerging growth companies will make our Class A common stock less attractive to investors.
We are an emerging growth company, as defined in the JOBS Act, and we may take advantage of certain exemptions from various reporting requirements that are applicable to other public companies that are not emerging growth companies, including the auditor attestation requirements of Section 404, reduced disclosure obligations regarding executive compensation in our periodic reports and proxy statements and exemptions from the requirements of holding a nonbinding advisory vote on executive compensation and stockholder approval of any golden parachute payments not previously approved. Pursuant to Section 107 of the JOBS Act, as an
56
Table of Contents
emerging growth company, we have elected to use the extended transition period for complying with new or revised accounting standards until those standards would otherwise apply to private companies. As a result, our consolidated financial statements may not be comparable to the financial statements of issuers who are required to comply with the effective dates for new or revised accounting standards that are applicable to public companies, which may make our Class A common stock less attractive to investors. In addition, if we cease to be an emerging growth company, we will no longer be able to use the extended transition period for complying with new or revised accounting standards.
We will remain an emerging growth company until the earliest of: (1) the last day of the fiscal year following the fifth anniversary of this offering; (2) the last day of the first fiscal year in which our annual gross revenue is $1.07 billion or more; (3) the date on which we have, during the previous rolling three-year period, issued more than $1.0 billion in non-convertible debt securities; and (4) the last day of the fiscal year in which the market value of our Class A common stock held by non-affiliates exceeded $700 million as of July 31 of such fiscal year.
We cannot predict if investors will find our Class A common stock less attractive if we choose to rely on these exemptions. For example, if we do not adopt a new or revised accounting standard, our future results of operations may not be as comparable to the results of operations of certain other companies in our industry that adopted such standards. If some investors find our Class A common stock less attractive as a result, there may be a less active trading market for our Class A common stock and our stock price may be more volatile.
Anti-takeover provisions in our charter documents and under Delaware law could make an acquisition of our company more difficult, limit attempts by our stockholders to replace or remove our current management and limit the market price of our Class A common stock.
In addition to the effects of our dual class structure, provisions in our amended and restated certificate of incorporation and amended and restated bylaws, as they will be in effect upon the completion of this offering, may have the effect of delaying or preventing a change in control or changes in our management. Our amended and restated certificate of incorporation and amended and restated bylaws will include provisions that may frustrate or prevent any attempts by our stockholders to replace or remove our current management by making it more difficult for stockholders to replace members of our board of directors, which is responsible for appointing the members of our management.
In addition, because we are incorporated in Delaware, we are governed by the provisions of Section 203 of the Delaware General Corporation Law, which generally, subject to certain exceptions, prohibits a Delaware corporation from engaging in any of a broad range of business combinations with any interested stockholder for a period of three years following the date on which the stockholder became an interested stockholder. Any of the foregoing provisions could limit the price that investors might be willing to pay in the future for shares of our Class A common stock, and they could deter potential acquirers of our company, thereby reducing the likelihood that you would receive a premium for your shares of our Class A common stock in an acquisition.
Our amended and restated certificate of incorporation will provide that the Court of Chancery of the State of Delaware and the federal district courts of the United States of America will be the exclusive forums for substantially all disputes between us and our stockholders, which could limit our stockholders ability to obtain a favorable judicial forum for disputes with us or our directors, officers, or employees.
Our amended and restated certificate of incorporation, as will be in effect upon the completion of this offering, will provide that the Court of Chancery of the State of Delaware is the exclusive forum for the following types of actions or proceedings under Delaware statutory or common law:
| | any derivative claim or cause of action brought on our behalf; |
| | any claim or cause of action asserting a breach of fiduciary duty; |
57
Table of Contents
| | any claim or cause of action against us arising under the Delaware General Corporation Law; |
| | any claim or cause of action arising under or seeking to interpret our amended and restated certificate of incorporation or our amended and restated bylaws; and |
| | any claim or cause of action against us that is governed by the internal affairs doctrine. |
The provisions would not apply to suits brought to enforce a duty or liability created by the Securities Exchange Act of 1934, or the Exchange Act. Furthermore, Section 22 of the Securities Act creates concurrent jurisdiction for federal and state courts over all such Securities Act actions. Accordingly, both state and federal courts have jurisdiction to entertain such claims. To prevent having to litigate claims in multiple jurisdictions and the threat of inconsistent or contrary rulings by different courts, among other considerations, our amended and restated certificate of incorporation will further provide that the federal district courts of the United States of America will be the exclusive forum for resolving any complaint asserting a cause or causes of action arising under the Securities Act, including all causes of action asserted against any defendant to such complaint. For the avoidance of doubt, this provision is intended to benefit and may be enforced by us, our officers and directors, the underwriters to any offering giving rise to such complaint, and any other professional entity whose profession gives authority to a statement made by that person or entity and who has prepared or certified any part of the documents underlying the offering.
While the Delaware courts have determined that such choice of forum provisions are facially valid, a stockholder may nevertheless seek to bring a claim in a venue other than those designated in the exclusive forum provisions. In such instance, we would expect to vigorously assert the validity and enforceability of the exclusive forum provisions of our amended and restated certificate of incorporation. This may require significant additional costs associated with resolving such action in other jurisdictions and there can be no assurance that the provisions will be enforced by a court in those other jurisdictions.
These exclusive forum provisions may limit a stockholders ability to bring a claim in a judicial forum that it finds favorable for disputes with us or our directors, officers, or other employees, which may discourage lawsuits against us and our directors, officers, and other employees. If a court were to find either exclusive-forum provision in our amended and restated certificate of incorporation to be inapplicable or unenforceable in an action, we may incur further significant additional costs associated with resolving the dispute in other jurisdictions, all of which could seriously harm our business.
General Risk Factors
Our stock price may be volatile, and the value of our Class A common stock may decline.
The market price of our Class A common stock may be highly volatile and may fluctuate or decline substantially as a result of a variety of factors, some of which are beyond our control, including:
| | actual or anticipated fluctuations in our financial condition or results of operations; |
| | variance in our financial performance from expectations of securities analysts; |
| | changes in the pricing of licenses to our products; |
| | changes in our projected operating and financial results; |
| | changes in laws or regulations applicable to our platform and products; |
| | announcements by us or our competitors of significant business developments, acquisitions, or new products; |
58
Table of Contents
| | significant data breaches, disruptions to or other incidents involving our software; |
| | our involvement in litigation or governmental investigations; |
| | future sales of our Class A common stock by us or our stockholders, as well as the anticipation of lock-up releases; |
| | changes in senior management or key personnel; |
| | the issuance of new or changed securities analysts reports or recommendations; |
| | the trading volume of our Class A common stock; |
| | changes in the anticipated future size and growth rate of our market; and |
| | economic and market conditions in general, or in our industry in particular. |
Broad market and industry fluctuations, as well as general economic, political, regulatory, and market conditions, may also negatively impact the market price of our Class A common stock. In addition, technology stocks have historically experienced high levels of volatility. In the past, companies that have experienced volatility in the market price of their securities have been subject to securities class action litigation. We may be the target of this type of litigation in the future, which could result in substantial expenses and divert our managements attention.
Our issuance of additional capital stock in connection with financings, acquisitions, investments, our equity incentive plans, or otherwise will dilute all other stockholders.
We expect to issue additional capital stock in the future that will result in dilution to all other stockholders. We expect to grant equity awards to employees, directors, and consultants under our equity incentive plans. We may also raise capital through equity financings in the future. As part of our business strategy, we may acquire or make investments in companies, products, or technologies and issue equity securities to pay for any such acquisition or investment. Any such issuances of additional capital stock may cause stockholders to experience significant dilution of their ownership interests and the per share value of our Class A common stock to decline.
If securities or industry analysts do not publish research or publish unfavorable or inaccurate research about our business, the market price and trading volume of our Class A common stock could decline.
The market price and trading volume of our Class A common stock following the completion of this offering will be heavily influenced by the way analysts interpret our financial information and other disclosures. We do not have control over these analysts. If few securities analysts commence coverage of us, or if industry analysts cease coverage of us, our stock price would be negatively affected. If securities or industry analysts do not publish research or reports about our business, downgrade our Class A common stock, or publish negative reports about our business, our stock price would likely decline. If one or more of these analysts cease coverage of us or fail to publish reports on us regularly, demand for our Class A common stock could decrease, which might cause our stock price to decline and could decrease the trading volume of our Class A common stock.
We will incur increased costs as a result of operating as a public company, and our management will be required to devote substantial time to compliance with our public company responsibilities and corporate governance practices.
As a public company, we will incur significant legal, accounting and other expenses that we did not incur as a private company, which we expect to further increase after we are no longer an emerging growth company.
59
Table of Contents
The Sarbanes-Oxley Act, the Dodd-Frank Wall Street Reform and Consumer Protection Act, the listing requirements of the New York Stock Exchange and other applicable securities rules and regulations impose various requirements on public companies. Our management and other personnel devote a substantial amount of time to compliance with these requirements. Moreover, these rules and regulations will increase our legal and financial compliance costs and will make some activities more time-consuming and costly. We cannot predict or estimate the amount of additional costs we will incur as a public company or the specific timing of such costs.
Pursuant to the terms of our outstanding indebtedness, we may be limited in our ability to incur future debt.
In October 2020, we entered into a Senior Secured Credit Facility, or the Credit Facility, with HSBC Ventures USA Inc., Silicon Valley Bank, Sumitomo Mitsui Banking Corporation, and Mizuho Bank, LTD, which provided a $200.0 million senior secured revolving credit facility with a maturity date of October 30, 2023. Our obligations under the Credit Facility are secured by substantially all of our assets, except for our intellectual property.
Pursuant to the terms of the Credit Facility, we are limited in our ability to incur additional indebtedness other than on the terms and conditions thereof. In addition, a failure to comply with the covenants under the Credit Facility could result in an event of default by us and an acceleration of amounts due. If an event of default occurs that is not waived by the lenders, and the lenders accelerate any amounts due, we may not be able to make accelerated payments, and the lender could seek to enforce their security interests in the collateral securing such indebtedness, which could have a material adverse effect on our business and results of operations.
60
Table of Contents
SPECIAL NOTE REGARDING FORWARD-LOOKING STATEMENTS
This prospectus contains forward-looking statements about us and our industry that involve substantial risks and uncertainties. All statements other than statements of historical facts contained in this prospectus, including statements regarding our future results of operations or financial condition, business strategy, and plans and objectives of management for future operations, are forward-looking statements. In some cases, you can identify forward-looking statements because they contain words such as anticipate, believe, contemplate, continue, could, estimate, expect, intend, may, plan, potential, predict, project, should, target, will, or would or the negative of these words or other similar terms or expressions. These forward-looking statements include, but are not limited to, statements concerning the following:
| | our expectations regarding our ARR, revenue, expenses, and other operating results; |
| | our ability to acquire new customers and successfully retain existing customers; |
| | our ability to increase the number of users who access our platform and the number of automations built on our platform by our existing customers; |
| | our ability to effectively manage our growth; |
| | our ability to achieve or maintain profitability; |
| | future investments in our business, our anticipated capital expenditures, and our estimates regarding our capital requirements; |
| | the costs and success of our marketing efforts and our ability to maintain and enhance our brand; |
| | our growth strategies, including any further expansion into the top 25 countries as measured by gross domestic product; |
| | the estimated addressable market opportunity for our platform and automation generally; |
| | our reliance on key personnel and our ability to attract and retain highly-qualified personnel; |
| | our ability to obtain, maintain, protect, and enforce our intellectual property rights and any costs associated therewith; |
| | the effect of global events, such as COVID-19 or other public health crises, on our business, industry, and the global economy; |
| | our ability to compete effectively with existing competitors and new market entrants; and |
| | the size and growth rates of the markets in which we compete. |
You should not rely on forward-looking statements as predictions of future events. We have based the forward-looking statements contained in this prospectus primarily on our current expectations and projections about future events and trends that we believe may affect our business, financial condition, and operating results. The outcome of the events described in these forward-looking statements is subject to risks, uncertainties, and other factors described in the section titled Risk Factors and elsewhere in this prospectus. Moreover, we operate in a very competitive and rapidly changing environment. New risks and uncertainties emerge from time to time, and it is not possible for us to predict all risks and uncertainties that could have an impact on the forward-looking statements contained in this prospectus. The results, events, and circumstances reflected in the forward-looking statements may not be achieved or occur, and actual results, events, or circumstances could differ materially from those described in the forward-looking statements.
61
Table of Contents
In addition, statements that we believe, and similar statements, reflect our beliefs and opinions on the relevant subject. These statements are based on information available to us as of the date of this prospectus. And while we believe that information provides a reasonable basis for these statements, that information may be limited or incomplete. Our statements should not be read to indicate that we have conducted an exhaustive inquiry into, or review of, all relevant information. These statements are inherently uncertain, and investors are cautioned not to unduly rely on these statements.
The forward-looking statements made in this prospectus relate only to events as of the date on which the statements are made. We undertake no obligation to update any forward-looking statements made in this prospectus to reflect events or circumstances after the date of this prospectus or to reflect new information or the occurrence of unanticipated events, except as required by law. We may not actually achieve the plans, intentions, or expectations disclosed in our forward-looking statements, and you should not place undue reliance on our forward-looking statements. Our forward-looking statements do not reflect the potential impact of any future acquisitions, mergers, dispositions, joint ventures, or investments.
62
Table of Contents
MARKET, INDUSTRY, AND OTHER DATA
This prospectus contains statistical data, estimates, and forecasts that are based on independent industry publications or other publicly available information, as well as other information based on our internal sources. While we believe the industry and market data included in this prospectus are reliable and are based on reasonable assumptions, these data involve many assumptions and limitations, and you are cautioned not to give undue weight to these estimates. We have not independently verified the accuracy or completeness of the data contained in these industry publications and other publicly available information. The industry in which we operate is subject to a high degree of uncertainty and risk due to a variety of factors, including those described in the sections titled Risk Factors and Special Note Regarding Forward-Looking Statements. Among other items, certain of the market research included in this prospectus was published prior to the outbreak of the COVID-19 pandemic and did not anticipate the virus or the impact it has caused on our industry. We have utilized this pre-pandemic market research in the absence of updated sources. These and other factors could cause results to differ materially from those expressed in the projections and estimates made by the independent third parties and us. See the section titled Risk FactorsRisks Related to Our Business, Products, Operations, and IndustryIf the estimates and assumptions we have used to calculate the size of our addressable market opportunity are inaccurate, our future growth rate may be limited.
The sources of certain statistical data, estimates, and forecasts contained in this prospectus are the following independent industry publications or reports:
| | Bain & Company, Beyond Cost Savings: Reinventing Business Through Automation, published March 2021; |
| | IDC, IDC Intelligent Process Automation; Worldwide Intelligent Process Automation Revenue by Segment and Deployment Type, 2015-2024, published July 2020; |
| | IDC, FutureScape: Worldwide Future of Work 2020 Predictions, published October 2019; |
| | Gallup Inc., Is Working Remotely Effective? Gallup Research Says Yes, published January 2020; |
| | Forrester, Information Worker Population estimate Q1 2021 Commissioned by Morgan Stanley, February 2021; and |
| | Forrester, The Forrester Wave: Robotic Process Automation, published Q1 2021. |
This prospectus also contains our Net Promoter Score, or NPS. NPS is a widely known survey methodology that measures customers overall satisfaction with a companys products and services and their loyalty to the brand. We measure NPS using a scale of zero to 10 based on a customers response to the following survey question: How likely are you to recommend UiPath to other companies? Responses of nine or 10 are considered promoters, responses of seven or eight are considered passive, and responses of six or less are considered detractors. NPS is a percentage expressed as a numerical value, which we calculate by subtracting the percentage of total respondents over a 12-month period who are detractors from the percentage of total respondents over the same period who are promoters. The NPS calculation gives no weight to customers who decline to answer the survey question or respondents who are considered passive. Our NPS score of 71 was calculated on a rolling average using data from a survey of our customer base that we conducted over the 12-month period ended February 2021.
63
Table of Contents
We estimate that we will receive net proceeds from this offering of approximately $467.4 million (or approximately $647.9 million if the underwriters exercise their option to purchase additional shares of our Class A common stock from us in full) based on an assumed initial public offering price of $53.00 per share of Class A common stock, the midpoint of the estimated price range set forth on the cover page of this prospectus, after deducting estimated underwriting discounts and commissions and estimated offering expenses payable by us. We will not receive any of the proceeds from the sale of Class A common stock in this offering by the selling stockholders.
A $1.00 increase (decrease) in the assumed initial public offering price of $53.00 per share of Class A common stock, the midpoint of the estimated price range set forth on the cover page of this prospectus, would increase (decrease) the net proceeds to us from this offering by approximately $9.0 million, assuming the number of shares offered by us, as set forth on the cover page of this prospectus, remains the same, and after deducting estimated underwriting discounts and commissions. Similarly, each increase (decrease) of 1,000,000 shares in the number of shares of Class A common stock offered by us would increase (decrease) the net proceeds to us from this offering by approximately $50.4 million, assuming the assumed initial public offering price of $53.00 per share of Class A common stock remains the same, and after deducting estimated underwriting discounts and commissions.
The principal purposes of this offering are to increase our capitalization and financial flexibility, facilitate an orderly distribution of shares for the selling stockholders, create a public market for our Class A common stock, and facilitate our future access to the capital markets. As of the date of this prospectus, we cannot specify with certainty all of the particular uses for the net proceeds to us from this offering. However, we currently intend to use the net proceeds we receive from this offering for general corporate purposes, including working capital, operating expenses, and capital expenditures. We also intend to donate up to $0.6 million of the net proceeds of this offering to fund our social impact and environmental, social, and governance initiatives, as more fully described in BusinessSocial Responsibility and Community Initiatives. We may also use a portion of the net proceeds to acquire complementary businesses, products, services, or technologies. At this time, we do not have agreements or commitments to enter into any material acquisitions.
We will have broad discretion over how to use the net proceeds to us from this offering. We intend to invest the net proceeds to us from this offering that are not used as described above in investment-grade, interest-bearing instruments.
64
Table of Contents
We have never declared or paid cash dividends on our capital stock. We currently intend to retain all available funds and future earnings, if any, to fund the development and expansion of our business, and we do not anticipate paying any cash dividends in the foreseeable future. In addition, pursuant to our Credit Facility, we are prohibited from paying any dividends without the prior written consent of the required lenders. Any future determination regarding the declaration and payment of dividends, if any, will be at the discretion of our board of directors and will depend on then-existing conditions, including our financial condition, operating results, contractual restrictions, capital requirements, business prospects, and other factors our board of directors may deem relevant.
65
Table of Contents
The following table sets forth our cash, cash equivalents, and restricted cash and capitalization as of January 31, 2021:
| | on an actual basis; |
| | on a pro forma basis, giving effect to (1) the automatic conversion of all of our outstanding shares of convertible preferred stock into an aggregate of 306,300,407 shares of Class A common stock (after giving effect to the Series F Financing), (2) the Class B Conversion, (3) the filing and effectiveness of our amended and restated certificate of incorporation immediately prior to the closing of this offering, (4) the net conversion of 17,606,860 RSUs into shares of Class A common stock for which the service-based vesting condition was satisfied on or before the date of the offering and for which the performance-based vesting condition will be satisfied in connection with this offering, after withholding an aggregate of 165,841 shares to satisfy associated estimated income tax obligations from certain tax jurisdictions (based on an assumed 45% tax withholding rate), (5) the related increase in accrued expenses and other current liabilities and a corresponding decrease in additional paid-in capital for the associated tax liabilities related to the net settlement of the RSUs, and (6) stock-based compensation expenses of approximately $224.9 million related to RSUs for which the service-based vesting condition was satisfied and for which the performance-based vesting condition will be satisfied in connection with this offering; and |
| | on a pro forma as adjusted basis, giving effect to (1) the pro forma adjustments set forth above, (2) our receipt of $467.4 million in net proceeds from the issuance and sale of 9,416,384 shares of Class A common stock that we are offering at an assumed initial public offering price of $53.00 per share, the midpoint of the estimated price range set forth on the cover page of this prospectus, after deducting the estimated underwriting discounts and commissions and estimated offering expenses payable by us, and (3) the conversion of 1,383,168 shares of Class B common stock into an equal number of shares of Class A common stock in connection with the sale of such shares by the selling stockholders in this offering. For more information, see the section titled Principal and Selling Stockholders. We will not receive any proceeds from the sale of shares of our Class A common stock by the selling stockholders. |
You should read this table together with the section titled Managements Discussion and Analysis of Financial Condition and Results of Operations and our consolidated financial statements and related notes included elsewhere in this prospectus.
| As of January 31, 2021 | ||||||||||||
| Actual | Pro Forma | Pro Forma As Adjusted(1) |
||||||||||
| (in thousands except share and per share amounts) | ||||||||||||
| Cash, cash equivalents, restricted cash, and marketable securities |
$ | 474,018 | $ | 1,224,018 | $ | 1,692,115 | ||||||
|
|
|
|
|
|
|
|||||||
| Convertible preferred stock, $0.00001 par value, 297,973,353 shares authorized, 294,257,205 shares issued and outstanding, actual; no shares authorized, issued and outstanding, pro forma and pro forma as adjusted |
$ | 1,221,968 | $ | | $ | | ||||||
|
|
|
|
|
|
|
|||||||
66
Table of Contents
| As of January 31, 2021 | ||||||||||||
| Actual | Pro Forma | Pro Forma As Adjusted(1) |
||||||||||
| (in thousands except share and per share amounts) | ||||||||||||
| Stockholders (deficit) equity: |
||||||||||||
| Preferred stock, $0.00001 par value, no shares authorized, issued and outstanding, actual; 20,000,000 shares authorized, no shares issued and outstanding, pro forma and pro forma as adjusted |
| | | |||||||||
| Class A common stock, $0.00001 par value, 581,000,000 shares authorized, 75,176,582 shares issued and outstanding, actual; 2,000,000,000 shares authorized, 425,901,431 shares issued and outstanding, pro forma; 2,000,000,000 shares authorized, 436,700,983 shares issued and outstanding, pro forma as adjusted |
1 | 4 | 4 | |||||||||
| Class B common stock, $0.00001 par value, 115,741,494 shares authorized, 110,653,498 shares issued and outstanding, actual; 115,741,494 shares authorized, 83,835,916 shares issued and outstanding, pro forma; 115,741,494 shares authorized, 82,452,748 shares issued and outstanding, pro forma as adjusted |
1 | 1 | 1 | |||||||||
| Additional paid-in capital |
179,175 | |
2,367,208 |
|
|
2,834,572 |
|
|||||
| Accumulated other comprehensive loss |
(12,521 | ) | (12,521 | ) | (12,521 | ) | ||||||
| Accumulated deficit |
(970,360 | ) | (1,195,218 | ) | (1,195,218 | ) | ||||||
|
|
|
|
|
|
|
|||||||
| Total stockholders (deficit) equity |
(803,704 | ) | 1,159,474 | 1,626,838 | ||||||||
|
|
|
|
|
|
|
|||||||
| Total capitalization |
$ | 418,264 | $ | 1,159,474 | $ | 1,626,838 | ||||||
|
|
|
|
|
|
|
|||||||
| (1) | Pro forma as adjusted cash, cash equivalents, restricted cash, and marketable securities do not give effect to $0.7 million of deferred offering costs that had been paid as of January 31, 2021. |
A $1.00 increase (decrease) in the assumed initial public offering price of $53.00 per share of Class A common stock, the midpoint of the estimated price range set forth on the cover page of this prospectus, would increase (decrease) each of our pro forma as adjusted cash, cash equivalents, restricted cash, and marketable securities, and additional paid-in capital, total stockholders (deficit) equity and total capitalization by approximately $9.0 million, assuming the number of shares offered by us, as set forth on the cover page of this prospectus, remains the same, and after deducting estimated underwriting discounts and commissions. Similarly, each increase (decrease) of 1,000,000 shares in the number of shares of Class A common stock offered by us would increase (decrease) each of our pro forma as adjusted cash, cash equivalents, restricted cash, and marketable securities, and additional paid-in capital, total stockholders (deficit) equity and total capitalization by approximately $50.4 million, assuming the assumed initial public offering price of $53.00 per share of Class A common stock remains the same, and after deducting estimated underwriting discounts and commissions.
The number of shares of Class A common stock and Class B common stock that will be outstanding after this offering is based on 425,901,431 shares of Class A common stock and 83,835,916 shares of Class B common stock outstanding as of January 31, 2021, and excludes:
| | 5,175,906 shares of Class A common stock issuable on the exercise of stock options outstanding as of January 31, 2021 under the 2015 Plan, with a weighted-average exercise price of $0.07 per share; |
| | 17,836,792 shares of Class A common stock issuable on the exercise of stock options outstanding as of January 31, 2021 under the 2018 Plan, with a weighted-average exercise price of $2.02 per share; |
67
Table of Contents
| | 146,549 shares of Class A common stock issuable on the exercise of stock options granted after January 31, 2021 under the 2018 Plan, with a weighted-average exercise price of $0.10 per share; |
| | 16,646,293 shares of Class A common stock issuable on the vesting and settlement of RSUs outstanding as of January 31, 2021 under the 2018 Plan for which the performance-based vesting condition will be satisfied in connection with this offering, but for which the service-based vesting condition will not be satisfied on or before the date of this offering; |
| | 2,812,974 shares of Class A common stock issuable upon the vesting and settlement of RSUs granted after January 31, 2021 under the 2018 Plan for which the performance-based vesting condition will be satisfied in connection with this offering, but for which the service-based vesting condition will not be satisfied on or before the date of this offering; |
| | 60,109,479 shares of Class A common stock reserved for future issuance under our 2021 Plan, as well as any future increases, including annual automatic evergreen increases, in the number of shares of Class A common stock reserved for issuance thereunder, and any shares underlying stock awards outstanding under the 2015 Plan or the 2018 Plan that expire or are repurchased, forfeited, canceled, or withheld; |
| | 10,500,000 shares of Class A common stock reserved for issuance under our ESPP, as well as any future increases, including annual automatic evergreen increases, in the number of shares of Class A common stock reserved for future issuance under our ESPP; and |
| | 2,810,082 shares of our Class A common stock that we have reserved and may donate to fund our social impact and environmental, social, and governance initiatives, as more fully described in BusinessSocial Responsibility and Community Initiatives. |
68
Table of Contents
If you invest in our Class A common stock in this offering, your interest will be diluted to the extent of the difference between the initial public offering price per share of Class A common stock and the pro forma as adjusted net tangible book value per share immediately after this offering.
Our pro forma net tangible book value as of January 31, 2021 was $1,078.0 million, or $2.11 per share. Our pro forma net tangible book value per share represents the amount of our total tangible assets less our total liabilities, divided by the number of our shares of common stock outstanding as of January 31, 2021, after giving effect to (1) the automatic conversion of all of our outstanding shares of convertible preferred stock into an aggregate of 306,300,407 shares of Class A common stock (after giving effect to the Series F Financing), (2) the Class B Conversion, (3) the net conversion of 17,606,860 shares of RSUs into Class A common stock for which the service-based vesting condition was satisfied on or before the date of the offering and for which the performance-based vesting condition will be satisfied in connection with this offering, after withholding an aggregate of 165,841 shares to satisfy associated estimated income tax obligations from certain tax jurisdictions (based on an assumed 45% tax withholding rate), (4) the related increase in accrued expenses and other current liabilities and a corresponding decrease in additional paid-in capital for the associated tax liabilities related to the net settlement of the RSUs, and (5) stock based compensation expenses of approximately $224.9 million related to RSUs for which the service-based vesting condition was satisfied and for which the performance-based vesting condition will be satisfied in connection with this offering.
After giving effect to (1) the sale by us of 9,416,384 shares of Class A common stock in this offering at an assumed initial public offering price of $53.00 per share, the midpoint of the estimated price range set forth on the cover page of this prospectus, after deducting estimated underwriting discounts and commissions and estimated offering expenses payable by us, and (2) the conversion of 1,383,168 shares of Class B common stock into an equal number of shares of Class A common stock in connection with the sale of such shares by the selling stockholders in this offering, from which we will not receive any proceeds, our pro forma as adjusted net tangible book value as of January 31, 2021 would have been $1,545.4 million, or $2.98 per share, inclusive of deferred offering costs of $0.7 million as of January 31, 2021. This amount represents an immediate increase in pro forma as adjusted net tangible book value of $0.87 per share to our existing stockholders and an immediate dilution of $50.02 per share to new investors purchasing Class A common stock in this offering. We determine dilution by subtracting the pro forma as adjusted net tangible book value per share after this offering from the initial public offering price per share paid by investors purchasing Class A common stock in this offering. The following table illustrates this dilution on a per share basis:
| Assumed initial public offering price per share |
$ | 53.00 | ||||||
| Historical net tangible book value per share as of January 31, 2021 |
$ | 1.81 | ||||||
| Increase per share attributable to the pro forma adjustments described above |
0.30 | |||||||
| Pro forma net tangible book value per share as of January 31, 2021 |
2.11 | |||||||
| Increase in pro forma as adjusted net tangible book value per share attributable to new investors purchasing shares in this offering |
0.87 | |||||||
|
|
|
|||||||
| Pro forma as adjusted net tangible book value per share after giving effect to this offering |
2.98 | |||||||
|
|
|
|||||||
| Dilution per share to new investors in this offering |
$ | 50.02 | ||||||
|
|
|
The dilution information discussed above is illustrative only and may change based on the actual initial public offering price and other terms of this offering. A $1.00 increase (decrease) in the assumed initial public offering price of $53.00 per share of Class A common stock, the midpoint of the estimated price range set forth on the cover page of this prospectus, would increase (decrease) our pro forma as adjusted net tangible book value per share by $0.02 per share, and increase (decrease) the immediate dilution to new investors by $0.98 per share, in each case assuming the number of shares of Class A common stock offered by us, as set forth on the cover page of this prospectus, remains the same, and after deducting estimated underwriting discounts and
69
Table of Contents
commissions and estimated offering expenses payable by us. Similarly, each increase of 1,000,000 shares in the number of shares of Class A common stock offered by us would increase our pro forma as adjusted net tangible book value by $0.09 per share and decrease the immediate dilution to new investors by $0.09 per share, and each decrease of 1,000,000 shares in the number of shares of Class A common stock offered by us would decrease our pro forma as adjusted net tangible book value by $0.09 per share and increase the immediate dilution to new investors by $0.09 per share, in each case assuming the assumed initial public offering price of $53.00 per share of Class A common stock remains the same, and after deducting estimated underwriting discounts and commissions and estimated offering expenses payable by us.
If the underwriters exercise their option to purchase additional shares of Class A common stock from us in full, our pro forma as adjusted net tangible book value as of January 31, 2021 would have been $1,725.9 million, or $3.30 per share, and the immediate dilution in pro forma net tangible book value per share to new investors would have been $49.70 per share.
The following table summarizes, as of January 31, 2021, on a pro forma as adjusted basis as described above, the number of shares of our Class A common stock and Class B common stock, the total consideration and the average price per share (1) paid to us by existing stockholders and (2) to be paid by new investors acquiring our Class A common stock in this offering at an assumed initial public offering price of $53.00 per share, the midpoint of the estimated price range set forth on the cover page of this prospectus, before deducting estimated underwriting discounts and commissions and estimated offering expenses payable by us.
| Shares Purchased | Total Consideration | Average Price Per Share |
||||||||||||||||||
| Number | Percent | Amount | Percent | |||||||||||||||||
| Existing stockholders |
509,737,347 | 98.2 | % | $ | 1,972,147 | 79.8 | % | $ | 3.87 | |||||||||||
| New investors |
9,416,384 | 1.8 | 499,068 | 20.2 | 53.00 | |||||||||||||||
|
|
|
|
|
|
|
|
|
|||||||||||||
| Totals |
519,153,731 | 100.0 | % | $ | 2,471,215 | 100.0 | % | 4.76 | ||||||||||||
|
|
|
|
|
|
|
|
|
|||||||||||||
Sales by the selling stockholders in this offering will cause the number of shares held by existing stockholders to be reduced to 495,262,954 shares, or 95.4% of the total number of shares of our capital stock outstanding following the completion of this offering, and will increase the number of shares held by new investors to 23,890,777 shares, or 4.6% of the total number of shares of our capital stock outstanding following the completion of this offering.
Each $1.00 increase (decrease) in the assumed initial public offering price of $53.00 per share, the midpoint of the estimated price range set forth on the cover page of this prospectus, would increase (decrease) the total consideration paid by new investors and total consideration paid by all stockholders by $9.0 million, assuming that the number of shares of Class A common stock offered by us, as set forth on the cover page of this prospectus, remains the same and after deducting estimated underwriting discounts and commissions. Similarly, each increase (decrease) of 1,000,000 shares in the number of shares of Class A common stock offered by us would increase (decrease) the total consideration paid by new investors and total consideration paid by all stockholders by $50.4 million, assuming the assumed initial public offering price of $53.00 per share of Class A common stock remains the same, and after deducting estimated underwriting discounts and commissions.
The number of shares of Class A common stock and Class B common stock that will be outstanding after this offering is based on 425,901,431 shares of Class A common stock and 83,835,916 shares of Class B common stock outstanding as of January 31, 2021, and excludes:
| | 5,175,906 shares of Class A common stock issuable on the exercise of stock options outstanding as of January 31, 2021 under the 2015 Plan, with a weighted-average exercise price of $0.07 per share; |
| | 17,836,792 shares of Class A common stock issuable on the exercise of stock options outstanding as of January 31, 2021 under the 2018 Plan, with a weighted-average exercise price of $2.02 per share; |
70
Table of Contents
| | 146,549 shares of Class A common stock issuable on the exercise of stock options granted after January 31, 2021 under the 2018 Plan, with a weighted-average exercise price of $0.10 per share; |
| | 16,646,293 shares of Class A common stock issuable on the vesting and settlement of RSUs outstanding as of January 31, 2021 under the 2018 Plan for which the performance-based vesting condition will be satisfied in connection with this offering, but for which the service-based vesting condition will not be satisfied on or before the date of this offering; |
| | 2,812,974 shares of Class A common stock issuable upon the vesting and settlement of RSUs granted after January 31, 2021 under the 2018 Plan for which the performance-based vesting condition will be satisfied in connection with this offering, but for which the service-based vesting condition will not be satisfied on or before the date of this offering; |
| | 60,109,479 shares of Class A common stock reserved for future issuance under our 2021 Plan, as well as any future increases, including annual automatic evergreen increases, in the number of shares of Class A common stock reserved for issuance thereunder, and any shares underlying stock awards outstanding under the 2015 Plan or the 2018 Plan that expire or are repurchased, forfeited, canceled, or withheld; |
| | 10,500,000 shares of Class A common stock reserved for issuance under our ESPP, as well as any future increases, including annual automatic evergreen increases, in the number of shares of Class A common stock reserved for future issuance under our ESPP; and |
| | 2,810,082 shares of our Class A common stock that we have reserved and may donate to fund our social impact and environmental, social, and governance initiatives, as more fully described in BusinessSocial Responsibility and Community Initiatives. |
To the extent that any outstanding options are exercised, outstanding RSUs vest and settle or new options or RSUs are issued under our stock-based compensation plans, or we issue additional shares of Class A common stock in the future, there will be further dilution to investors participating in this offering. If all outstanding options under the 2015 Plan and 2018 Plan and RSUs under the 2018 Plan as of January 31, 2021 were exercised or vested and settled, as applicable, then our existing stockholders, including the holders of these options and RSUs, would own 98.4% and our new investors would own 1.6% of the total number of shares of our Class A common stock and Class B common stock outstanding on the closing of this offering.
71
Table of Contents
MANAGEMENTS DISCUSSION AND ANALYSIS OF
FINANCIAL CONDITION AND RESULTS OF OPERATIONS
The following discussion and analysis of our financial condition and results of operations should be read in conjunction with the consolidated financial statements and related notes included elsewhere in this prospectus. Some of the information contained in this discussion and analysis, including information with respect to our planned investments in our sales and marketing, research and development, and general and administrative functions, includes forward-looking statements that involve risks and uncertainties. You should review the sections titled Special Note Regarding Forward-Looking Statements and Risk Factors for a discussion of forward-looking statements and important factors that could cause actual results to differ materially from the results described in or implied by the forward-looking statements contained in the following discussion and analysis. The last day of our fiscal year is January 31. Our fiscal quarters end on April 30, July 31, October 31, and January 31. References to fiscal years 2019, 2020, and 2021 in this prospectus refer to our fiscal years ended January 31, 2019, 2020, and 2021.
Overview
We are at the forefront of technology innovation and thought leadership in automation, creating an end-to-end platform that provides automation with user emulation at its core. Our platform leverages computer vision and artificial intelligence, or AI, to empower software robots to emulate human behavior and execute specific business processes, eliminating the need for employees to execute certain manual and mundane tasks. Our platform allows employees to focus on more value-added work and enables organizations to seamlessly automate business processes ranging from those in legacy information technology, or IT, systems and on-premises applications to new cloud-native infrastructure and applications without requiring significant changes to the organizations underlying technology infrastructure. Our platform is purpose-built to be used by employees throughout a company and to address a wide variety of use cases, from simple tasks to long-running, complex business processes.
Our platform is designed to transform the way humans work. We provide our customers with a robust set of capabilities to discover automation opportunities and build, manage, run, engage, measure, and govern automations across departments within an organization. Our platform leverages the power of AI-based computer vision to enable our robots to perform a vast array of actions as a human would when executing business processes. These actions include, but are not limited to, logging into applications, extracting information from documents, moving folders, filling in forms, and updating information fields and databases. Our robots ability to learn from and replicate workers steps in executing business processes drives continuous improvements in operational efficiencies and enables companies to deliver on key digital initiatives with greater speed, agility, and accuracy.
Our platform is designed to interact with and automate processes across a companys existing enterprise stack. As a result, our customers can leverage the power of our platform without the need to replace or change existing business applications and with lower overall IT infrastructure cost. Our platform enables employees to quickly build automations for both existing and new processes. Employees can seamlessly maintain and scale automations across multiple deployment options, constantly improve and evolve automations, and continuously track and measure the performance of automations, all without substantial technical experience.
At the core of our automation platform is a set of capabilities that emulates human behavior, which provides our customers with the ability to automate both simple and complex use cases. Automations on our platform can be built, consumed, managed, and governed by any employee who interacts with computers, resulting in the potential for broad applicability of our platform across departments within an organization. Society is at a turning point in how organizations execute work, and we believe the ability to leverage software to enrich the employee experience will unlock tremendous value and efficiency opportunities. While we are still in the early days of a multi-year journey to the fully automated enterprise, momentum is growing as organizations across the world are only now beginning to understand the power of automation.
72
Table of Contents
UiPath was founded in 2005 in Bucharest, Romania as a company principally focused on building automation scripts and developing computer vision technology, which remains the foundation of our platform today. Since that time, we have developed and enhanced our robotic process automation, or RPA, capabilities, launched new products, and expanded our operations across the globe. Key milestones on our journey included the following:
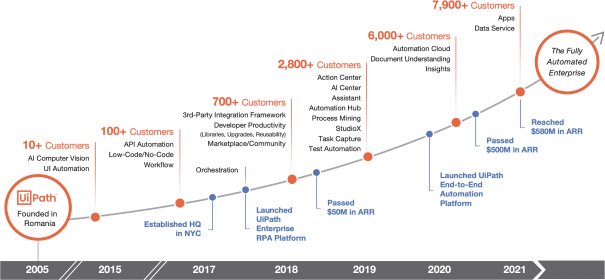
We offer a comprehensive range of automation solutions via a suite of interrelated software offerings. We generate revenue from the sale of licenses for our proprietary software, maintenance and support, and professional services. Our license fees are based primarily on the number of users who access our software and the number of automations running on our platform. Our license agreements primarily have annual terms, and some of our license agreements have multi-year terms. We generally do not sell standalone licenses with a term of less than one year. However, during the term of an annual contract or the last year of a multi-year contract, our customers may enter into an additional license agreement with a termination date that is coterminous with the anniversary date of such annual contract. Additionally, we provide maintenance and support for our software as well as non-recurring professional services such as training and implementation services to facilitate the adoption of our platform. Our professional services complement the capabilities of our customers and partners as they improve customers time-to-market and optimize business outcomes using our platform. Our non-recurring professional services include use case development and deployment, solutions architecting, implementation consulting, and training.
We have an efficient go-to-market model, which consists primarily of an enterprise field sales force supplemented by a high velocity inside sales team focused on small and mid-sized customers, as well as a global strategic sales team focused on the largest global customers. As of January 31, 2020, we had 6,009 customers, including 80% of the Fortune 10 and 61% of the Fortune Global 500. As of January 31, 2021, we had 7,968 customers, including 80% of the Fortune 10 and 63% of the Fortune Global 500. Our customers span a variety of industries and include Adobe, Applied Materials, Chevron, Chipotle Mexican Grill, CrowdStrike, CVS Health, Deutsche Post DHL, EY, Generali, KDDI, SBA Communications, Takeda Pharmaceuticals, and Uber Technologies, Inc.
Many of our customers expand the scope and size of use cases of our platform across their organizations as they quickly realize the power of our platform. We believe that the success of our land-and-expand business model is centered on our ability to deliver significant value in a very short time. We grow with our customers as they identify and expand the number of business processes to automate, which increases the number of robots
73
Table of Contents
deployed and the number of users interacting with our robots. Our ability to expand within our customer base is demonstrated by our dollar-based net retention rate, which represents the rate of net expansion of annualized renewal run-rate, or ARR, from existing customers over the last 12 months. Our dollar-based net retention rate was 153% and 145% as of January 31, 2020 and 2021, respectively. See the section titled Key Factors Affecting Our Performance for additional information regarding our dollar-based net retention rate.
A crucial component of our go-to-market strategy is our partner and channel ecosystem, which extends our local and global reach and helps ensure customers are able to rapidly build, deploy, and scale automations on our platform. Our business partners include more than 3,700 global and regional system integrators, value-added resellers, and business consultants. Our partner network includes, among others, Accenture LLP, Capgemini SE, CGI Inc., Cognizant Technology Solutions Corporation, Deloitte & Touche LLP, Ernst and Young LLP, KPMG LLP, and PricewaterhouseCoopers LLP. We provide tiering recognition through Diamond, Gold, Silver, and Registered levels for partners that meet competency requirements and deliver and maintain a specified number of satisfied customers. These partnerships enhance our market presence and drive greater sales efficiencies. In addition, we have aggressively built strong technology partnerships and alliances to enable a large number of connectors and other technical capabilities necessary to meet the breadth of our customer needs. Our technical alliances include, among others, Amazon Web Services Inc., Adobe Inc., Alteryx Inc., Box, Inc., International Business Machines Corporation, Microsoft Corporation, Oracle Corporation, Salesforce.com, inc., SAP SE, ServiceNow, Inc., and Workday, Inc.
We have experienced rapid growth. Our ARR was $351.4 million and $580.4 million in the fiscal years ended January 31, 2020 and 2021, respectively, representing a growth rate of 65%. Approximately 30% of this growth rate was due to new customers and 70% of this growth rate was due to existing customers. We generated revenue of $336.2 million and $607.6 million, representing a growth rate of 81%, and a net loss of $519.9 million and $92.4 million in the fiscal years ended January 31, 2020 and 2021, respectively. Our operating cash flows were $(359.4) million and $29.2 million and our free cash flows were $(380.4) million and $26.0 million in the fiscal years ended January 31, 2020 and 2021, respectively. See the section titled Non-GAAP Financial MeasuresNon-GAAP Free Cash Flow for additional information on free cash flow, a non-GAAP measure.
Our Focus on Driving Operational Efficiency and Hyper-Growth
We have been strategic and intentional in building and scaling our global business to disrupt a large and fast-growing market. In fiscal year 2019, we intensely focused on investments to capture the significant opportunity in the automation market, as well as to build our global brand. In fiscal year 2020, we continued to make investments that enabled our hyper-growth and market capture, and began to focus on realizing the operational leverage inherent in our business model and customer economics. In fiscal year 2021, we continued our focus on demonstrating the operational leverage in our business model, while prioritizing investments that will allow us to continue to achieve best-in-class growth and business scale and to capitalize on our significant market opportunity.
We have made incredible progress in building a world-class business. Today, we are a company committed to solving for both growth and efficiency and have accelerated our path to profitability while continuing to deliver hyper-growth.
Impact from COVID-19
When the COVID-19 pandemic began to unfold, we were able to move seamlessly to a remote working environment given our investments in fiscal year 2019 in a digital-first business. We took decisive action across our internal and customer operations to ensure the resilience of our company and the safety of our employees. We temporarily shut down all offices and offered our employees technology stipends to encourage remote working, postponed the majority of physical conferences and other customer and promotional events through the end of 2020, implemented global travel restrictions, reduced headcount and expenses related to event-marketing, and engaged in other discretionary cost-saving measures through May 2020. Aligned with our rigor around operational discipline
74
Table of Contents
and people-first culture, we reduced our executive salaries from March through May 2020 and preserved our global team of employees and their compensation and incentive structures. Our operational rigor, digital infrastructure, and global footprint enabled us to support our customers navigating new challenges presented by the pandemic and existing needs to automate. We also continued to invest in the development and marketing of our automation platform. Ever mindful of our role as global citizens, we began to offer customers in critical industries and situations on the frontlines of the pandemic promotions enabling them to utilize our platform for free for a limited time in order to assist them in responding to the world crisis. For example, the power of automation helped nurses to spend more time with COVID-19 patients, accelerated access to unemployment benefits, and reduced the length of clinical trials in a race to a viable vaccine and life-saving therapeutics. As the pandemic persisted, global demand for automation continued to accelerate as automation became essential for business execution and performance in a remote working environment. Beginning in the third quarter of fiscal year 2021, we reallocated our financial and strategic focuses. For instance, we accelerated our investments in our research and development and engineering initiatives and refocused our marketing efforts to surface the value of our automation platform to customers looking to invest in and/or accelerate their automation initiatives. While the pandemic may have accelerated the adoption of automation, the need for organizations to address extraordinary cost pressures, preserve and grow revenue, and adapt to ever-evolving end-customer needs illustrates the durability of the demand for digital transformation and the resilience and power of automation in even the most challenging times.
Key Metric
We monitor the following key metric to help us measure and evaluate the effectiveness of our operations:
| Fiscal Year Ended January 31, | ||||||||||||||||
| 2020 | 2021 | Change | % Change | |||||||||||||
| (dollars in thousands) | ||||||||||||||||
| Annualized renewal run-rate (ARR) |
$ | 351,441 | $ | 580,483 | $ | 229,042 | 65 | % | ||||||||
Annualized Renewal Run-Rate
ARR is the key metric we use in managing our business because it illustrates our ability to acquire new subscription customers and to maintain and expand our relationship with existing subscription customers. We define ARR as annualized invoiced amounts per solution sku from subscription licenses and maintenance obligations assuming no increases or reductions in their subscriptions. ARR does not include the costs we may incur to obtain such subscription licenses or provide such maintenance, and does not reflect any actual or anticipated reductions in invoiced value due to contract non-renewals or service cancellations other than for specific bad debt or disputed amounts. For the fiscal years ended January 31, 2020 and 2021, our ARR was $351.4 million and $580.4 million, respectively, representing a growth rate of 65%. Approximately 30% of this growth rate was due to new customers and 70% of this growth rate was due to existing customers. In each of the fiscal years ended January 31, 2020 and 2021, our ARR was approximately 1.0x of our total revenue. Our ARR may decline or fluctuate as a result of a number of factors, including customers satisfaction or dissatisfaction with our platform and professional services, pricing, competitive offerings, economic conditions, or overall changes in our customers spending levels. ARR should be viewed independently of revenue and deferred revenue as ARR is an operating metric and is not intended to be combined with or replace these items. For clarity, we use annualized invoiced amounts per solution sku as compared to revenue calculated in accordance with accounting principles generally accepted in the United States, or GAAP, to calculate our ARR. Our invoiced amounts are not matched to the performance obligations associated with the underlying subscription licenses and maintenance obligations as they are with respect to our GAAP revenue. This can result in timing differences between our GAAP revenue and ARR calculations. Our ARR calculation simply takes our invoiced amounts per solution sku under a subscription license or maintenance agreement and divides that amount by the invoice term and multiplies by 365 days to derive the annualized value. In contrast, for our revenue calculated in accordance with GAAP, subscription license revenue derived from the sale of term-based licenses hosted on-premises is recognized at the point-in-time when the customer is able to use and benefit from our
75
Table of Contents
software, which is generally upon delivery to the customer or upon the commencement of the renewal term, and maintenance revenue is recognized ratably over the term of the arrangement. ARR is not a forecast of future revenue, which can be impacted by contract start and end dates, duration, and renewal rates, and does not include invoiced amounts reported as perpetual licenses or professional services revenue in our consolidated statements of operations. In addition, investors should not place undue reliance on ARR as an indicator of our future or expected results. Moreover, ARR may differ from similarly titled metrics presented by other companies and may not be comparable to such other metrics. See the section titled Risk FactorsRisks Related to Our Business, Products, Operations, and IndustryOur key operating metric, ARR, and certain other operational data in this prospectus are subject to assumptions and limitations and may not provide an accurate indication of our future or expected results.
Our Business Model
Our platform is designed to identify and accelerate the design and deployment of automations that can be executed by our robots under the management and control of our customers. We have built a platform that addresses the end-to-end automation lifecycle of our customers, helping our customers discover, build, manage, run, engage, measure, and govern their automation programs. Our primary business model is to help customers leverage our platform to deploy more unattended, attended, testing, and AI robots, and to make it easier for everyone, from non-technically oriented workers to professional developers, to build and deploy robots.
We believe that as customers deploy more robots over time, their return-on-investment will generally increase. We call this approach our Automation Flywheel. The more our customers employ our new products around the flywheel, the faster we believe they require additional robots to execute automations. For example, our Automation Hub and Process Mining products greatly improve the identification of tasks and process bottlenecks ideal for automation, accelerating the design and deployment of automations that can provide meaningful business impacts. Our products are designed to be additive, with most of our capabilities designed to increase the deployment of automations that drive the need for additional robots, to be modular, and to be used individually or as a unified solution.
We offer our platform and support in various ways to meet the needs of our diverse customer base, including:
| | On-Premises, Public or Private Cloud, or Hybrid Environment. Customers can deploy our platform on-premises, in a public or private cloud, or in a hybrid environment. In addition, we offer a managed, multi-tenant, software-as-a-service, or SaaS, version called Automation Cloud, which enables our customers to begin automating without the need to provision infrastructure, install applications, or perform additional configurations. |
| | Licensed Software, Largely through Annual and Multi-Year Subscription Contracts. Our platform is offered mainly through term licenses that provide customers the right to use our software and access to continuous support. A small percentage of our customers acquire perpetual licenses, which include provisions for maintenance and support. In limited cases, the maintenance and support for perpetual licenses is renewable, generally on an annual basis, at the option of the customer. |
| | Professional Services and Premium Support. We also offer professional services and other support to our customers, including process automation, use case development and deployment, business consulting, and customer education and training services. |
In the future, we expect further expansion of our cloud-based deployments. As cloud-based license software and services become a larger percentage of our sales, we expect the cloud offering to impact the timing of our recognition of revenue as well as impact our operating margins due to an increase in hosting fees and cloud infrastructure costs.
76
Table of Contents
Historically, once our platform is deployed, our customers have significantly expanded their use of our platform by engaging with our customer success team as well as increasing use and spend across our product categories and pivoting into enterprise agreements for the entire platform. The chart below illustrates this expansion by presenting the ARR from each customer cohort over the years presented. See Key MetricAnnualized Renewal Run-Rate for additional information regarding our ARR. Each cohort represents customers that made their initial purchase from us in a given fiscal year. For example, the 2016 cohort includes all customers that had their initial purchase within the fiscal year 2016. This cohort increased their ARR from $395,368 as of January 31, 2016 to $22.7 million as of January 31, 2021, representing a multiple of approximately 57x since fiscal year 2016.
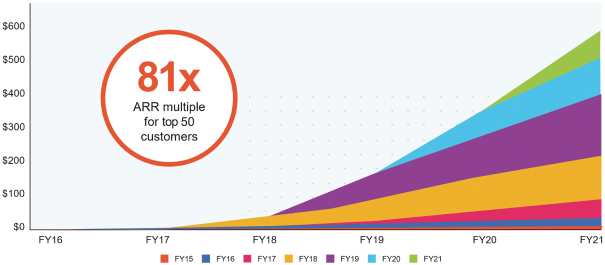
Additionally, the ARR from our top 50 customers as of January 31, 2021 increased by a median multiple of approximately 81x, as measured from the ARR generated in each such customers first month as a customer.
Our Fiscal Year
Our fiscal year ends on January 31. We changed the end of our fiscal year from December 31 to January 31, effective for our fiscal year ended January 31, 2019.
Key Factors Affecting Our Performance
Our results of operations and financial condition are impacted by the macro factors affecting our industry, including the proliferation of cloud-based applications, the cost of skilled human capital, and the global demand for automation solutions. While our business is influenced by these macro factors, our results of operations are more directly affected by certain company specific factors, including:
Growing Our Global Customer Base
We believe there is a substantial opportunity to continue to grow our customer base. Additionally, we believe that as more organizations adopt our automation platform and experience quantifiable competitive advantages, other organizations will also adopt automation as a necessary tool to compete. While we sell to organizations of all sizes and across a broad range of industries, our go-to-market teams key focus is on the largest organizations, including large enterprises and governments. We also use an inside sales team focused on small and mid-sized businesses. We plan to continue to invest in our go-to-market team to grow our customer
77
Table of Contents
base both domestically and internationally. We intend to continue to grow our customer base by focusing on the top 25 countries as measured by gross domestic product. Although these investments may adversely affect our operating results in the near term, we believe that they will contribute to our long-term growth. Our ability to attract new customers will also depend on a number of other factors, including our ability to drive awareness of the benefits and power of automation in the industry and at our existing and prospective customers, the effectiveness and pricing of our products, the offerings of our competitors, and competition among resellers.
We define our number of customers as the number of accounts with a unique account identifier for which we have an active subscription in the period indicated and include in our customer count entities to which we have sold our products either directly or through a channel partner. Users of our free trials or tier are not included in our customer count. A single organization with multiple divisions, segments, or subsidiaries is counted as a single customer. Our customer count is subject to adjustments for acquisitions, consolidations, spin-offs, and other market activity, and specifically excludes non-paying partners and resellers.
Expanding Within Our Existing Customer Base
Our customer base represents a significant opportunity for further sales expansion. As of January 31, 2020, we had 6,009 customers, including 80% of the Fortune 10 and 61% of the Fortune Global 500. As of January 31, 2021, we had 7,968 customers, including 80% of the Fortune 10 and 63% of the Fortune Global 500. We employ a land-and-expand business model centered around offering products that are easy to adopt and have a short time to value. We believe there is significant opportunity for us to become a strategic partner to our customers in their automation journeys and drive further sales expansion through the following vectors:
| | deploy more robots across different departments; |
| | provide more employees with their own robot assistants; |
| | increase adoption of platform products; and |
| | expand use cases for automation in the enterprise to drive increased usage of robots and capacity consumption of our various products. |
Our customers often expand the deployment of our platform across large teams and more broadly within the enterprise as they find new use cases for our platform and their employees increasingly interact and gain confidence working with robots. Evidence of the power of our land-and-expand model is our customers that exceed significant ARR thresholds. For example, as of January 31, 2019, we had 305 customers with ARR of $100,000 or more and 21 customers with ARR of $1.0 million or more, which accounted for 69% and 27% of our revenue, respectively, for the fiscal year then ended. As of January 31, 2020, we had 597 customers with ARR of $100,000 or more and 43 customers with ARR of $1.0 million or more, which accounted for 69% and 25% of our revenue, respectively, for the fiscal year then ended. As of January 31, 2021, we had 1,002 customers with ARR of $100,000 or more and 89 customers with ARR of $1.0 million or more, which accounted for 75% and 35% of our revenue, respectively, for the fiscal year then ended.
Further evidence of our land-and-expand business model is our dollar-based net retention rate, which was 153% and 145% as of January 31, 2020 and 2021, respectively. We calculate dollar-based net retention rate as of a period end by starting with the ARR from the cohort of all customers as of 12 months prior to such period-end, or the Prior Period ARR. We then calculate the ARR from these same customers as of the current period-end, or the Current Period ARR. Current Period ARR includes any expansion and is net of contraction or attrition over the last 12 months, but does not include ARR from new customers in the current period. We then divide the total Current Period ARR by the total Prior Period ARR to arrive at the point-in-time dollar-based net retention rate.
Furthermore, our dollar-based gross retention rate, which is the percentage of ARR from all subscription customers as of the year prior that is not lost to customer churn, was 96% and 97% as of January 31,
78
Table of Contents
2020 and 2021, respectively. We calculate our dollar-based gross retention rate as of a period end by starting with the ARR from the cohort of all subscription customers as of 12 months prior to such period-end, or the Prior Period ARR. We then deduct from the Prior Period ARR any ARR from subscription customers who are no longer customers as of the current period end, or the Current Period Remaining ARR. We then divide the total Current Period Remaining ARR by the total Prior Period ARR to arrive at the point-in-time dollar-based gross retention rate. Because our dollar-based gross retention rate reflects only customer losses and does not reflect customer expansion or contraction, it demonstrates that the vast majority of our customers continue to use our platform and renew their licensed software.
We believe these impressive retention rates demonstrate the stickiness of the product category we operate in and of our platform in particular. We intend to continue to invest in enhancing awareness of our brand and developing more products, features, and functionality, which we believe are important factors to achieve widespread adoption of our platform. Our ability to increase sales to existing customers will depend on a number of factors, including our customers satisfaction with our solution, competition, pricing, and overall changes in our customers spending levels.
Driving Preference and Share of System Integrators, Value-Added Resellers, and Business Consultants Selling the Value Propositions and Capabilities of Digital Transformation
We are focused on maintaining and growing our ecosystem of partners that build, train, and certify skills in our technology as well as deploy our technology on behalf of their customers. We have built a global partner ecosystem of more than 3,700 systems integrators, value-added resellers, business consultants, technology partners and public cloud vendors. Our partner network includes, among others, Accenture LLP, Capgemini SE, CGI Inc., Cognizant Technology Solutions Corporation, Deloitte & Touche LLP, Ernst and Young LLP, KPMG LLP, and PricewaterhouseCoopers LLP. We provide a tiering recognition through Diamond, Gold, Silver, and Registered levels for partners that meet competency requirements and deliver and maintain a tiered number of satisfied customers. In 2020, we launched the UiPath Services Network, or USN, program to recognize an elite network of partners accredited with advanced delivery skills, and over 50 partners have earned USN certification. We also offer a professional services capability that augments our partners efforts where necessary. Our ability to grow our partnership base depends on the competitiveness of our platform and the profitability of our relationship for our partners and potential partners.
Sustaining Innovation and Automation Leadership
Our success is dependent on our ability to sustain innovation and automation leadership in order to maintain our competitive advantage. We believe that we have built a differentiated automation platform and intend to continually increase the value we provide to our customers by investing in extending the capabilities of our platform. We have made and will continue to make significant investments in research and development to bolster our existing technology and enhance usability to improve our customers productivity. We also collaborate with other leading technology companies to develop integrations that simplify the interoperability of our platform with their technology. Examples of integrations available to our customers include integrations with offerings from Amazon Web Services Inc., Adobe Inc., Alteryx Inc., Box, Inc., International Business Machines Corporation, Microsoft Corporation, Oracle Corporation, Salesforce.com, inc., SAP SE, ServiceNow, Inc., and Workday, Inc. These pre-built integrations can accelerate the adoption of our platform within our customers environment and speed the creation of automations that span multiple technologies. We also maintain partnerships with leading cloud vendors, such as Amazon Web Services Inc., Google Inc., and Microsoft Corporation, to both simplify the deployment of our platform and extend our platform to offer customers the benefits of cloud-based AI capabilities. We are focused on maintaining and growing our ecosystem of partners to continue to expand our market presence and drive greater sales efficiencies. We also intend to continue to evaluate strategic acquisitions and investments in businesses and technologies to drive product and market expansion. For example, in March 2021, we acquired Cloud Elements Inc., a provider of a leading API integration platform for SaaS application providers and the digital enterprise. This acquisition brings technology and an experienced team, which we believe will accelerate our technology roadmap in areas such as native integrations and system event automation triggers. Our future success is dependent on our ability to successfully develop, market, and sell existing and new products to both new and existing customers and maintain and expand our relationships with leading technology partners.
79
Table of Contents
Continuing to Invest to Grow and Scale Our Business
We are focused on driving our long-term ARR potential. We believe that our market opportunity is substantial. We intend to continue to invest significantly in scaling across all organizational functions in order to grow our operations both domestically and internationally. We have a history of introducing successful new products and capabilities on our platform, and we intend to continue to invest heavily to grow our business to take advantage of our substantial market opportunity rather than optimize for profitability or cash flow in the near future. Although these investments may adversely affect our operating results in the near term, we believe that they will contribute to our long-term growth.
Components of Results of Operations
Revenue
We derive revenue from the sale of software licenses for use of our proprietary software, maintenance and support for our licenses, right to access certain products that are hosted by us (i.e., SaaS), and other services, including professional services. We offer a comprehensive range of automation solutions via a suite of interrelated software offerings. Customers can license our software and deploy our platform on-premises, in a public or private cloud, or in a hybrid environment. In addition, we offer a managed, multi-tenant, SaaS version, which enables our customers to begin automating without the need to provision infrastructure, install applications or perform additional configurations. We also offer maintenance and support, training, and implementation services to our customers to facilitate their adoption of our platform.
In fiscal year 2021, we started offering hybrid and cloud solutions. Hybrid solutions are comprised of three performance obligations, license, maintenance and support, and right to access certain products that are hosted by us (SaaS). Revenue from license and revenue from maintenance and support are accounted for pursuant to the paragraphs below. The performance obligation under the cloud component of the hybrid solution and SaaS arrangements is a stand-ready obligation to provide access to our products. Revenue from the cloud component of the hybrid solution and SaaS arrangements is recognized on a ratable basis over the contractual period of the arrangement beginning when or as control of the promised good or services is transferred to the customer. The revenue related to the cloud component of the hybrid arrangement together with the revenue related to the cloud-based arrangements are presented as Revenue, maintenance and support in our results of operations, as such revenue was not material to total revenue for the fiscal year ended January 31, 2021.
Licenses
We sell term licenses which provide customers the right to use software for a specified period of time. From time to time, we also sell perpetual licenses that provide customers the right to use software for an indefinite period of time. For each respective type of license, revenue is recognized at the point-in-time when the customer is able to use and benefit from the software, which is generally upon delivery to the customer or upon the commencement of the renewal term.
Maintenance and Support
We generate maintenance and support revenue through technical support and the provision of unspecified updates and upgrades on a when-and-if-available basis for both term and perpetual license arrangements. Maintenance and support for perpetual licenses is renewable, generally on an annual basis, at the option of the customer. Maintenance and support represents stand-ready obligations for which revenue is recognized ratably over the term of the arrangement.
Services and Other
Services and other revenue consists of fees associated with process automation, customer education, and training services. A substantial majority of our professional service contracts are recognized on a time and materials basis and the related revenue is recognized as the service hours are rendered.
80
Table of Contents
Cost of Revenue
Licenses
Cost of licenses revenue consists of all direct costs to deliver our licenses to our customers, amortization of software development costs, direct costs related to third party software resales, and amortization of acquired developed technology.
Maintenance and Support
Cost of maintenance and support revenue primarily consists of personnel-related expenses of our customer support and technical support personnel, including salaries and bonuses, stock-based compensation expense, and employee benefit costs. Cost of maintenance and support revenue also includes third-party consulting services, hosting costs related to our hybrid and cloud-based arrangements, amortization of software development costs related to cloud products, and allocated overhead. Overhead is allocated to cost of maintenance and support revenue based on applicable headcount. We recognize these expenses as they are incurred. We expect cost of maintenance and support revenue to continue to increase in absolute dollars for the foreseeable future as our customer base grows.
Services and Other
Cost of services and other revenue primarily consists of personnel-related expenses of our professional service personnel, including salaries and bonuses, stock-based compensation expense, and employee benefit costs. Cost of services and other revenue also includes expenses related to third-party consulting services and allocated overhead. Overhead is allocated to cost of services and other revenue based on applicable headcount. We recognize these expenses as they are incurred. We expect cost of services and other revenue to continue to increase in absolute dollars for the foreseeable future as our customer base grows.
Operating Expenses
Our operating expenses consist of sales and marketing, research and development, and general and administrative expenses. Personnel-related expenses are the most significant component of operating expenses and consist of salaries and bonuses, stock-based compensation expense, and employee benefit costs. Operating expenses also include allocated overhead. During fiscal year 2021, certain operating expenses decreased, such as travel and entertainment, primarily as a result of the COVID-19 pandemic. We expect the resumption of travel and entertainment and related expenses in the second half of fiscal year 2022, although the timing and magnitude of these expenses will depend on a number of factors including the trend of the pandemic and potential lifting of stay-at-home orders.
Sales and Marketing
Sales and marketing expenses consist primarily of personnel-related expenses associated with our sales and marketing personnel and related sales support teams, including salaries and bonuses, stock-based compensation expense, and employee benefit costs, sales and partner commissions, marketing events, advertising costs, travel, trade shows, other marketing materials, and allocated overhead. In addition to travel and entertainment, trade show expenses also decreased in fiscal year 2021, related to the COVID-19 pandemic. We currently expect trade show expenses to resume in the second half of fiscal year 2022, although the timing is uncertain and related to the trend of the pandemic. We plan to increase our investment in sales and marketing over the foreseeable future as we continue to hire additional personnel and invest in sales and marketing programs. However, we expect that our sales and marketing expense will decrease as a percentage of our total revenue over the long term, although our sales and marketing expenses may fluctuate as a percentage of our total revenue from period to period due to the timing and extent of these expenses.
81
Table of Contents
Research and Development
Research and development expenses consist primarily of personnel-related expenses, including salaries and bonuses, stock-based compensation expense, and employee benefits costs for our research and development employees. Research and development costs are expensed as incurred. We expect that our research and development expense will increase in absolute dollars for the foreseeable future as we continue to invest in research and development efforts to develop new technology and enhance the functionality and capabilities of our existing products and platform infrastructure. Our research and development expenses may fluctuate as a percentage of our total revenue from period to period due to the timing and extent of these expenses.
General and Administrative
General and administrative expenses consist primarily of personnel-related expenses, including salaries and bonuses, stock-based compensation expense, and employee benefits costs associated with our finance, legal, human resources, compliance, and other administrative personnel, as well as accounting and legal professional services fees, other corporate-related expenses, and allocated overhead. Following the completion of this offering, we expect to incur additional general and administrative expenses as a result of operating as a public company. As a result, we expect the dollar amount of our general and administrative expenses to increase for the foreseeable future. However, we expect that our general and administrative expense will decrease as a percentage of our total revenue as our revenue grows over the longer term, although our general and administrative expenses may fluctuate as a percentage of our revenue from period to period due to the timing and extent of these expenses.
Interest Income
Interest income consists of interest income earned on our cash deposits, cash and cash equivalent balances, and marketable securities.
Other (Expense) Income, Net
Other (expense) income, net primarily consists of foreign exchange gains and losses, and gains and losses associated with foreign currency forward contracts.
Provision For (Benefit From) Income Taxes
Provision for (benefit from) income taxes consists of U.S. federal and state income taxes and income taxes in certain foreign jurisdictions in which we conduct business. We maintain a full valuation allowance on our U.S. federal and state deferred tax assets as we have concluded that it is more likely than not that the deferred tax assets will not be realized. Our effective tax rate is affected by tax rates in foreign jurisdictions and the relative amounts of income we earn in those jurisdictions, as well as non-deductible expenses, such as stock-based compensation, and changes in our valuation allowance.
82
Table of Contents
Results of Operations
The following tables set forth selected consolidated statement of operations data and such data as a percentage of total revenue for each of the periods indicated:
| Fiscal Year Ended January 31, | ||||||||
| 2020 | 2021 | |||||||
| (in thousands) | ||||||||
| Revenue: |
||||||||
| Licenses |
$ | 201,648 | $ | 346,035 | ||||
| Maintenance and support |
119,612 | 232,542 | ||||||
| Services and other |
14,896 | 29,066 | ||||||
|
|
|
|
|
|||||
| Total revenue |
336,156 | 607,643 | ||||||
|
|
|
|
|
|||||
| Cost of revenue: |
||||||||
| Licenses |
3,760 | 7,054 | ||||||
| Maintenance and support(1) |
16,503 | 24,215 | ||||||
| Services and other(1) |
39,142 | 34,588 | ||||||
|
|
|
|
|
|||||
| Total cost of revenue |
59,405 | 65,857 | ||||||
|
|
|
|
|
|||||
| Gross profit |
276,751 | 541,786 | ||||||
|
|
|
|
|
|||||
| Operating expenses: |
||||||||
| Sales and marketing(1) |
483,344 | 380,154 | ||||||
| Research and development(1) |
131,066 | 109,920 | ||||||
| General and administrative(1) |
179,624 | 162,035 | ||||||
|
|
|
|
|
|||||
| Total operating expenses |
794,034 | 652,109 | ||||||
|
|
|
|
|
|||||
| Operating loss |
(517,283 | ) | (110,323) | |||||
| Interest income |
6,741 | 1,152 | ||||||
| Other (expense) income, net |
(6,597 | ) | 14,513 | |||||
|
|
|
|
|
|||||
| Loss before income taxes |
(517,139 | ) | (94,658) | |||||
| Provision for (benefit from) income taxes |
2,794 | (2,265) | ||||||
|
|
|
|
|
|||||
| Net loss |
$ | (519,933 | ) | $ | (92,393) | |||
|
|
|
|
|
|||||
| (1) | Includes stock-based compensation expense as follows: |
| Fiscal Year Ended January 31, | ||||||||
| 2020 | 2021 | |||||||
| (in thousands) | ||||||||
| Cost of revenue |
$ | 2,813 | $ | 2,373 | ||||
| Sales and marketing |
26,754 | 16,356 | ||||||
| Research and development |
45,235 | 11,435 | ||||||
| General and administrative |
63,060 | 56,003 | ||||||
|
|
|
|
|
|||||
| Total stock-based compensation expense |
$ | 137,862 | $ | 86,167 | ||||
|
|
|
|
|
|||||
83
Table of Contents
The following table sets forth our consolidated statement of operations data expressed as a percentage of revenue for the period indicated:
| Fiscal Year Ended January 31, | ||||||||
| 2020 | 2021 | |||||||
| (as a percentage of revenue) | ||||||||
| Revenue: |
||||||||
| Licenses |
60 | % | 57 | % | ||||
| Maintenance and support |
36 | 38 | ||||||
| Services and other |
4 | 5 | ||||||
|
|
|
|
|
|||||
| Total revenue |
100 | 100 | ||||||
|
|
|
|
|
|||||
| Cost of revenue: |
||||||||
| Licenses |
1 | 1 | ||||||
| Maintenance and support |
5 | 4 | ||||||
| Services and other |
12 | 6 | ||||||
|
|
|
|
|
|||||
| Total cost of revenue |
18 | 11 | ||||||
|
|
|
|
|
|||||
| Gross profit |
82 | 89 | ||||||
|
|
|
|
|
|||||
| Operating expenses: |
||||||||
| Sales and marketing |
144 | 62 | ||||||
| Research and development |
39 | 18 | ||||||
| General and administrative |
53 | 27 | ||||||
|
|
|
|
|
|||||
| Total operating expenses |
236 | 107 | ||||||
|
|
|
|
|
|||||
| Operating loss |
(154 | ) | (18 | ) | ||||
| Interest income |
2 | | ||||||
| Other (expense) income, net |
(2 | ) | 2 | |||||
|
|
|
|
|
|||||
| Loss before income taxes |
(154 | ) | (16 | ) | ||||
| Provision for (benefit from) income taxes |
(1 | ) | 1 | |||||
|
|
|
|
|
|||||
| Net loss |
(155 | )% | (15 | )% | ||||
|
|
|
|
|
|||||
Comparison of the Fiscal Years Ended January 31, 2020 and 2021
Revenue
| Fiscal Year Ended January 31, | ||||||||||||||||
| 2020 | 2021 | Change | % Change | |||||||||||||
| (dollars in thousands) | ||||||||||||||||
| Licenses |
$ | 201,648 | $ | 346,035 | $ | 144,387 | 72 | % | ||||||||
| Maintenance and support |
119,612 | 232,542 | 112,930 | 94 | ||||||||||||
| Services and other |
14,896 | 29,066 | 14,170 | 95 | ||||||||||||
|
|
|
|
|
|
|
|
|
|||||||||
| Total revenue |
$ | 336,156 | $ | 607,643 | $ | 271,487 | 81 | % | ||||||||
|
|
|
|
|
|
|
|
|
|||||||||
Total revenue increased by $271.5 million, or 81%, for the fiscal year ended January 31, 2021 compared to the fiscal year ended January 31, 2020, primarily due to an increase in our licenses revenue of $144.4 million, an increase in our maintenance and support revenue of $112.9 million and an increase in services and other revenues of $14.2 million. Approximately 75% of the increase in revenue was attributable to growth from existing customers, and the remaining increase in revenue was attributable to new customers. As we continued to expand our sales efforts in the United States and internationally, our increase in total revenue was consistent across all regions.
84
Table of Contents
Cost of Revenue and Gross Margin
| Fiscal Year Ended January 31, | ||||||||||||||||
| 2020 | 2021 | Change | % Change | |||||||||||||
| (dollars in thousands) | ||||||||||||||||
| Licenses |
$ | 3,760 | $ | 7,054 | $ | 3,294 | 88 | % | ||||||||
| Maintenance and support |
16,503 | 24,215 | 7,712 | 47 | ||||||||||||
| Services and other |
39,142 | 34,588 | (4,554 | ) | (12 | ) | ||||||||||
|
|
|
|
|
|
|
|
|
|||||||||
| Total cost of revenue |
$ | 59,405 | $ | 65,857 | $ | 6,452 | 11 | % | ||||||||
|
|
|
|
|
|
|
|
|
|||||||||
| Gross margin |
82 | % | 89 | % | ||||||||||||
Total cost of revenue increased by $6.5 million, or 11%, for the fiscal year ended January 31, 2021 compared to the fiscal year ended January 31, 2020. Cost of licenses revenue increased primarily due to an increase in amortization of acquired developed technology and capitalized software expenses of $2.8 million. Cost of maintenance and support revenue increased primarily due to increases of $6.4 million in personnel-related expenses, mainly driven by increased headcount, and $3.0 million in hosting costs and professional services, which were partially offset by a decrease of $1.3 million in travel-related expenses due to COVID-19 travel restrictions. Cost of services and other revenue decreased primarily due to a decrease of $4.8 million in personnel-related expenses as a result of our fiscal year 2020 workforce restructuring plan, and a decrease of $3.5 million in travel-related expenses due to COVID-19 travel restrictions. These decreases were partially offset by an increase of $4.2 million in external consulting fees during the fiscal year 2021. See Note 11 to our consolidated financial statements included elsewhere in this prospectus for more information regarding the workforce restructuring plan.
Our gross margin increased to 89% for the fiscal year ended January 31, 2021 compared to 82% for the fiscal year ended January 31, 2020, primarily as a result of higher revenue recognized period-over-period from increased adoption of our software offerings, as evidenced by the percentage of revenue attributable to growth of revenue from existing customers discussed above.
Operating Expenses
Sales and Marketing
| Fiscal Year Ended January 31, | ||||||||||||||||
| 2020 | 2021 | Change | % Change | |||||||||||||
| (dollars in thousands) | ||||||||||||||||
| Sales and marketing |
$ | 483,344 | $ | 380,154 | $ | (103,190 | ) | (21 | )% | |||||||
| Percentage of revenue |
144 | % | 62 | % | ||||||||||||
Sales and marketing expense decreased by $103.2 million, or 21%, for the fiscal year ended January 31, 2021 compared to the fiscal year ended January 31, 2020. The decrease was primarily attributable to decreases of $43.9 million in travel-related expenses associated with the reduction of travel and lodging costs, sales events or trade shows and other sales conferences, $43.0 million in personnel-related expenses as a result of our fiscal year 2020 workforce restructuring plan, which includes a $10.4 million decrease in stock-based compensation expenses primarily as a result of our fiscal year 2020 tender offer transactions, $15.1 million in marketing-related expenses, $5.8 million in rent expenses, and $3.0 million in recruitment expenses. These decreases were partially offset by an increase of $10.0 million in sales commissions driven by our improved revenue attainment. See Notes 11 and 12 to our consolidated financial statements included elsewhere in this prospectus for more information regarding the workforce restructuring plan and the fiscal year 2020 tender offer transactions, respectively.
85
Table of Contents
Research and Development
| Fiscal Year Ended January 31, | ||||||||||||||||
| 2020 | 2021 | Change | % Change | |||||||||||||
| (dollars in thousands) | ||||||||||||||||
| Research and development |
$ | 131,066 | $ | 109,920 | $ | (21,146 | ) | (16 | )% | |||||||
| Percentage of revenue |
39 | % | 18 | % | ||||||||||||
Research and development expense decreased by $21.1 million, or 16%, for the fiscal year ended January 31, 2021 compared to the fiscal year ended January 31, 2020. The decrease was primarily attributable to decreases of $14.4 million in personnel-related expenses, and $6.0 million in travel-related expenses due to COVID-19 travel restrictions. The net decrease in personnel-related expenses was a result of a decrease of $33.8 million in stock-based compensation expenses primarily as a result of our fiscal year 2020 tender offer transactions and common stock repurchases from certain employees, partially offset by an increase of $19.4 million in salaries, bonuses and employee benefit costs. See Note 12 to our consolidated financial statements included elsewhere in this prospectus for more information regarding the fiscal year 2020 tender offer transactions and common stock repurchases.
General and Administrative
| Fiscal Year Ended January 31, | ||||||||||||||||
| 2020 | 2021 | Change | % Change | |||||||||||||
| (dollars in thousands) | ||||||||||||||||
| General and administrative |
$ | 179,624 | $ | 162,035 | $ | (17,589 | ) | (10 | )% | |||||||
| Percentage of revenue |
53 | % | 27 | % | ||||||||||||
General and administrative expense decreased by $17.6 million, or 10%, for the fiscal year ended January 31, 2021 compared to the fiscal year ended January 31, 2020. This decrease was primarily attributable to decreases of $11.7 million in personnel-related expenses as a result of our fiscal year 2020 workforce restructuring plan, which includes a $7.1 million decrease in stock-based compensation expenses as a result of our fiscal year 2020 tender offer transactions and common stock repurchases from certain employees, as well as $6.5 million in travel-related expenses due to COVID-19 travel restrictions, $1.8 million in hosted business applications and professional services, $1.4 million in costs for corporate-related conferences due to COVID-19 travel restrictions, $1.1 million in depreciation and amortization and $1.0 million in recruitment expenses. These decreases were partially offset by increases of $2.5 million in rent expenses, $1.4 million in other indirect taxes and $1.3 million in bad debt expenses. See Notes 11 and 12 to our consolidated financial statements included elsewhere in this prospectus for more information regarding the workforce restructuring plan and the fiscal year 2020 tender offer transactions and common stock repurchases, respectively.
Interest Income
| Fiscal Year Ended January 31, | ||||||||||||||||
| 2020 | 2021 | Change | % Change | |||||||||||||
| (dollars in thousands) | ||||||||||||||||
| Interest income |
$ | 6,741 | $ | 1,152 | $ | (5,589 | ) | (83 | )% | |||||||
| Percentage of revenue |
2 | % | 0 | % | ||||||||||||
Interest income decreased by $5.6 million, or 83%, for the fiscal year ended January 31, 2021 compared to the fiscal year ended January 31, 2020. This decrease was primarily attributable to decreases in global interest rates during the fiscal year ended January 31, 2021 compared to the fiscal year ended January 31, 2020.
86
Table of Contents
Other (Expense) Income, Net
| Fiscal Year Ended January 31, | ||||||||||||||||
| 2020 | 2021 | Change | % Change | |||||||||||||
| (dollars in thousands) | ||||||||||||||||
| Other (expense) income, net |
$ | (6,597 | ) | $ | 14,513 | $ | 21,110 | * | ||||||||
| Percentage of revenue |
(2 | )% | 2 | % | ||||||||||||
| * | Percentage not meaningful. |
Other (expense) income, net increased by $21.1 million, or 320%, for the fiscal year ended January 31, 2021 compared to the fiscal year ended January 31, 2020. The increase was primarily attributable to foreign exchange gains recognized period-over-period, which were offset by losses associated with foreign currency forward contracts and an increase in interest expense.
Provision For (Benefit From) Income Taxes
| Fiscal Year Ended January 31, | ||||||||||||||||
| 2020 | 2021 | Change | % Change | |||||||||||||
| (dollars in thousands) | ||||||||||||||||
| Provision for (benefit from) income taxes |
$ | 2,794 | $ | (2,265) | $ | (5,059) | * | |||||||||
| Percentage of revenue |
1 | % | (1) | % | ||||||||||||
| * | Percentage not meaningful. |
Provision for (benefit from) income taxes decreased by $5.1 million, or 181%, for the fiscal year ended January 31, 2021 compared to the fiscal year ended January 31, 2020. The effective tax rate was (0.6)% and 2.4% for the fiscal years ended January 31, 2020 and January 31, 2021, respectively. The change was primarily driven by the release of the valuation allowance for the Japan deferred tax assets.
Quarterly Results of Operations
The following tables set forth our unaudited quarterly consolidated statements of operations data for each of the quarters indicated, as well as the percentage that each line item represents of our total revenue for each quarter presented. The information for each quarter has been prepared on a basis consistent with our audited consolidated financial statements included in this prospectus, and reflect, in the opinion of management, all adjustments of a normal, recurring nature that are necessary for a fair statement of the financial information contained in those financial statements. Our historical results are not necessarily indicative of the results that may be expected in the future. The following quarterly financial data should be read in conjunction with our audited consolidated financial statements included elsewhere in this prospectus.
87
Table of Contents
| Three Months Ended | ||||||||||||||||||||||||||||||||
| April 30, 2019 |
July 31, 2019 |
October 31, 2019 |
January 31, 2020 |
April 30, 2020 |
July 31, 2020 |
October 31, 2020 |
January 31, 2021 |
|||||||||||||||||||||||||
| (in thousands) | ||||||||||||||||||||||||||||||||
| Revenue: |
||||||||||||||||||||||||||||||||
| Licenses |
$ | 36,155 | $ | 47,353 | $ | 46,241 | $ | 71,899 | $ | 63,759 | $ | 79,513 | $ | 78,555 | $ | 124,208 | ||||||||||||||||
| Maintenance and support |
21,986 | 27,118 | 32,024 | 38,484 | 43,196 | 51,932 | 61,508 | 75,906 | ||||||||||||||||||||||||
| Services and other |
2,188 | 2,619 | 5,643 | 4,446 | 6,148 | 7,931 | 7,226 | 7,761 | ||||||||||||||||||||||||
|
|
|
|
|
|
|
|
|
|
|
|
|
|
|
|
|
|||||||||||||||||
| Total revenue |
60,329 | 77,090 | 83,908 | 114,829 | 113,103 | 139,376 | 147,289 | 207,875 | ||||||||||||||||||||||||
| Cost of revenue: |
||||||||||||||||||||||||||||||||
| Licenses |
510 | 583 | 705 | 1,962 | 1,417 | 1,636 | 1,720 | 2,281 | ||||||||||||||||||||||||
| Maintenance and support(1) |
2,448 | 5,075 | 6,620 | 2,360 | 5,543 | 5,501 | 6,092 | 7,079 | ||||||||||||||||||||||||
| Services and other(1) |
15,130 | 8,285 | 7,274 | 8,453 | 6,678 | 7,561 | 9,573 | 10,776 | ||||||||||||||||||||||||
|
|
|
|
|
|
|
|
|
|
|
|
|
|
|
|
|
|||||||||||||||||
| Total cost of revenue |
18,088 | 13,943 | 14,599 | 12,775 | 13,638 | 14,698 | 17,385 | 20,136 | ||||||||||||||||||||||||
|
|
|
|
|
|
|
|
|
|
|
|
|
|
|
|
|
|||||||||||||||||
| Gross profit |
42,241 | 63,147 | 69,309 | 102,054 | 99,465 | 124,678 | 129,904 | 187,739 | ||||||||||||||||||||||||
|
|
|
|
|
|
|
|
|
|
|
|
|
|
|
|
|
|||||||||||||||||
| Operating expenses: |
||||||||||||||||||||||||||||||||
| Sales and marketing(1) |
94,039 | 131,123 | 139,408 | 118,774 | 90,931 | 90,331 | 99,512 | 99,380 | ||||||||||||||||||||||||
| Research and development(1) |
48,178 | 32,309 | 26,272 | 24,307 | 26,729 | 26,541 | 27,456 | 29,194 | ||||||||||||||||||||||||
| General and administrative(1) |
56,818 | 49,750 | 38,097 | 34,959 | 26,676 | 24,834 | 65,951 | 44,574 | ||||||||||||||||||||||||
|
|
|
|
|
|
|
|
|
|
|
|
|
|
|
|
|
|||||||||||||||||
| Total operating expenses |
199,035 | 213,182 | 203,777 | 178,040 | 144,336 | 141,706 | 192,919 | 173,148 | ||||||||||||||||||||||||
|
|
|
|
|
|
|
|
|
|
|
|
|
|
|
|
|
|||||||||||||||||
| Operating (loss) income |
(156,794) | (150,035) | (134,468) | (75,986) | (44,871) | (17,028) | (63,015) | 14,591 | ||||||||||||||||||||||||
| Interest income |
634 | 2,608 | 2,281 | 1,218 | 530 | 77 | 144 | 401 | ||||||||||||||||||||||||
| Other (expense) income, net |
(2,054) | (2,862) | (247) | (1,434) | (7,837) | 24,010 | (6,303) | 4,643 | ||||||||||||||||||||||||
| (Loss) income before income taxes |
(158,214) | (150,289) | (132,434) | (76,202) | (52,178) | 7,059 | (69,174) | 19,635 | ||||||||||||||||||||||||
| (Benefit from) provision for income taxes |
(442) | 742 | 602 | 1,892 | 662 | 2,072 | 1,622 | (6,621) | ||||||||||||||||||||||||
|
|
|
|
|
|
|
|
|
|
|
|
|
|
|
|
|
|||||||||||||||||
| Net (loss) income |
$ | (157,772) | $ | (151,031) | $ | (133,036) | $ | (78,094) | $ | (52,840) | $ | 4,987 | $ | (70,796) | $ | 26,256 | ||||||||||||||||
|
|
|
|
|
|
|
|
|
|
|
|
|
|
|
|
|
|||||||||||||||||
| (1) | Includes stock-based compensation expense as follows: |
| Three Months Ended | ||||||||||||||||||||||||||||||||
| April 30, 2019 |
July 31, 2019 |
October 31, 2019 |
January 31, 2020 |
April 30, 2020 |
July 31, 2020 |
October 31, 2020 |
January 31, 2021 |
|||||||||||||||||||||||||
| (in thousands) | ||||||||||||||||||||||||||||||||
| Cost of revenue |
$ | 324 | $ | 1,387 | $ | 740 | $ | 362 | $ | 383 | $ | 640 | $ | 665 | $ | 685 | ||||||||||||||||
| Sales and marketing |
2,133 | 15,464 | 6,465 | 2,692 | 1,853 | 3,775 | 5,116 | 5,612 | ||||||||||||||||||||||||
| Research and development |
31,547 | 8,908 | 3,271 | 1,509 | 1,816 | 2,811 | 3,169 | 3,639 | ||||||||||||||||||||||||
| General and administrative |
34,827 | 23,753 | 2,767 | 1,713 | 4,149 | 1,603 | 39,814 | 10,437 | ||||||||||||||||||||||||
|
|
|
|
|
|
|
|
|
|
|
|
|
|
|
|
|
|||||||||||||||||
| Total stock-based compensation expense |
$ | 68,831 | $ | 49,512 | $ | 13,243 | $ | 6,276 | $ | 8,201 | $ | 8,829 | $ | 48,764 | $ | 20,373 | ||||||||||||||||
|
|
|
|
|
|
|
|
|
|
|
|
|
|
|
|
|
|||||||||||||||||
88
Table of Contents
| Three Months Ended | ||||||||||||||||||||||||||||||||
| April 30, 2019 |
July 31, 2019 |
October 31, 2019 |
January 31, 2020 |
April 30, 2020 |
July 31, 2020 |
October 31, 2020 |
January 31, 2021 |
|||||||||||||||||||||||||
| (as a percentage of revenue) | ||||||||||||||||||||||||||||||||
| Revenue: |
||||||||||||||||||||||||||||||||
| Licenses |
60% | 62% | 55% | 63% | 56% | 57% | 53% | 60% | ||||||||||||||||||||||||
| Maintenance and support |
36 | 35 | 38 | 33 | 38 | 37 | 42 | 37 | ||||||||||||||||||||||||
| Services and other |
4 | 3 | 7 | 4 | 6 | 6 | 5 | 3 | ||||||||||||||||||||||||
|
|
|
|
|
|
|
|
|
|
|
|
|
|
|
|
|
|||||||||||||||||
| Total revenue |
100 | 100 | 100 | 100 | 100 | 100 | 100 | 100 | ||||||||||||||||||||||||
| Cost of revenue: |
||||||||||||||||||||||||||||||||
| Licenses |
1 | 1 | 1 | 2 | 1 | 1 | 1 | 1 | ||||||||||||||||||||||||
| Maintenance and support |
4 | 6 | 8 | 2 | 5 | 4 | 4 | 4 | ||||||||||||||||||||||||
| Services and other |
25 | 11 | 8 | 7 | 6 | 6 | 7 | 5 | ||||||||||||||||||||||||
|
|
|
|
|
|
|
|
|
|
|
|
|
|
|
|
|
|||||||||||||||||
| Total cost of revenue |
30 | 18 | 17 | 11 | 12 | 11 | 12 | 10 | ||||||||||||||||||||||||
|
|
|
|
|
|
|
|
|
|
|
|
|
|
|
|
|
|||||||||||||||||
| Gross profit |
70 | 82 | 83 | 89 | 88 | 89 | 88 | 90 | ||||||||||||||||||||||||
|
|
|
|
|
|
|
|
|
|
|
|
|
|
|
|
|
|||||||||||||||||
| Operating expenses: |
||||||||||||||||||||||||||||||||
| Sales and marketing |
156 | 170 | 166 | 103 | 80 | 64 | 67 | 48 | ||||||||||||||||||||||||
| Research and development |
80 | 42 | 31 | 21 | 24 | 19 | 19 | 14 | ||||||||||||||||||||||||
| General and administrative |
94 | 65 | 46 | 31 | 24 | 18 | 45 | 21 | ||||||||||||||||||||||||
|
|
|
|
|
|
|
|
|
|
|
|
|
|
|
|
|
|||||||||||||||||
| Total operating expenses |
330 | 277 | 243 | 155 | 128 | 101 | 131 | 83 | ||||||||||||||||||||||||
|
|
|
|
|
|
|
|
|
|
|
|
|
|
|
|
|
|||||||||||||||||
| Operating (loss) income |
(260) | (195) | (160) | (66) | (40) | (12) | (43) | 7 | ||||||||||||||||||||||||
| Interest Income |
1 | 4 | 3 | 1 | 1 | 0 | 0 | 0 | ||||||||||||||||||||||||
| Other (expense) income, net |
(3) | (4) | (1) | (1) | (7) | 17 | (4) | 2 | ||||||||||||||||||||||||
|
|
|
|
|
|
|
|
|
|
|
|
|
|
|
|
|
|||||||||||||||||
| (Loss) income before income taxes |
(262) | (195) | (158) | (66) | (46) | 5 | (47) | 9 | ||||||||||||||||||||||||
| (Benefit from) provision for income taxes |
0 | 1 | 1 | 2 | 1 | 1 | 1 | (4) | ||||||||||||||||||||||||
|
|
|
|
|
|
|
|
|
|
|
|
|
|
|
|
|
|||||||||||||||||
| Net (loss) income |
(262)% | (196)% | (159)% | (68)% | (47)% | 4% | (48)% | 13% | ||||||||||||||||||||||||
|
|
|
|
|
|
|
|
|
|
|
|
|
|
|
|
|
|||||||||||||||||
89
Table of Contents
Quarterly Revenue Trends
Our quarterly total revenue increased sequentially in each of the periods presented, other than during the first quarter of fiscal year 2021, due to the growth from our existing customers and increases in revenues from new customers in each period. Revenue trends are impacted to a degree by seasonality in our sales cycle. Historically, a pattern of increased license sales in the fourth quarter as a result of industry buying patterns has positively impacted sales activity in that period, which can result in lower sequential revenue in the first fiscal quarter, as shown during the first quarter of fiscal year 2021. We expect this seasonality to continue in fiscal year 2022 and beyond.
The general increase in services and other revenue in each of the periods presented was a result of an increase in process automation, customer education, and training services due to increased adoption of our offerings.
Quarterly Cost of Revenue and Gross Margin Trends
Our quarterly total cost of revenue increased sequentially in each of the periods presented, other than during the second and fourth quarters of fiscal year 2020, primarily due to the increase in personnel-related expenses as we continue to grow our customer support, technical support and professional service personnel teams. The variance in cost of services and other revenue during the first quarter of fiscal year 2021 was due to internal reorganization of the customer success team that shifted their objectives from customer and product support to sales related activities. The timing of revenues in relation to our expenses, much of which does not vary directly with revenues, has an impact on the total cost of revenue as a percentage of total revenue, or our gross margin, in each fiscal quarter during the year. As a result, we have not experienced significant seasonal fluctuations in the timing of our cost of revenue from period to period. Although these seasonal factors are common in the technology industry, historical patterns should not be considered a reliable indicator of our future sales activity or performance. We expect our revenue from cloud-based arrangements to increase as a percentage of total revenue, which may adversely impact our gross margin as a result of the associated cloud-related costs, such as hosting costs.
Quarterly Operating Expenses Trends
Excluding the impacts of repurchases of Class A and B common stock from certain of our employees during the first quarter of fiscal year 2020, tender offers made by certain investors to purchase Class A common stock from certain of our employees during the second quarter of fiscal year 2020, workforce restructuring charges incurred during the third quarter of fiscal year 2020 and secondary sales and transfers of Class A and B common stock executed by certain of our employees during the fourth quarter of fiscal year 2021, our quarterly total operating expenses generally increased sequentially in each of the periods presented, primarily due to increases in headcount and other associated personnel-related expenses, stock-based compensation, infrastructure and other related costs to support our growth.
During fiscal year 2021, certain operating expenses decreased as compared to fiscal year 2020 mainly as a result of reduced expenses related to our facilities, travel and marketing, primarily as a result of stay-at-home or similar orders in effect due to the COVID-19 pandemic. We intend to continue to make significant investments in research and development as we add functionality and capabilities to our existing products and platform infrastructure. We also intend to invest in our sales and marketing organization to drive future revenue growth. Lastly, we expect to incur additional general and administrative expenses as a result of operating as a public company.
Non-GAAP Financial Measures
We report our financial results in accordance with GAAP. However, management believes that certain non-GAAP financial measures provide investors with additional useful information in evaluating our performance. Therefore, to supplement our consolidated financial statements, we provide investors with certain non-GAAP
90
Table of Contents
financial measures, including non-GAAP free cash flow, non-GAAP gross profit and margin, and non-GAAP operating loss and margin. Nevertheless, our use of non-GAAP free cash flow, non-GAAP gross profit and margin, and non-GAAP operating loss and margin has limitations as an analytical tool, and you should not consider it in isolation or as a substitute for analysis of our financial results as reported under GAAP. Further, our definitions of non-GAAP free cash flow, non-GAAP gross profit and margin, and non-GAAP operating loss and margin may differ from the definitions used by other companies and therefore comparability may be limited. You should consider non-GAAP free cash flow, non-GAAP gross profit and margin, and non-GAAP operating loss and margin alongside our GAAP-based financial performance measures, such as net cash (used in) provided by operating activities, gross profit, and operating loss, respectively, and our other GAAP financial results.
Non-GAAP Free Cash Flow
Free cash flow represents net cash (used in) provided by operating activities, increased by capital expenditures and capitalized software development costs, if any. Free cash flow is a measure used by management to understand and evaluate our liquidity and to generate future operating plans. The inclusion of capital expenditures and amounts capitalized for software development facilitates comparisons of our liquidity on a period-to-period basis and excludes items that we do not consider to be indicative of our liquidity. Management believes that free cash flow is a measure of liquidity that provides useful information to our management, investors, and others in understanding and evaluating the strength of our liquidity and future ability to generate cash that can be used for strategic opportunities or investing in our business.
The following table presents a reconciliation of free cash flow to net cash (used in) provided by operating activities, the most directly comparable GAAP measure, for each of the periods indicated:
| Fiscal Year Ended January 31, | ||||||||
| 2020 | 2021 | |||||||
| (in thousands) | ||||||||
| Net cash (used in) provided by operating activities |
$ | (359,436 | ) | $ | 29,177 | |||
| Add: purchases of property and equipment |
(15,748 | ) | (1,953 | ) | ||||
| Add: capitalized software development costs |
(5,233 | ) | (1,240 | ) | ||||
|
|
|
|
|
|||||
| Free cash flow |
$ | (380,417 | ) | $ | 25,984 | |||
|
|
|
|
|
|||||
| Net cash used in investing activities |
$ | (39,506 | ) | $ | (125,991 | ) | ||
| Net cash provided by financing activities |
$ | 457,765 | $ | 250,418 | ||||
Non-GAAP Gross Profit and Non-GAAP Gross Margin
We define non-GAAP gross profit and non-GAAP gross margin as GAAP gross profit and GAAP gross margin, respectively, excluding stock-based compensation expense and amortization of acquired intangible assets. We believe non-GAAP gross profit and non-GAAP gross margin provide our management and investors consistency and comparability with our past financial performance and facilitate period-to-period comparisons of operations, as these metrics generally eliminate the effects of certain variables from period to period for reasons unrelated to overall operating performance.
The following table presents a reconciliation of our non-GAAP gross profit to our GAAP gross profit and our non-GAAP gross margin to our GAAP gross margin for each of the periods presented:
91
Table of Contents
| Fiscal Year Ended January 31, | ||||||||
| 2020 | 2021 | |||||||
| (dollars in thousands) | ||||||||
| Total revenue |
$ | 336,156 | $ | 607,643 | ||||
| Total cost of revenue |
59,405 | 65,857 | ||||||
|
|
|
|
|
|||||
| Gross profit |
276,751 | 541,786 | ||||||
|
|
|
|
|
|||||
| Add: stock-based compensation expenses |
2,813 | 2,373 | ||||||
| Add: amortization of acquired developed technology |
669 | 2,493 | ||||||
|
|
|
|
|
|||||
| Non-GAAP gross profit |
$ | 280,233 | $ | 546,652 | ||||
|
|
|
|
|
|||||
| Gross margin |
82 | % | 89 | % | ||||
|
|
|
|
|
|||||
| Non-GAAP gross margin |
83 | % | 90 | % | ||||
|
|
|
|
|
|||||
Non-GAAP Operating Loss and Non-GAAP Operating Margin
We define non-GAAP operating loss and non-GAAP operating margin as GAAP operating loss and GAAP operating margin, respectively, excluding stock-based compensation expense and amortization of acquired intangible assets. We believe non-GAAP operating loss and non-GAAP operating margin provide our management and investors consistency and comparability with our past financial performance and facilitate period-to-period comparisons of operations, as these metrics generally eliminate the effects of certain variables unrelated to our overall operating performance.
The following table presents a reconciliation of our non-GAAP operating loss to our GAAP operating loss and our non-GAAP operating margin to our GAAP operating margin for each of the periods presented:
| Fiscal Year Ended January 31, | ||||||||
| 2020 | 2021 | |||||||
| (dollars in thousands) | ||||||||
| Total revenue |
$ | 336,156 | $ | 607,643 | ||||
| Operating loss |
(517,283 | ) | (110,323 | ) | ||||
| Add: stock-based compensation expenses |
137,862 | 86,167 | ||||||
| Add: amortization of acquired intangible assets |
700 | 2,608 | ||||||
|
|
|
|
|
|||||
| Non-GAAP operating loss |
$ | (378,721 | ) | $ | (21,548 | ) | ||
|
|
|
|
|
|||||
| Operating margin |
(154 | )% | (18 | )% | ||||
|
|
|
|
|
|||||
| Non-GAAP operating margin |
(113 | )% | (4 | )% | ||||
|
|
|
|
|
|||||
Liquidity and Capital Resources
We have financed operations since our inception primarily through customer payments and net proceeds from sales of equity securities. Our principal uses of cash in recent periods have been funding our operations, investing in capital expenditures, and engaging in various business acquisitions. As of January 31, 2020 and 2021, our principal sources of liquidity were cash, cash equivalents, restricted cash, and marketable securities totaling $234.1 million and $474.0 million, respectively, and we had an accumulated deficit of $878.0 million and $970.4 million, respectively. During the fiscal years ended January 31, 2020 and 2021, we had a net loss of $519.9 million and $92.4 million, respectively, and net cash (used in) provided by operations of $(359.4) million and $29.2 million, respectively. In July 2020, we completed our Series E preferred stock financing with gross proceeds totaling $225.9 million and, subsequent to January 31, 2021, we completed our Series F preferred stock financing with gross proceeds totaling $750.0 million. We have also entered into the Credit Facility (as defined below) with an available borrowing capacity of $200.0 million. We believe our existing cash, cash equivalents, restricted cash, marketable securities, proceeds from our sales of equity securities, and borrowing capacity will be sufficient to fund anticipated cash requirements for the next twelve months.
92
Table of Contents
Our future capital requirements will depend on many factors, including our revenue growth rate, our product sales, license renewal activity, including the timing and the amount of cash received from customers, the expansion of sales and marketing activities, the timing and extent of spending to support development efforts, the introduction of new and enhanced products, the continuing market adoption of our products, expenses associated with our international expansion, and the timing and extent of additional capital expenditures to invest in existing and new office spaces. We may, in the future, enter into arrangements to acquire or invest in complementary businesses, products, and technologies. We may be required to seek additional equity or debt financing. In the event that we require additional financing, we may not be able to raise such financing on terms acceptable to us or at all. If we are unable to raise additional capital or generate cash flows necessary to expand our operations and invest in continued innovation, we may not be able to compete successfully, which would harm our business, operations and financial condition.
Credit Facilities
In January 2020, we entered into an Amended and Restated Loan and Security Agreement, or the Credit Agreement, with HSBC Bank USA, N.A, HSBC Ventures USA Inc., and Silicon Valley Bank, which provided a $100.0 million senior secured revolving credit facility. We repaid the Credit Agreement in full in July 2020. In October 2020, we entered into a new Senior Secured Credit Facility, or the Credit Facility, with HSBC Ventures USA Inc., Silicon Valley Bank, Sumitomo Mitsui Banking Corporation, and Mizuho Bank, LTD, which provided a $200.0 million senior secured revolving credit facility with a maturity date of October 30, 2023. Our obligations under the Credit Facility are secured by substantially all of our assets, except for our intellectual property. The Credit Facility contains certain customary covenants, including, but not limited to, those relating to additional indebtedness, liens, asset divestitures, and affiliate transactions. We may use the proceeds of future borrowings under the Credit Facility for refinancing other indebtedness, working capital, capital expenditures and other general corporate purposes, including permitted business acquisitions.
Borrowings under the Credit Facility bear interest at a base rate, as defined in the Credit Facility, plus a margin of 2.0% or 3.0% depending on the base rate. The Credit Facility is subject to customary fees for loan facilities of this type, including ongoing commitment fees at a rate of 0.25% per annum on the daily amount available to be drawn. As of January 31, 2021, we had no outstanding debt under the Credit Agreement and we were in compliance with our covenants thereunder. We are currently in compliance with our covenants under the Credit Facility.
Cash Flows
The following table shows a summary of our cash flows for the period presented:
| Fiscal Year Ended January 31, |
||||||||
| 2020 | 2021 | |||||||
| (in thousands) | ||||||||
| Net cash (used in) provided by operating activities |
$ | (359,436 | ) | $ | 29,177 | |||
| Net cash used in investing activities |
(39,506 | ) | (125,991 | ) | ||||
| Net cash provided by financing activities |
457,765 | 250,418 | ||||||
Operating Activities
Our largest source of operating cash is cash generation from sales to our customers. Our primary uses of cash from operating activities are for personnel-related expenses, direct costs to deliver our licenses, and marketing expenses. We have historically generated negative cash flows and have supplemented working capital requirements primarily through net proceeds from the sale of equity securities.
93
Table of Contents
Net cash used in operating activities for the fiscal year ended January 31, 2020 of $359.4 million was primarily related to our net loss of $519.9 million, adjusted for non-cash charges of $184.6 million and net cash outflows of $24.1 million provided by changes in our operating assets and liabilities. Non-cash charges primarily consisted of stock-based compensation of $137.9 million, amortization of deferred contract acquisition costs of $30.5 million, depreciation and amortization of $8.7 million, and non-cash operating lease costs of $7.0 million. The main drivers of the cash outflows were derived from the changes in operating assets and liabilities and were related to additions to deferred contract acquisition costs of $61.0 million, an increase to accounts receivable of $52.1 million due to timing of collections, an increase in prepaid expenses and other assets of $20.6 million, a decrease in accounts payable of $14.6 million, an increase in contract assets of $5.1 million, and a decrease in operating lease liabilities of $5.1 million, partially offset by an increase of deferred revenue of $97.9 million due to an increase in sales, an increase in accrued expenses and other liabilities of $18.8 million, and an increase in accrued compensation and benefits of $17.7 million.
Net cash provided by operating activities for the fiscal year ended January 31, 2021 of $29.2 million was primarily related to non-cash charges of $131.2 million, adjusted for our net loss of $92.4 million and net cash outflows of $9.6 million provided by changes in our operating assets and liabilities. Non-cash charges primarily consisted of stock-based compensation of $86.2 million, amortization of deferred contract acquisition costs of $41.0 million, depreciation and amortization of $12.3 million, reversal of deferred contract acquisition cost and accrued sales commissions of $9.2 million, deferred income taxes of $7.6 million, and non-cash operating lease costs of $7.3 million. The drivers of the cash outflows were derived from the changes in operating assets and liabilities and were related to an increase to accounts receivable of $76.9 million, additions to deferred contract acquisition costs of $51.0 million, an increase in contract assets of $22.0 million, an increase in prepaid expenses and other assets of $8.6 million, and a decrease in operating lease liabilities of $8.1 million, partially offset by an increase in deferred revenue of $99.0 million, an increase in accrued compensation and benefits of $50.0 million, an increase in accrued expenses and other liabilities of $6.1 million, and an increase in accounts payable of $1.9 million.
Investing Activities
Net cash used in investing activities for the fiscal year ended January 31, 2020 of $39.5 million was related to net cash paid for business combination of $18.5 million, capital expenditures of $15.7 million, and cash paid related to capitalized software development costs of $5.2 million.
Net cash used in investing activities for the fiscal year ended January 31, 2021 of $126.0 million was related to purchases of marketable securities of $103.1 million, payments related to prior year business acquisitions of $19.7 million, capital expenditures of $2.0 million, and cash paid related to capitalized software development costs of $1.2 million.
Financing Activities
Net cash provided by financing activities for the fiscal year ended January 31, 2020 of $457.8 million was related to net proceeds from our convertible preferred stock financing, net of issuance costs, of $583.0 million and proceeds from exercises of stock options of $3.6 million, partially offset by payments related to repurchases of our common stock of $128.8 million.
Net cash provided by financing activities for the fiscal year ended January 31, 2021 of $250.4 million was primarily related to net proceeds from our Series E convertible preferred stock financing, net of issuance costs, of $225.6 million and proceeds from exercises of stock options of $26.4 million.
94
Table of Contents
Contractual Obligations and Commitments
The following table summarizes our contractual obligations as of January 31, 2021:
| Payments Due by Period | ||||||||||||||||||||
| Total | Less Than 1 Year |
1-3 Years | 3-5 Years | More Than 5 Years |
||||||||||||||||
| (in thousands) | ||||||||||||||||||||
| Operating lease commitments |
$ | 23,359 | $ | 7,280 | $ | 11,595 | $ | 2,477 | $ | 2,007 | ||||||||||
| Purchase commitments |
25,278 | 9,542 | 15,306 | 430 | | |||||||||||||||
|
|
|
|
|
|
|
|
|
|
|
|||||||||||
| Total contractual obligations |
$ | 48,637 | $ | 16,822 | $ | 26,901 | $ | 2,907 | $ | 2,007 | ||||||||||
|
|
|
|
|
|
|
|
|
|
|
|||||||||||
The contractual commitment amounts in the table above are associated with agreements that are enforceable and legally binding. Obligations under contracts that we can cancel without a significant penalty are not included in the table above. For additional discussion on our operating leases and other commitments, see the sections titled Operating Leases and Commitments and Contingencies in Notes 8 and 11, respectively, to our consolidated financial statements included elsewhere in this prospectus for more information.
Off-Balance Sheet Arrangements
We did not have during the period presented, and we do not currently have, any off-balance sheet financing arrangements or any relationships with unconsolidated entities or financial partnerships, including entities sometimes referred to as structured finance or special purpose entities, that were established for the purpose of facilitating off-balance sheet arrangements or other contractually narrow or limited purposes.
Quantitative and Qualitative Disclosures about Market Risk
We are exposed to market risk in the ordinary course of our business. Market risk represents the risk of loss that may impact our financial position due to adverse changes in financial market prices and rates. Our market risk exposure is principally the result of fluctuations in interest rates and foreign currency exchange rates.
Interest Rate Risk
As of January 31, 2020 and 2021, we had $232.4 million and $357.7 million of cash and cash equivalents, respectively. Cash and cash equivalents consist of cash in banks, bank deposits, money market accounts, commercial paper and corporate bonds with maturity dates of less than 3 months at the purchase date. We also had $1.7 million and $13.5 million of restricted cash as of January 31, 2020 and 2021, respectively, representing cash on deposit for forward agreements and cash collateral for credit cards. In addition, as of January 31, 2021, we had $102.8 million of marketable securities. Marketable securities consist of corporate bonds and commercial paper. Such interest-earning instruments carry a degree of interest rate risk. The primary objectives of our investment activities are the preservation of capital, the fulfillment of liquidity needs, and the fiduciary control of cash. We do not enter into investments for trading or speculative purposes. The Credit Agreement allowed us to borrow up to $100.0 million as of January 31, 2020, and the Credit Facility currently allows us to borrow up to $200.0 million. The effect of a hypothetical 10% change in interest rates would not have had a material impact on our consolidated financial statements for the fiscal years ended January 31, 2020 and 2021.
Foreign Currency Exchange Risk
Foreign Currency Exchange Risk Related to our Operations
The functional currency of our non-U.S. subsidiaries is the local currency. Asset and liability balances denominated in non-U.S. dollar currencies are translated into U.S. dollars using period-end exchange rates, while revenue and expenses are based upon the exchange rate at the time of the transaction. Translation adjustments are recorded as a component of accumulated other comprehensive income (loss). Transaction gains or losses are recorded in other (expense) income, net of our consolidated statements of operations. While we currently engage
95
Table of Contents
in hedging activity to reduce our potential exposure to currency fluctuations, we did not do so during the fiscal year ended January 31, 2020. If we are not able to successfully hedge against the risks associated with currency fluctuations, our results of operations could be adversely affected. The effect of a hypothetical 10% change in foreign currency exchange rates applicable to our business, after considering hedging activity, would have had an impact on our results of operations of $13.6 million and $3.5 million for the fiscal years ended January 31, 2020 and 2021, respectively.
Foreign Currency Exchange Risk Related to Intercompany Note
As of January 31, 2020 and 2021, we have an outstanding intercompany note with our Romanian subsidiary, held in a different functional currency. We plan to settle the note with our Romanian subsidiary during the fiscal year ending January 31, 2022. The effect of a hypothetical 10% change in the foreign currency exchange rate related to this intercompany note, would have had an impact on our results of operations of $12.0 million and $16.5 million for the fiscal years ended January 31, 2020 and 2021, respectively.
Critical Accounting Policies and Estimates
Our consolidated financial statements are prepared in accordance with GAAP. The preparation of consolidated financial statements requires management to make estimates and assumptions that affect the amounts of assets and liabilities at the date of the consolidated financial statement and amounts of revenue and expenses reported during the period. We evaluate our estimates and assumptions on an ongoing basis. Our estimates are based on historical experience and various other assumptions that we believe to be reasonable under the circumstances.
Additionally, the COVID-19 pandemic has created significant uncertainty in macroeconomic conditions, and the extent of its impact on our operational and financial performance will depend on certain developments, including the duration and spread of the outbreak and the impact on our customers and sales cycles. This outbreak could decrease technology spending, adversely affect demand for our product, and harm our business and results of operations. We considered the impact of COVID-19 on our estimates and assumptions and determined that there were no material adverse impacts on the consolidated financial statements for the fiscal year ended January 31, 2021. As events continue to evolve and additional information becomes available, our estimates and assumptions may change materially in future periods. The critical accounting policies and estimates, assumptions and judgments that we believe have the most significant impact on our consolidated financial statements are described below.
Revenue Recognition
We derive our revenue from the sale of our software licenses for use of our proprietary software, maintenance and support for our licenses, right to access certain products that are hosted by us (i.e., SaaS), and professional services. We recognize revenue pursuant to ASC 606, Revenue from Contracts with Customers, or ASC 606. In accordance with ASC 606, revenue is recognized when a customer obtains control of promised goods or services are delivered. The amount of revenue recognized reflects the consideration that we expect to receive in exchange for these goods or services. To achieve the core principle of this standard, we applied the following five steps:
1. Identification of the contract, or contracts, with the customer;
2. Identification of the performance obligations in the contract;
3. Determination of the transaction price;
4. Allocation of the transaction price to the performance obligations in the contract; and
96
Table of Contents
5. Recognition of the revenue when, or as, a performance obligation is satisfied.
Each of our significant performance obligations and our application of ASC 606 to our revenue arrangements are discussed in further detail below.
Licenses
We sell term licenses which provide customers the right to use software for a specified period of time and perpetual licenses which provide customers the right to use software for an indefinite period of time. For each respective type of license, revenue is recognized at the point-in-time when the customer is able to use and benefit from the software, which is generally upon delivery to the customer or upon the commencement of the renewal term. For licenses revenue, we generally invoice when the license(s) are provided.
Maintenance and Support
Maintenance and support are provided for both term and perpetual license arrangements and consists of technical support and the provision of unspecified updates and upgrades on a when-and-if-available basis. Maintenance for perpetual licenses is renewable, generally on an annual basis, at the option of the customer. Maintenance represents stand-ready obligations for which revenue is recognized ratably over the term of the arrangement. For maintenance and support services, we generally invoice for maintenance and support when the associated license(s) are provided.
Hybrid and Cloud-Based Arrangements
In fiscal year 2021, we started offering hybrid and cloud solutions. Hybrid solutions are comprised of three performance obligations, license, maintenance and support, and right to access certain products that are hosted by us (SaaS). Revenue from license and maintenance and support are accounted for pursuant to the paragraphs above. The performance obligation under the cloud component of the hybrid solution and SaaS arrangements is a stand-ready obligation to provide access to our products. Revenue from the cloud component of the hybrid solution and SaaS arrangements are recognized on a ratable basis over the contractual period of the arrangement beginning when or as control of the promised good or services is transferred to the customer. The revenue related to the cloud component of the hybrid arrangement together with the revenue related to the cloud-based arrangements are presented as Revenue, maintenance and support in our results of operations, as such revenue was not material to total revenue for the fiscal year ended January 31, 2021.
Services and Other
Revenue from services and other consists of fees associated with process automation, customer education and training services. A substantial majority of the professional service contracts are recognized on a time and materials basis and the related revenue is recognized as the service hours are rendered. For non-recurring professional services, we invoice as the work is incurred or in advance.
Material Rights
Contracts with customers may include material rights which are also performance obligations. Material rights primarily arise when the contract gives the customer the right to renew or receive products or services at greater discounted prices in the future. The revenue associated with material rights is recognized at the earlier of the time of exercise or expiration of the customers rights.
In determining the amount allocated to material rights, we use certain assumptions and judgments in forecasting the future amount of purchases and associated stand-alone selling price, or SSP. These assumptions and judgments are based on our best estimates at that time.
97
Table of Contents
Contracts with Multiple Performance Obligations
Most contracts with customers contain multiple performance obligations that are distinct and are accounted for separately. The transaction price is allocated to the separate performance obligations on a relative SSP basis. We determine SSP for all performance obligations using observable inputs and external market data, such as standalone sales, historical contract pricing, and industry pricing data available to the public. SSP is consistent with our overall pricing objectives, taking into consideration the type of licenses, maintenance and support services, and professional services purchased by the customer. SSP also reflects the amount we would charge for that performance obligation if it were sold separately in a standalone sale, and the price we would sell to similar customers in similar circumstances.
In determining the SSP for our performance obligations, we mainly use observable inputs or methodologies that maximize the use of observable inputs; therefore, we use a limited amount of judgment and assumptions.
Other Policies and Judgments
Payment terms and conditions vary by contract type, although terms generally include a requirement of payment within 30 to 60 days of the invoice date. In certain arrangements, we receive payment from a customer either before or after the performance obligation has been satisfied; however, our contracts do not contain a significant financing component. The primary purpose of our invoicing terms is to provide customers with simplified and predictable ways of purchasing our products and services, not to receive financing from our customers or to provide customers with financing. We applied the practical expedient in ASC 606 and did not evaluate payment terms of one year or less for the existence of a significant financing component. Revenue is recorded net of sales tax. We generally do not offer right of refund in our contracts.
Contract Balances
Contract assets consist of unbilled accounts receivable, which occur when a right to consideration for our performance under the customer contract occurs before invoicing the customer. Accounts receivable are recorded when the customer has been billed and the right to consideration is unconditional. The amount of unbilled accounts receivable is included within contract assets, current and non-current on the consolidated balance sheets.
Contract liabilities consist of deferred revenue. Revenue is deferred when we invoice in advance of performance under a contract. The current portion of the deferred revenue balance is recognized as revenue during the 12-month period after the balance sheet date. The non-current portion of the deferred revenue balance is recognized as revenue following the 12-month period after the balance sheet date.
Deferred Contract Acquisition Costs
We defer sales commissions that are incremental to the acquisition of customer contracts. These costs are recorded as deferred contract acquisition costs on the consolidated balance sheets. We determine whether costs should be deferred based on their sales compensation plans, if the sales commissions are incremental, and would not have occurred absent the customer contract.
During fiscal years 2020 and 2021, sales commissions for renewal of a subscription contract are commensurate with the sales commissions paid for the acquisition of the initial subscription contract because the minimal to no difference in sales commission rates between new and renewal contracts. Sales commissions paid upon the initial acquisition of a contract are amortized over the contract term, while sales commissions paid related to renewal contracts are amortized over the renewal term. We have applied the practical expedient in ASC 340-40, Other Assets and Deferred Costs to expense costs as incurred for costs to obtain a contract with a customer when the amortization period would have been one year or less.
98
Table of Contents
At the end of fiscal year 2021, we approved a new sales incentive plan for fiscal year 2022, under which, sales commissions for renewal of a subscription contract are not commensurate with the commissions paid on initial contract. Under the new sales incentive plan, we defer incremental commissions related to initial contracts and amortize such costs over the expected period of benefit, which we determined to be five years. We determined the period of benefit by taking into consideration the length of our customer contracts, the technology lifecycle, and other factors. This change is accounted for as a change in accounting estimate.
Amortization is recognized consistently with the pattern of revenue recognition of the respective performance obligation to which the contract costs relate to. Amortization of deferred contract acquisition costs is included in sales and marketing expense in the consolidated statements of operations.
We periodically review deferred contract acquisition costs to determine whether events or changes in circumstances have occurred that could impact the period of benefit. There were no impairment losses recorded for fiscal years 2020 and 2021.
Stock-Based Compensation
We recognize stock-based compensation expense in accordance with the provisions of ASC 718, CompensationStock Compensation, or ASC 718. ASC 718 requires the measurement and recognition of compensation expense for all stock-based awards made to employees, directors, and non-employees based on the grant date fair value of the awards.
We use the Black-Scholes option-pricing methodology, or OPM, for valuing stock options, which is a level 3 fair value measure. The fair value of an award is recognized as an expense over the requisite service period on a straight-line basis. Stock-based compensation expense is included in cost of revenue and operating expenses within our consolidated statements of operations based on the expense classification of the individual earning the award.
The determination of the grant date fair value of stock-based awards is affected by the estimated fair value of our common stock as well as other highly subjective assumptions, including, but not limited to, the expected term of the stock-based awards, expected stock price volatility, risk-free interest rates, and expected dividends, which are estimated as follows:
| | Fair value per share of our common stock. Because there is no public market for our common stock, the board of directors, with the assistance of a third-party valuation specialist, determined the common stock fair value at the time of the grant of stock options based on generally acceptable valuation methodologies for the stock of a privately held company using a hybrid method that considers both an OPM and the Probability Weighted Expected Return Method, or PWERM. |
| | Expected term. The expected term represents the period that options are expected to be outstanding. We determine the expected term using the simplified method. The simplified method deems the term to be the average of the time-to-vesting and the contractual life of the options. |
| | Expected volatility. As a public market for our common stock does not exist, there is no trading history of the common stock. We estimated the expected volatility based on the implied volatility of similar publicly held entities, referred to as guideline public companies, over a look-back period equivalent to the expected term of the awards. In evaluating the similarity of guideline companies, we considered factors such as industry, stage of life cycle, size, and financial leverage. |
| | Risk-free interest rate. The risk-free interest rate used to value stock-based awards is based on the U.S. Treasury yield in effect at the time of grant for a period consistent with the expected term of the award. |
99
Table of Contents
| | Estimated dividend yield. The expected dividend was assumed to be zero as we have never declared or paid any cash dividends and do not currently intend to declare dividends in the foreseeable future. |
The Black-Scholes assumptions used to value the employee options at the grant dates are as follows:
| Fiscal Year Ended January 31, | ||||
| 2020 | 2021 | |||
| Expected term (years) |
5.0 6.1 | 5.0 6.1 | ||
| Expected volatility |
40.0% 68.0% | 60.0 61.1% | ||
| Risk-free interest rate |
1.3% 2.9% | 0.2 0.7% | ||
| Estimated dividend yield |
0.0% | 0.0% | ||
We have granted to employees restricted stock units, or RSUs, which vest on the satisfaction of both a service-based and a performance-based vesting condition. The RSUs have a service-based vesting condition satisfied over a four-year period. The performance-based vesting condition will be satisfied upon the occurrence of a qualifying liquidation event which is defined as the earlier to occur of (1) an initial public offering, or IPO, or (2) a sale event. Awards which contain both service-based and performance-based vesting conditions are recognized using the accelerated attribution method once the performance condition is probable of occurring. As the performance-based vesting condition is not deemed probable until occurrence, no stock-based compensation expense has been recorded to date. If the effectiveness of a registration statement had occurred on January 31, 2021, we would have recognized $177.6 million of stock-based compensation expense for all RSUs that had fully or partially satisfied the service-based vesting condition on that date and would have $376.0 million of unrecognized compensation cost to be recognized over the time-based vesting period once the liquidity event condition is probable of being achieved.
These estimates involved in calculating the fair value of our stock options involve inherent uncertainties and the application of significant judgment. We will continue to use judgment in evaluating the assumptions related to our stock-based compensation on a prospective basis. As we continue to accumulate additional data related to our common stock, we may refine our estimation process, which could materially impact our future stock-based compensation expense. As a measure of sensitivity, for every 10% increase in the estimated fair value of our stock options over managements estimates at the grant dates of stock options, stock-based compensation expense recognized for the fiscal years ended January 31, 2020 and 2021 would have increased by $2.6 million and $8.1 million, respectively.
Common Stock Valuations
The fair value of the common stock underlying our equity awards was determined by our board of directors, after considering contemporaneous third-party valuations and input from management. The valuations of our common stock were determined in accordance with the guidelines outlined in the American Institute of Certified Public Accountants Practice Aid, Valuation of Privately-Held-Company Equity Securities Issued as Compensation. Each fair value estimate was based on a variety of factors, which included the following:
| | the prices of the latest secondary sales in arms-length transactions; |
| | the prices of recent sales of our convertible preferred stock to investors; |
| | our capital resources and financial condition; |
| | the preferences held by our convertible preferred stock classes relative to those of our common stock; |
| | the likelihood and timing of achieving a liquidity event, such as an IPO or sale of the company, given prevailing market conditions; |
100
Table of Contents
| | our historical operating and financial performance as well as our estimates of future financial performance; |
| | valuations of comparable companies; |
| | the hiring of key personnel; |
| | the status of our development, product introduction, and sales efforts; |
| | the price paid by us to repurchase outstanding convertible preferred stock and common stock; |
| | the relative lack of marketability of our common stock; |
| | the overall market condition in which our business operates; |
| | industry information such as market growth and volume and macro-economic events; and |
| | additional objective and subjective factors relating to our business. |
In valuing our common stock, the fair value of our business, or enterprise value, was determined using various methods under the market approach, including the subject company transaction, guideline public company, and rate of return methods. The subject company transaction method involves the utilization of a companys own relevant stock transactions. Utilizing the price at which a recent equity class was issued by the company or transacted between third parties, the equity value that results in a value being assigned to the identified equity class consistent with the issue or transacted price is calculated using appropriate allocation methodologies. The guideline public company method estimates value based on a comparison of us to comparable public companies in a similar line of business. From the comparable companies, a representative market value multiple is determined and then applied to our financial results to estimate the value of the subject company. The rate of return method estimates value by applying a rate of return, consistent with our recent progress and achievement of key development milestones, to a previously estimated equity value, such as one determined using the other methods.
The resulting equity value was then allocated to each class of stock using OPM or a hybrid method that considered both OPM and PWERM. The OPM is based on the Black-Scholes option pricing model, which allows for the identification for a range of possible future outcomes, each with an associated probability. The OPM is appropriate to use when the range of possible future outcomes is difficult to predict and thus creates highly speculative forecasts. PWERM involves a forward-looking analysis of the possible future outcomes of the enterprise. This method is particularly useful when discrete future outcomes can be predicted at a relatively high confidence level with a probability distribution. Discrete future outcomes considered under the PWERM include an IPO as well as non-IPO market-based outcomes. Determining the fair value of the enterprise using the PWERM requires us to develop assumptions and estimates for both the probability of an IPO liquidity event and stay private outcomes, as well as the values we expect those outcomes could yield. We apply significant judgment in developing these assumptions and estimates, based upon the enterprise values we determined using the market approach, our knowledge of the business and our reasonable expectations of discrete outcomes occurring. After the equity value is determined and allocated to the various classes of shares, a discount for lack of marketability, or DLOM, is applied to arrive at the fair value of ordinary shares. A DLOM is applied based on the theory that as an owner of a private company stock, the stockholder has limited opportunities to sell this stock and any such sale would involve significant transaction costs, thereby reducing overall fair market value.
Our assessments of the fair value of common stock for grant dates between the dates of the valuations were based in part on the current available financial and operational information and the common stock value provided in the most recent valuation as compared to the timing of each grant. For financial reporting purposes, we considered the amount of time between the valuation date and the grant date to determine whether to use the latest common stock valuation. This determination included an evaluation of whether the subsequent valuation indicated that any significant change in valuation had occurred between the previous valuation and the grant date.
101
Table of Contents
For valuations after the completion of this offering, we will determine the fair value of the common stock underlying equity awards based on the closing price of our common stock as reported on the date of the grant.
Based on the assumed initial public offering price per share of $53.00, which is the midpoint of the price range set forth on the cover page of this prospectus, the aggregate intrinsic value of our outstanding stock options as of January 31, 2021 was $1,182.8 million, with $477.0 million related to vested stock options.
Business Acquisitions
We apply the acquisition method of accounting for business combinations. Under this method of accounting, all assets acquired and liabilities assumed are recorded at their respective fair values at the date of the acquisition. Determining the fair value of assets acquired and liabilities assumed requires managements judgment and often involves the use of significant estimates and assumptions, including assumptions with respect to future cash inflows and outflows, discount rates, intangibles, and other asset lives, among other items. These assumptions and judgments inherently contain risk. Fair value is defined as the price that would be received to sell an asset or paid to transfer a liability in an orderly transaction between market participants at the measurement date. Market participants are assumed to be buyers and sellers in the principal, most advantageous market for the asset or liability. Additionally, fair value measurements for an asset assume the highest and best use of that asset by market participants. Any excess of the purchase price over the fair value of the net assets acquired is recognized as goodwill.
During the measurement period, which may be up to one year from the acquisition date, we may record adjustments to the fair value of these tangible and intangible assets acquired and liabilities assumed, with the corresponding offset to goodwill. In addition, uncertain tax positions and tax-related valuation allowances are initially recorded in connection with a business acquisition as of the acquisition date. Upon the conclusion of the measurement period or final determination of the fair value of assets acquired or liabilities assumed, whichever comes first, any subsequent adjustments are recorded in our consolidated statements of operations. Acquisition costs, such as legal and consulting fees, are expensed as incurred.
Goodwill and Intangible Assets
Goodwill represents the excess of the purchase price in a business acquisition over the fair value of the net assets acquired. Goodwill is tested for impairment at the reporting unit level at least annually in November, or between annual tests in certain circumstances, and written down when impaired. Goodwill is tested for impairment by comparing the fair value of the reporting unit with its carrying value. We have determined that we have one reporting unit. We adopted Accounting Standards Update No. 2017-04, IntangiblesGoodwill and Other (Topic 350): Simplifying the Test for Goodwill Impairment, which simplifies the subsequent measurement of goodwill by removing the second step of the two-step impairment test, effective February 1, 2019, and applied the new guidance when evaluating goodwill for impairment during fiscal years 2020 and 2021. The amendment requires an entity to perform its annual or interim goodwill impairment test by comparing the fair value of a reporting unit with its carrying amount. If the carrying amount of the reporting unit exceeds the estimated fair value, an impairment charge is recorded to reduce the carrying value to the estimated fair value.
We qualitatively assessed our goodwill for impairment during the fiscal years ended January 31, 2020 and 2021. In evaluating whether it is more likely than not that the fair value of the reporting unit is less than its carrying amount, we assess relevant events and circumstances, which include:
| | macroeconomic conditions such as a deterioration in general economic conditions or limitations on accessing capital; |
| | industry and market considerations such as a deterioration in the environment in which we operate or a change in the market for our products or services; |
102
Table of Contents
| | overall financial performance such as negative or declining cash flows or a decline in actual or planned revenue or earnings compared with actual and projected results of relevant prior periods; and |
| | other relevant entity-specific events such as changes in management, key personnel, strategy, or customers. |
We weigh these factors to determine if it was more likely than not that the fair value of the reporting unit exceeded its carrying value. If after performing a qualitative assessment, indicators were present, or we identified factors that caused us to believe it was appropriate to perform a more precise calculation of fair value, we would have moved beyond the qualitative assessment and performed a quantitative impairment test. If our estimates or related assumptions change in the future, we may be required to record an impairment charge related to our goodwill. We have not recognized any goodwill impairments during the periods presented. Changes in economic and operating conditions that occur after the annual impairment analysis or an interim impairment analysis, and that impact these assumptions, may result in a future goodwill impairment charge.
Acquired intangible assets consist of identifiable intangible assets, primarily software technology and customer relationships, resulting from our business acquisitions. Intangible assets are recorded at fair value on the date of acquisition and are amortized over their estimated useful lives. We evaluate our intangible assets for indicators of possible impairment when events or changes in circumstances indicate the carrying amount of an asset or asset group may not be recoverable. This includes but is not limited to significant adverse changes in business climate, market conditions or other events that indicate an assets carrying amount may not be recoverable. When measuring the recoverability of these assets, we will make assumptions regarding our estimated future cash flows expected to be generated by the assets. If our estimates or related assumptions change in the future, we may be required to impair these assets. An asset is considered impaired if the carrying amount exceeds the undiscounted future net cash flows that the asset is expected to generate.
Income Taxes
We apply the provisions of ASC 740, Income Taxes. Under ASC 740, we account for our income taxes using the asset and liability method whereby deferred tax assets and liabilities are determined based on temporary differences between the bases used for financial reporting and income tax reporting purposes. Deferred income taxes are provided based on the enacted tax rates and laws that will be in effect at the time such temporary differences are expected to reverse. A valuation allowance is provided for deferred tax assets if it is more likely than not that we will not realize those tax assets through future operations.
We also utilize the guidance in ASC 740 to account for uncertain tax positions. ASC 740 contains a two-step approach to recognizing and measuring uncertain tax positions. The first step is to evaluate the tax position for recognition by determining if the weight of available evidence indicates it is more likely than not that the position will be sustained on audit, including resolution of related appeals or litigation processes, if any. The second step is to measure the tax benefit as the largest amount that is more likely than not of being realized and effectively settled. We consider many factors when evaluating and estimating its tax positions and tax benefits, which may require periodic adjustments, and which may not accurately reflect actual outcomes.
JOBS Act Accounting Election
We are an emerging growth company, as defined in the Jumpstart Our Business Startups Act of 2012, or JOBS Act, and, for so long as we continue to be an emerging growth company, we may take advantage of certain exemptions from various reporting requirements that are applicable to other public companies that are not emerging growth companies including, but not limited to, not being required to comply with the auditor attestation requirements of Section 404, reduced disclosure obligations regarding executive compensation in our periodic reports and proxy statements and exemptions from the requirements of holding a nonbinding advisory vote on executive compensation and shareholder approval of any golden parachute payments not previously
103
Table of Contents
approved. In addition, pursuant to Section 107 of the JOBS Act, as an emerging growth company, we have elected to take advantage of the extended transition period for complying with new or revised accounting standards until those standards would otherwise apply to private companies. If we cease to be an emerging growth company, we will no longer be able to take advantage of these exemptions or the extended transition period for complying with new or revised accounting standards.
Recent Accounting Pronouncements
See the section titled Summary of Significant Accounting Policies in Note 2 to our consolidated financial statements included elsewhere in this prospectus for more information.
104
Table of Contents
Our Mission
Our mission is to unlock human creativity and ingenuity by enabling the fully automated enterprise and empowering workers through automation.
Overview
The modern enterprise is complex as employees must navigate an ever-increasing number of systems and applications to perform their day-to-day work. This dynamic forces workers to constantly execute manual, time-consuming, and repetitive tasks to get their work done. The friction faced by workers often results in lost productivity that can have a direct impact on a companys bottom line. Traditional automation solutions intended to reduce this friction have generally been designed to be used by developers and engineers, rather than the employees directly involved in executing the actual work being automated. As a result, employees are limited by the lack of flexibility of these traditional automation technologies causing employee productivity, innovation, and satisfaction to suffer.
Our platform is designed to transform the way humans work. We provide our customers with a robust set of capabilities to discover automation opportunities and build, manage, run, engage, measure, and govern automations across departments within an organization. Our platform leverages the power of artificial intelligence, or AI, based computer vision to enable our software robots to perform a vast array of actions as a human would when executing business processes. These actions include, but are not limited to, logging into applications, extracting information from documents, moving folders, filling in forms, and updating information fields and databases. Our robots ability to learn from and replicate workers steps in executing business processes drives continuous improvements in operational efficiencies and enables companies to deliver on key digital initiatives with greater speed, agility, and accuracy.
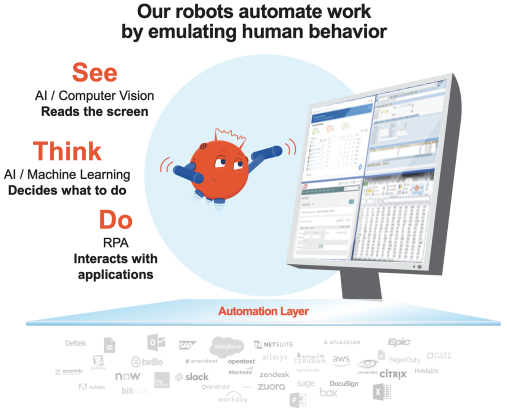
105
Table of Contents
Our platform is designed to interact with and automate processes across a companys existing enterprise stack. As a result, our customers can leverage the power of our platform without the need to replace or change existing business applications and with lower overall information technology, or IT, infrastructure cost. Our platform enables employees to quickly build automations for both existing and new processes. Employees can seamlessly maintain and scale automations across multiple deployment options, constantly improve and evolve automations, and continuously track and measure the performance of automations, all without substantial technical experience.
At the core of our automation platform is a set of capabilities that emulates human behavior, which provides our customers with the ability to automate both simple and complex use cases. Automations on our platform can be built, consumed, managed, and governed by any employee who interacts with computers, resulting in the potential for broad applicability of our platform across departments within an organization. Society is at a turning point in how organizations execute work, and we believe the ability to leverage software to enrich the employee experience will unlock tremendous value and efficiency opportunities. While we are still in the early days of a multi-year journey to the fully automated enterprise, momentum is growing as organizations across the world are only now beginning to understand the power of automation.
Many of our customers expand the scope and size of use cases of our platform across their organizations as they quickly realize the power of our platform. We believe that the success of our land-and-expand business model is centered on our ability to deliver significant value in a very short time. We grow with our customers as they identify and expand the number of business processes to automate, which increases the number of robots deployed and the number of users interacting with our robots. Our ability to expand within our customer base is demonstrated by our dollar-based net retention rate, which represents the rate of net expansion of annualized renewal run-rate, or ARR, from existing customers over the last 12 months. Our dollar-based net retention rate was 153% and 145% as of January 31, 2020 and 2021, respectively. See the sections titled Managements Discussion and Analysis Financial Condition and Result of OperationsKey Factors Affecting Our Performance for additional information regarding our dollar-based net retention rate and Managements Discussion and Analysis Financial Condition and Result of OperationsKey MetricAnnualized Renewal Run-Rate for additional information regarding our ARR.
We have an efficient go-to-market model, which consists primarily of an enterprise field sales force supplemented by a high velocity inside sales team focused on small and mid-sized customers as well as a global strategic sales team focused on the largest global customers. As of January 31, 2020, we had 6,009 customers, including 80% of the Fortune 10 and 61% of the Fortune Global 500. As of January 31, 2021, we had 7,968 customers, including 80% of the Fortune 10 and 63% of the Fortune Global 500. Our customers span a variety of industries and include Adobe, Applied Materials, Chevron, Chipotle Mexican Grill, CrowdStrike, CVS Health, Deutsche Post DHL, EY, Generali, KDDI, SBA Communications, Takeda Pharmaceuticals, and Uber Technologies, Inc.
We have experienced rapid growth. Our ARR was $351.4 million and $580.4 million in the fiscal years ended January 31, 2020 and 2021, respectively, representing a growth rate of 65%. We generated revenue of $336.2 million and $607.6 million, representing a growth rate of 81%, and a net loss of $519.9 million and $92.4 million in the fiscal years ended January 31, 2020 and 2021, respectively. Our operating cash flows were $(359.4) million and $29.2 million and our free cash flows were $(380.4) million and $26.0 million in the fiscal years ended January 31, 2020 and 2021, respectively. See the section titled Managements Discussion and Analysis Financial Condition and Result of OperationsNon-GAAP Financial MeasuresNon-GAAP Free Cash Flow for additional information on free cash flow, a non-GAAP measure.
Our Industry
Explosive Growth of Cloud-Based Applications Creating a New Era of IT Complexity. Businesses around the world are spending hundreds of billions of dollars to adopt applications that help advance digital transformation and drive competitive advantages. With the proliferation of cloud technologies and software-as-a-service, or SaaS, traditional software suites have been disaggregated into point solutions. For example, human capital management software has been segregated across recruiting, payroll, benefits administration, and other key business functions. As a result, enterprises have transitioned from managing a
106
Table of Contents
handful of multi-purpose, largely on-premises applications to managing hundreds and even thousands of specialized point solutions deployed across on-premises, cloud, and hybrid environments. According to the Wall Street Journal, in 2019 the number of software applications deployed by large firms across all industries worldwide had increased by approximately 70% over the previous four years. These applications, which were generally not designed for interoperability, run in tandem with long-running, legacy technologies. The increasing volume of applications has a compounding effect on the complexity of business processes and the IT environments that support them.
The Benefits of Digital Transformation Have Yet to Make Their Way to the Workforce. Modern enterprise applications enable deep and nuanced functionalities, such as conducting personalized marketing campaigns, predictive service delivery, and real time visibility of goods movement across the supply chain. However, despite massive functional advancement, the true promise and potential of digital transformationreallocating human capital towards cognitive, higher-value activitiesremains elusive, which is limiting improvements in productivity. For example, in the United States, non-farm real output per hour grew 31% during the decade ended December 31, 2009, but only 13% in the subsequent decade ended December 31, 2019.
Individual Business Processes Rely on Multiple Business Applications, and Workers to Orchestrate Them. While specialized applications deliver extensive functionality, they do not account for the full spectrum of how work gets done. The proliferation of specialized applications has resulted in humans being the connective tissue in an enterprise, working across a wide range of applications that individually are not built to address the needs of the actual processes they are supporting. As a result, activities performed by many workers today are still
107
Table of Contents
manual, mundane, and administrative tasks, limiting workers from focusing on higher-value activities that can directly improve business performance.
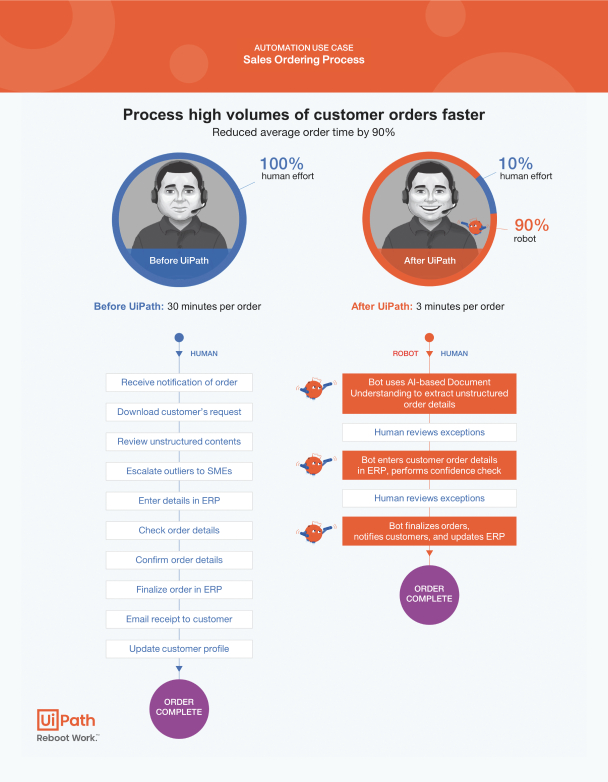
108
Table of Contents
Automation is the New Frontier of Competitive Differentiation. Enterprises are demanding a new approach to unify, tailor, and run applications without significant IT resources or changes to existing infrastructure. Automation enables organizations to design and optimize business processes to improve productivity and business performance. Additionally, automation solutions that can accurately and consistently emulate human behavior can work within existing business processes in a way that traditional applications cannot. This allows businesses to harness the power of specialized applications in a differentiated manner. With the ability to emulate human behavior, this new approach to automation is disrupting traditional automation and transforming data-processing work by allowing customers to find efficiencies without materially changing business processes and supporting infrastructure.
Empowering Workers to Automate their Personal Workflows is Leading to a Democratization of Automation. The emerging workforce is graduating with increasingly advanced technical skills and training in automation. Individuals are entering the workforce with higher expectations related to job impact, satisfaction, and efficiency, and view software as a driving force in realizing those expectations. As a result, organizations are looking to empower workers with tools to optimize the more tedious parts of their jobs. The combination of technology that can emulate human behavior and a workforce with the knowledge and tools to create their own automations has enabled enterprises to begin to automate a significant number of use cases, from individual tasks to enterprise-wide processes.
Cost of Skilled Human Capital is Accelerating the Evolution Towards the Fully Automated Enterprise. The cost of skilled human capital continues to rise due to growing demand. We believe it is increasingly imperative for enterprises to leverage automation to liberate workers from menial, repetitive, and less productive tasks and to better utilize the positive qualities that only humans have, such as abstract thinking, making connections, dealing with ambiguity, creativity, innovation, passion, and community engagement. We believe this will drive business value and greater employee engagement. According to a 2020 Gallup study, business units with highly engaged employees are more present and productive; more attuned to the needs of customers; and more observant of processes, standards, and systems. When taken together, the behaviors of highly engaged business units result in 21% greater profitability.
Limitations of Existing Offerings
A number of technology companies have attempted to address the automation needs of organizations through the application of business process management, application development platform offerings, robotic process automation, or RPA, tools, and AI point offerings, as well as other horizontal software applications. However, these existing offerings are challenged by a number of inherent limitations, including:
Lack of An End-to-End Platform. Many existing automation software offerings are point technologies and cannot offer end-to-end automation capabilities on an integrated platform, which inhibits visibility, insight, and context for discovering and building additional automations.
Not Capable of Emulating Human Behavior, Relying too Heavily on APIs. Many existing offerings do not effectively integrate AI computer vision and machine learning, or ML, capabilities needed to accurately identify and emulate human actions in conjunction with application programming interfaces, or APIs. Without these capabilities, organizations are limited to pursuing automation only within the narrow pathways permitted by existing APIs. Even when applications have an API, the functionality provided often does not fully capture what is required to conduct the business process. As the scope of a task or process expands from a single, discrete action to a sequence of multiple steps and sub-processes, the limitation in scope and complexity of supported API actions becomes more of an impediment to fully emulating the process. This frequently prevents this work from being truly automated solely through APIs alone. Bringing APIs together with an emulative approach made possible by AI computer vision and machine learning greatly expands the use cases for automation.
Inability to Automate Across Applications. While business processes typically involve multiple applications, many existing automation capabilities are built into specific applications and are limited in their
109
Table of Contents
ability to automate business processes across multiple applications. Accordingly, enterprises build inefficient business processes to compensate for limited cross-functional automation capabilities.
Difficult to Link AI Capabilities to Execution. AI and ML, or AI/ML, capabilities are needed to automate cognitive, high-value tasks. In recent years, enterprises have made significant investments in developing AI/ML models. However, it is difficult to leverage these models as the environments for developing them, typically used by data scientists, are distinct from the environments where processes are carried out, typically by employees using enterprise applications. This separation of environments limits the ability of an organization to deploy models that are necessary to automate complex processes.
Need to Change an Enterprises Underlying Infrastructure. Existing offerings generally are unable to emulate the humans role in executing a business process, requiring organizations to make significant changes either to their applications and infrastructure or to the business processes themselves. The costs associated with changing underlying infrastructure and business processes make it uneconomical to automate anything outside of narrowly defined, high-volume tasks.
Unable to Realize Full Value of Automation Throughout an Organization. Existing solutions do not typically make automations accessible to everyone within the organization as they are often built with non-intuitive user interfaces, or UIs, and code heavy technology stacks. These solutions are too technical for most knowledge workers, limiting their application to a small number of use cases and users with significant developer experience. Existing solutions also frequently require additional time and resources to enable the resulting automation to be used by non-technical workers or to adapt the automation to nonstandard circumstances and environments.
Lack Governance Capabilities at Scale. Existing offerings do not typically offer centralized, secure governance capabilities to enforce, manage, and deploy organizational development standards.
Difficult to Deploy. Existing automation solutions generally require complicated, invasive implementation processes that, in turn, require extensive upfront and ongoing training and time commitment. This makes it difficult to build and maintain automations, resulting in the persistence of manual processes throughout enterprises.
Lack of Openness and Interoperability. Many existing solutions are not modular and lack the ability to integrate new, third-party technologies and operate with customized applications. Enterprises using these solutions are locked into a limited set of proprietary options not built for the future.
Lack of an Engaged Community of Automation Developers. Many existing automation vendors do not have open platforms and have not invested the time and resources required to cultivate a vibrant ecosystem of automation developers that freely exchange innovations and best practices.
110
Table of Contents
The Evolution of Business Process Automation
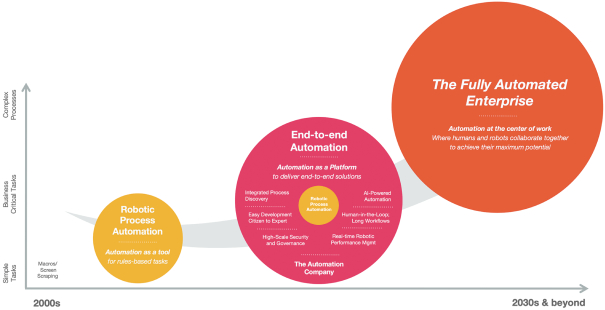
Throughout history, workers have sought to use tools to be more productive. Therefore, unsurprisingly, automation has been a feature of enterprise software since the beginning of software development. However, these automations operated within the domain of specific software applications making them far less capable of extending their automation capabilities to cross-application actions required to complete business processes. These automations, while highly valuable compared to the status quo, were incapable of rising above the application layer to fully address end-to-end business processes.
For many years, automation outside of the scope of individual applications was piecemeal, limited, fragile, and bespoke scripts, macros, screen scraping. These early automations were designed to automate non-mission critical tasks with low complexity. Over time, automation technology progressed to incorporate rules-based batch processing of back-office functions, primarily through APIs. Automation as a standalone tool emerged, first via business process management and workflow platforms and then as true RPA.
RPA was the first automation technology to leverage the UI along with APIs, freeing automation technology of the constraints imposed upon it by the underlying applications and enabling its expansion beyond simple back-office processes. With RPA formalizing the potential to automate across applications, the potential use cases for automation expanded dramatically. RPAs disruption of automation technologies lies in its ability to use the existing UI to fully replicate the necessary business process, and its ability to utilize both UI and API-based capabilities in a flow that can replicate the nuances and complexities of human work. This user emulation-based approach, in contrast to other approaches that are often inflexible and require parts of the process to be replaced before they can drive meaningful automation, enables RPA to automate a fuller scope of processes, including widespread but lower-volume processes that are not addressed by traditional approaches. We have been an early leader in RPA, recognized by customers and third-party industry analysts alike for our robust and seamless combination of UI and API automation along with ease of deployment and enterprise readiness, kicking off what we refer to as the Automation-First Era. For example, we were recently recognized as a Leader in The Forrester Wave: Robotic Process Automation, Q1 2021, in which we were described as enterprise-grade and innovative with state of the art security, access control, and authentication features.
We have pushed beyond RPA and pioneered Automation-as-a-Platform by building an open platform with user emulation at its core. Our platform is designed to address the complete lifecycle of automation within an enterprise, from identifying specific tasks and processes to automate to building, managing, and deploying automation robots and measuring their business impact. With an end-to-end automation platform and a focus on democratizing automation, we have contributed to significant momentum for automation within our customers.
111
Table of Contents
As enterprises accelerate their pace of automation and utilize the full breadth of Automation-as-a-Platform, they approach becoming fully automated enterprises. In a fully automated enterprise, automation will be woven into the central nervous system of the company and workers will continuously observe, interact with, automate, and improve all processes and operations across an enterprise. In the fully automated enterprise, automation evolves from a core, strategic capability into the critical fabric that powers and accelerates the enterprise forward.
Our Solution and Key Strengths
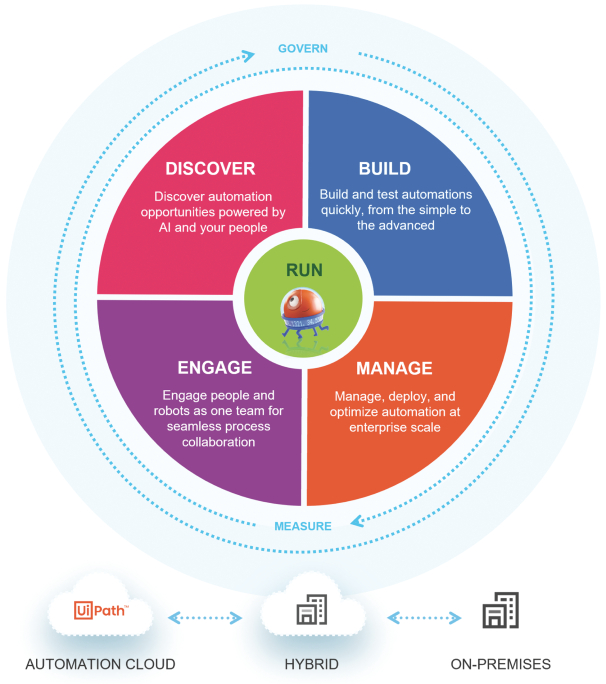
112
Table of Contents
We are at the forefront of technology innovation and thought leadership in automation, creating an end-to-end platform that provides automation with user emulation at its core. Our platform leverages computer vision and AI to empower software robots to emulate human behavior and execute specific business processes, eliminating the need for employees to execute certain manual and mundane tasks. Our platform allows employees to focus on more value-added work and enables organizations to seamlessly automate business processes ranging from those in legacy IT systems and on-premises applications to new cloud-native infrastructure and applications without requiring significant changes to the organizations underlying technology infrastructure. Our platform is purpose-built to be used by employees throughout a company and to address a wide variety of use cases, from simple tasks to long-running, complex business processes.
Broad Set of Complementary Solutions. Our platform combines computer vision, AI, ML, RPA, and process-discovery capabilities to enable automations across deployment environments, systems, and applications. We provide our customers with a comprehensive set of capabilities to discover, build, manage, run, engage, measure, and govern automations across departments and personas within an organization or agency. Our platforms capabilities enable automation through a variety of ways, including communicating with APIs, simulating clicking/typing across UIs, and executing scripts written in other coding languages, all in a single integrated solution.
Open Architecture. Our platform embraces an open ecosystem with hundreds of enterprise application integrations that have been built by both UiPath and the UiPath community of technology partners. Our solution includes a variety of pre-built activities and connectors so customers can quickly create and deploy robots that execute operations and seamlessly interact with third-party systems. Our open ecosystem is architecture agnostic, which allows organizations to automate existing infrastructure and accelerate digital innovation without the need to replace or make large investments in their existing infrastructure.
Built-In AI/ML Capabilities. We incorporate proprietary AI/ML into our products to drive continuous improvement of workflows. Our AI/ML capabilities broaden the applicability of our solution to address complex use cases. Our platforms AI/ML capabilities convert rule-based models to experience-based models allowing for greater adaptation to constantly changing variables and producing automation capabilities that we believe dramatically elevate business outcomes and drive customer competitive advantages. Our platform can learn from human interactions to continuously improve the quality and accuracy of AI algorithms and ML models.
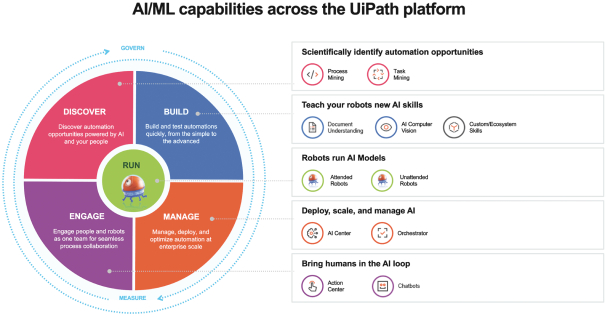
113
Table of Contents
Human Emulation Enables Addressing Expansive Use Cases. Our robots emulate human behavior and are adaptable to constantly changing external variables. Our robots ability to emulate human behavior allows organizations to leverage our platform to address a myriad of use cases, from the simple to the complex. We believe that the power of our platform is only limited by the use cases that human users can conceive.
114
Table of Contents
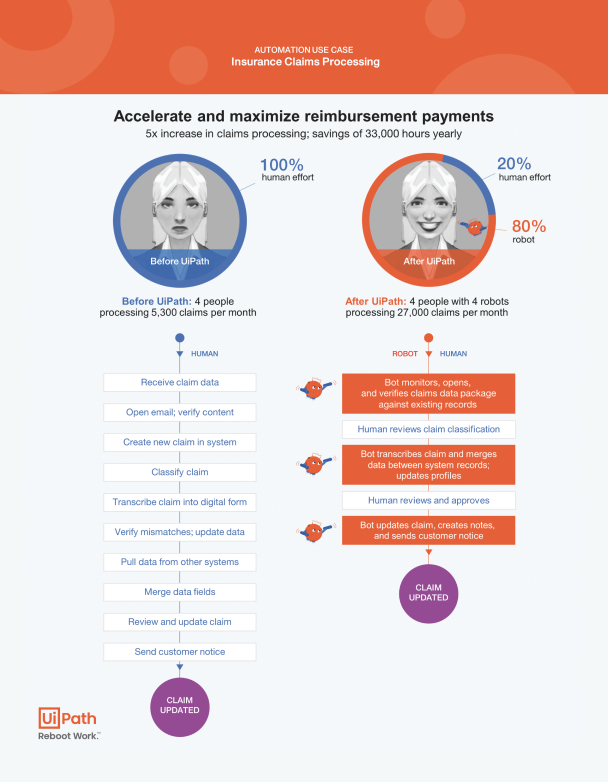
Built for Enterprise Deployment. Our platform grows with our customers as they increase the automation footprint across their organizations. Customers can deploy our platform on-premises, in a public or private cloud,
115
Table of Contents
or in a hybrid environment. Our platform has been architected with security and governance at its core allowing our customers to seamlessly grow their automation footprints while giving their IT departments the tools to establish necessary guardrails around the automations.
Adoption Across Workers and Functions. We make automation accessible to workers throughout an organization. Workers can interact with our robots in many of the same ways that they would interact with humans. Some examples include utilizing attended robots on a desktop to help humans complete their work faster, leveraging unattended robots in the background to execute business processes, building applications to indirectly interact with robots, sending emails to robots, and interacting with chatbots.
Simple, Intuitive, Quickly Deployed. Our platform is easy to use and provides an intuitive interface and low-code, drag-and-drop functionality that allows workers throughout an organization to easily leverage the power of our automation capabilities. Automations can be quickly and efficiently deployed across an organization, creating immediate time-to-value. Our platform does not require heavy implementation costs or substantial professional services and is easy to learn and train employees on regardless of their technical acumen.
Resilient Automations. Our platform was built to emulate the actions of a human interacting with applications and systems to execute processes. Our robots can emulate human behavior by leveraging our proprietary AI-based computer vision capabilities to adapt and respond to changes in work environments such as interpreting highly varied document types or navigating unstable UIs. Our proprietary, AI-based computer vision also allows for increased reliability and accommodation to changes in display resolution, scale, and UI changes. In addition, we have developed a variety of features that are designed to enable resiliency in the process and execution of building automations. For example, our platform enables the management, reusability, and reliability of UI elements by capturing them as objects in a simple repository, sharable across projects and teams. Accordingly, if a change is made to an application, it only needs to be updated once and can be shared broadly. This built-in flexibility demonstrates the resiliency of our robots in automating tasks and reducing the number of errors across the enterprise.
Integrated and Portable AI/ML Models. Customers can extend the capabilities of our platform by integrating with domain-specific AI/ML models to enhance the outcomes of their automation initiatives. Our platform enables companies to easily deploy, manage, and improve AI/ML models built by our customers or third parties allowing for greater allocation of human capital towards business problems and use cases. Our pre-trained AI/ML models have been designed for deployment and customization without the need for a data science or technical background.
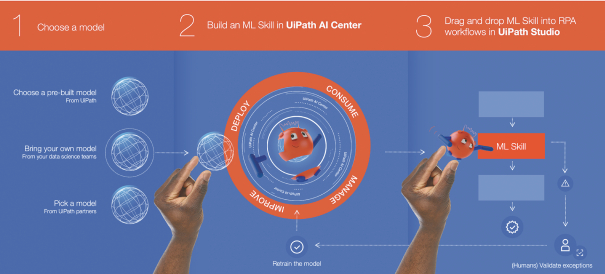
116
Table of Contents
Automation Performance and Business Outcome Analytics. Our platform tracks, measures, and forecasts the performance of automations enabling customers to gain powerful insights and generate key performance indicators with actionable metrics. The out-of-the-box dashboards surface execution metrics and enable users to measure performance and report on the value of the automations to their businesses.
Built for Collaboration. Our platform was designed for people and robots to work together, allowing each to focus on the processes they execute best. Robots execute the time-consuming, manual processes that make work less interesting and satisfying, freeing up humans to think more creatively, innovate, solve complex problems, and improve customer experiences. Our platform enables customers to harness the power of automation to create a fully automated enterprise of humans and robots working together in harmony.
Accelerating the Adoption of Automation within the Enterprise
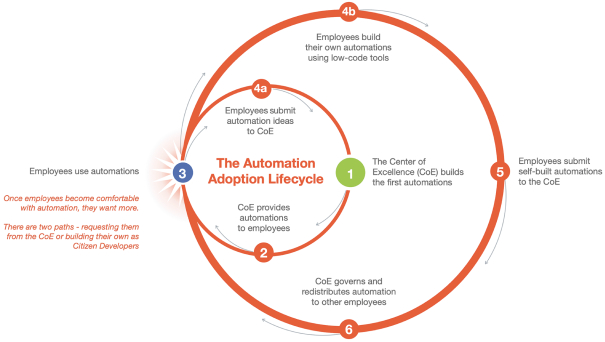
The adoption of our platform is fueled by the virality of our products, which together help organically scale our solution within an organization from the bottom up. Most of our customers start their automation journey with the development of a Center of Excellence, or COE. The COE works with the lines-of-business employees in evaluating and scoring potential high-value automation opportunities. The COE focuses on building automations for simple, widely applicable tasks and provides those automations to the employee base to use in their day-to-day work right from their desktop. As employees become increasingly familiar and comfortable with automations, they begin to adopt and execute automations more readily, uncover new processes within their particular workflows to automate, and contribute new automation ideas to the COE for development and deployment. After several cycles of this dynamic, something distinct happens: a small contingent of employees starts to build useful automations on their own, submits them to the COE for assessment, and, once approved, these automations are then deployed to the rest of the organization. This flywheel continues, spreading development across the entire enterprise and helping organically surface numerous automation ideas that likely could not be achieved through a traditional top-down approach.
Key Benefits to Organizations
Our end-to-end platform is purpose-built to power the fully automated enterprise. Our platform is designed to remove the friction that exists across employees and departments by improving transparency, promoting
117
Table of Contents
collaboration, and allowing people to focus on the work that matters. We enable organizations to implement highly customized, agile, and fast automations with lower overall IT infrastructure costs, with the goal of creating short time to value, improved efficiency, and increased innovation. Our platform provides the following key benefits to organizations:
Empower Customers to Deliver on Digital Initiatives. Our platform helps organizations drive otherwise time-consuming transformational initiatives with speed and ease. Organizations utilize our platform to continuously discover and automate both simple tasks and complex processes to increase the efficiency and resiliency of their operations. The power of our platform can reduce the time to complete work from days and hours to minutes and seconds, allowing employees to focus on more mission-critical and innovative work. As a result, our platform helps organizations accelerate innovation, increase productivity, drive competitive differentiation, and enrich employee and customer experiences.
Build Business Resiliency and Agility into Digital Business Operations. Our platform provides customers with the necessary flexibility to operate under constantly changing conditions. Our combination of computer vision and additional AI capabilities enables our software robots to execute tasks just as humans would. Our robots can be deployed as attended, unattended, or in a hybrid model and seamlessly adjust as conditions change to execute manual and time-consuming tasks and processes. Our platform offers customers a virtually unlimited digital workforce capacity that operates 24 hours per day, 7 days per week to create more efficient digital workflows with fewer errors.
Fast Time-to-Value. We believe our solution delivers immediate return on investment. Our platform is designed to be easy to install and intuitive to learn and use, minimizing the need for lengthy and expensive implementation and training. Our test suite enables centralized testing designed to ensure the quality of automations or applications before they go live, resulting in less time spent on maintenance. Through the use of our platform, our customers realize substantial benefits related to improving costs and increased worker productivity.
Organization-Wide Automation. Our powerful and easy-to-use platform enables workers throughout an organization to build automations. Our platform is designed to automate the full spectrum of business processes and tasks, from individual tasks to complex processes that address entire enterprise divisions. We offer a development platform that reduces the technical skills required of users, effectively democratizing automation to employees throughout an organization. This drives the ubiquity of our platform throughout an organization as employees across departments and job functions leverage our technology to improve their performance.
Identify, Improve, and Analyze Workflow Execution. Our platform provides visibility into how work actually gets done and enables our customers to continually understand, identify, and implement automation opportunities. Our solution leverages advanced process-discovery technologies and ML models to understand individual patterns for executing work and respond to bottlenecks and inefficiencies. Our analytics solution allows our customers to track and monitor these automations creating a cycle of continuous improvement and driving greater return on investments.
Improve Employee Productivity, Experience, and Satisfaction. Our platform enables organizations to establish a work environment centered on innovation and opportunity. Employees are empowered by the countless automation possibilities available using our platform and the ability to digitize time-consuming, manual tasks. We believe this improves the overall experience of our customers employees and allows them to focus on developing more value-added skillsets. As a result, our customers are better positioned to retain a high-value, engaged employee base that can deliver optimal business outcomes.
Improve Accuracy and Compliance with Speed. All processes automated on our platform are designed to execute consistently according to how they were designed, allowing companies to achieve higher levels of accuracy. The quick deployment and adaptability of our platform is designed to eliminate costly errors and inconsistencies that are common among individuals executing manual tasks. Our platform delivers greater oversight of automated tasks, because our robots actions generate logs that can be reviewed and monitored any time giving companies more control and compliance over their operations.
118
Table of Contents
Enhance Customer Experiences. Organizations leverage our robots to resolve customer issues faster and more efficiently. Customer demands are constantly changing and our platform empowers employees to focus on addressing key customer issues and concerns rather than execute lower value tasks. Our robots improve the overall speed, accuracy, and effectiveness of an organizations customer service to improve customer retention and drive loyalty.
Key Benefits to Employees
Our platform is designed to eliminate the need for employees to execute low-value, manual tasks, freeing up time to focus on more meaningful, strategic work. We believe that this, in turn, causes employees to feel empowered and be more valuable in contributing to broader organizational goals. Robotics Engineer is one of the fastest emerging job roles globally, with LinkedIn reporting a 40% compound annual growth rate in job postings from 2015 to 2019. According to a survey conducted by International Data Corporation, or IDC, 53% of respondents indicated that AI and robotics would have a positive impact on jobs in their companies. Additionally, according to a survey published in our 2020 State of the RPA Developer Report, 84% of respondents believe that having RPA skills would positively impact their future career moves.
We believe the democratization of automation leads to the following benefits tied to an improved employee experience:
| | greater professional fulfillment and job satisfaction; |
| | increased creativity and innovation; |
| | improved performance and accuracy; |
| | enhanced skillsets; |
| | increased autonomy and job opportunities; and |
| | more collaboration and better human interactions. |
Our Market Opportunity
We are disrupting a large and fast-growing market. Our platform addresses the market for Intelligent Process Automation, which IDC estimated would have a value of $17 billion by the end of 2020 and is expected to grow at a four-year compound annual growth rate of approximately 16% to $30 billion by the end of 2024. However, we believe that this does not fully encompass the opportunity associated with our vision of the fully automated enterprise.
We estimate our current global market opportunity to be more than $60 billion, which we expect will grow as automation adoption increases and customers continue to further explore the use cases that our platform addresses. To estimate our total market opportunity, we identified the number of companies worldwide across all industries with at least 200 employees, based on certain independent industry data from the S&P Capital IQ database. We then segmented these companies into three categories based on total number of employees: companies with 200-4,999 employees, companies with 5,000-19,999 employees, and companies with 20,000 or more employees. We then multiplied the number of companies in each category by the 90th percentile of ARR per customer in each such cohort as of December 31, 2020, among customers with at least $10,000 in ARR, which we believe represents a customer that has broadly deployed our platform across the enterprise, and then summed the results from each category.
According to an estimate by Bain & Company in the report Beyond Cost Savings: Reinventing Business Through Automation, the expansion of automation platforms by incorporating broader capabilities and technologies has increased the size of the addressable market for automation software to approximately $65 billion.
119
Table of Contents
The size of our addressable market opportunity is underpinned by the substantial amount of business processes that could be improved through automation, but are not currently automated. Forrester, a global research firm, estimated there were 1.69 billion knowledge workers globally as of February 2021. We expect our estimated global market opportunity will continue to expand as customers increase the size of their business units and hire additional employees, resulting in a greater number of users and processes that can benefit from automation throughout these enterprises. Additionally, we believe that we are unlocking a myriad of still unexplored automation possibilities as we continue to contribute to this market. We believe those possibilities represent a significant greenfield opportunity for us.
Organizations across the world are only beginning to understand the power of automation and we believe we are at the forefront of a revolution in the way that people do work. We believe that the opportunity that lies ahead of us is largely untapped and has the potential to be one of the largest ever in enterprise software.
For more information regarding certain assumptions underlying these estimates of market opportunity and the forecasts of market growth included in this prospectus, see the section titled Market, Industry, and Other Data.
Our Growth Strategies
We are pursuing a large market opportunity with growth strategies that include:
Acquire New Customers. Our market is rapidly growing and largely unpenetrated. We believe that as more organizations adopt our automation platform and experience quantifiable competitive advantages, other organizations will also adopt automation as a necessary tool to compete. While we sell to organizations of all sizes and across a broad range of industries, our go-to-market teams key focus is on the largest organizations, including large enterprises and governments. We also use an inside sales team focused on small and mid-sized businesses. Furthermore, we make it easy to try our product through our free Community Edition, with free comprehensive training available on our online UiPath Academy. We plan to continue to invest in our go-to-market team to grow our customer base both domestically and internationally. As of January 31, 2019, 2020, and 2021, we had 2,671, 6,009, and 7,968 customers, respectively.
Expand Within Our Existing Customer Base. Our customer base represents a significant opportunity for us to become a strategic partner to our customers in their automation journeys and drive further sales expansion through the following vectors:
| | deploy more software robots across different departments; |
| | provide more employees with their own robot assistants; |
| | increase adoption of platform products; and |
| | expand use cases for automation in the organization. |
Over time, we seek to deploy our solution where every employee interacts with multiple robots. We believe we will be able to accomplish this through our continued democratization of automation and enablement of citizen developers. The power of our land-and-expand strategy is evidenced by our dollar-based net retention rate, which was 153% and 145% as of January 31, 2020 and 2021, respectively.
120
Table of Contents
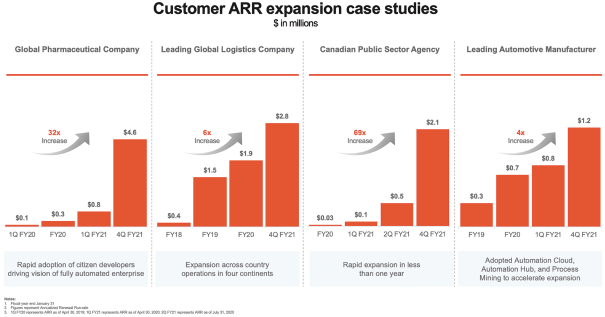
Grow and Cultivate Our Partner and Channel Network. We are focused on maintaining and growing our ecosystem of partners that build, train, and certify skills on our technology as well as deploy our technology on behalf of their customers. We have built a global partner ecosystem of more than 3,700 systems integrators, value-added resellers, business consultants, technology partners, and public cloud vendors. Our partner network includes, among others, Accenture LLP, Amazon Web Services Inc., Capgemini SE, CGI Inc., Cognizant Technology Solutions Corporation, Deloitte & Touche LLP, Ernst and Young LLP, Google Inc., Microsoft Corporation, Oracle Corporation, PricewaterhouseCoopers LLP, Salesforce.com, inc., ServiceNow, Inc., and Workday, Inc. We intend to continue to expand and enhance our partner relationships to grow our market presence and drive greater sales efficiencies.
Extend Our Technology Leadership Through Continued Innovation and Investment in Our Platform. We believe that we have built a differentiated automation platform and intend to continually increase the value we provide to our customers by investing in extending the capabilities of our platform. For example, we have introduced over 12 new products and multiple new features over the last 18 months. We have made and will continue to make significant investments in research and development to bolster our existing technology and enhance usability to improve our customers productivity.
Foster the Next Generation of Workers and Grow Our Community. We have built an extensive ecosystem through our Community and UiPath Academy initiatives focused on training and supporting individuals on working with our platform. We have created forums addressing automation in the workplace and learning plans for all the important roles in automation. We believe automation will be a foundation of the future of work and, as individuals build out their skillsets, this will drive greater adoption of our platform.
Continue to Invest in Major Markets. Since inception, we have invested in developing an infrastructure that would allow us to scale globally. We continue seeing adoption of our products across all geographies in which we operate and believe we have a significant runway ahead of us. We believe there is a significant opportunity to expand use of our platform in the top 25 countries as measured by gross domestic product. As of January 31, 2021, sales to customers located in such countries represented 86% of our total ARR. We intend to continue to make significant investments to expand our sales and drive adoption of our platform throughout those markets. In particular, we believe that North America represents a significant opportunity for us and we intend on continuing to expand our sales and drive adoption of our platform across the region. As of January 31, 2021, customers located in the United States represented 36% of our total ARR.
121
Table of Contents
Opportunistically Pursue Strategic Acquisitions. We have a successful track record of acquiring businesses and technologies to drive product and market expansion. We will continue to evaluate acquisition opportunities that we believe will be complementary to our existing platform, enhance our technology, and increase the value proposition we deliver to our customers.
Our Customers
We have a large and diversified customer base. No customer or channel partner accounted for more than 10% of our revenue for the year-ended January 31, 2021. As of January 31, 2020, we had 6,009 customers, including 80% of the Fortune 10 and 61% of the Fortune Global 500. As of January 31, 2021, we had 7,968 customers, including 80% of the Fortune 10 and 63% of the Fortune Global 500. We pride ourselves in providing a best-in-class experience to every single customer and user of our platform, as evidenced by our Net Promoter Score, or NPS. We achieved an NPS of 71 as of February 2021, on-par with some of the worlds most beloved enterprise and consumer companies. Our NPS score was calculated on a rolling average using data from a survey of our customer base that we conducted over the 12-month period ended February 2021. See the section titled Market, Industry, and Other Data for additional information about our NPS.
Our customers span a variety of industries and across various departments within an organization and include:
| Consumer and Retail
Chipotle Mexican Grill Foot Locker Hudsons Bay Company Landmark Group The Nielsen Company Uber Technologies, Inc. |
Energy
Chevron ConocoPhillips EDF Energy Enel Eversource Energy Gazprom Neft World Fuel Services |
Financial Services
Bank of America Bank of Montreal Credit Agricole Equifax Nomura SMBC TD Securities Voya Financial
|
||
| Healthcare / Pharmaceuticals
Cleveland Clinic CVS Health Delta Dental of California Mercy NYU Langone Medical Center Regeneron Takeda Pharmaceuticals |
Insurance
CSAA Insurance Direct Line Group Generali MAPFRE Insurance Nippon Life |
Manufacturing
Applied Materials Canon, Inc. Crane Co. Ericsson GE Koch Industries Nissan Ricoh Toyota
|
||
| Technology
Adobe Autodesk CrowdStrike Hitachi Rackspace Red Hat Ultimate Kronos Group |
Telecommunications
Etisalat KDDI Lumen Technologies NTT DOCOMO, INC. Orange Spain Rogers Communications SBA Communications |
Other
Cushman and Wakefield Cognizant DENTSU Deutsche Post DHL EY Kelly UNITED
NATIONS
|
||
122
Table of Contents
Customer Case Studies
Sumitomo Mitsui Banking Corporation (SMBC)
Sumitomo Mitsui Financial Group (SMBC Group) is a Japanese multinational banking and financial services institution. SMBC Group was seeking innovative solutions to advance work-style reform by reducing the impact of excessive hours on its workforce.
Situation: In 2017, SMBC Group set out to deliver higher productivity and improved operational efficiencies through utilization of new technologies. SMBC identified UiPaths platform as the critical technology that would serve as the driving force behind its company-wide digital transformation effort.
Solution and Benefits: SMBC Group chose UiPath to free employees from routine tasks so that they could focus on high-value added tasks and deliver higher productivity and improved operational efficiency. As of December 31, 2019, SMBC Group had saved 3.5 million hours since project inception.
SMBC Group is a digital business, and RPA and AI are core to our digital business. CEO, SMBC Value Creation
Nielsen
Nielsen Holdings plc is a global measurement and data analytics company that provides a complete and trusted view of consumers and markets worldwide. Nielsen is divided into two business units. Nielsen Global Media provides media and advertising industries with unbiased and reliable metrics that create a shared understanding of the industry required for markets to function. Nielsen Global Connect provides consumer packaged goods manufacturers and retailers with accurate, actionable information and insights and a complete picture of the complex and changing marketplace that companies need to innovate and grow.
Nielsens approach marries proprietary Nielsen data with other data sources to help clients around the world understand whats happening now, whats happening next, and how-to best act on this knowledge.
An S&P 500 company, Nielsen has operations in over 90 countries, covering more than 90% of the worlds population.
Situation: Nielsen brings new technology to market constantly. The company sees digital transformation as the way to scale new technologies fast despite a growing variety of legacy and new systems. Without automation, the wide variety of systems are left to people to hold fragmented processes together. Nielsen sought to automate its systems in order to more efficiently collect and process vast amounts of data, and analyze such data and serve more customers in less time.
Solution and Benefits: UiPath has helped Nielsen expedite the time it takes to deliver its analysis to customers. Beginning in 2017, Nielsen started with Studio, Orchestrator, and unattended robots. In 2019, Nielsen expanded to a multi-year commitment and added attended robots and Automation Hub, for a total of 100 robots. In 2020, Nielsen added Automation Cloud to accelerate deployments, resulting in the deployment of over 100 additional robots. Automation use cases span Nielsens back-office functions in operations, client service, IT and finance worldwide. For instance, Nielsen has automated certain manual processes to ensure threshold and quality delivery of daily reports delivered to customers worldwide, ensuring tight deadlines are met. Today, Nielsen has automated over 400,000 hours of work across 40 distinct business units. One automation created by a single employee was deployed to over 3,000 users.
We tell our employees, dont be the glue; be the value, and let the robots be the glue that connects the dots. So, when you come to work, data is extracted and ready for you to make your analysis and provide your insights.Vice President, Global Digital Transformation, Nielsen
123
Table of Contents
Equifax
Equifax is a global data, analytics, and technology company that blends unique data, analytics, and technology with a passion for serving customers globally to create insights that power decisions to move people forward.
Situation: To simultaneously manage both fast-pace growth and new restrictions and requirements to support its transformation, Equifax recognized that it needed to generate additional capacity through a digital workforce. Equifax senior executives sought to establish a culture supporting automation.
Solution and Benefits: Equifax created an automation COE in 2017, quickly establishing a governance model to scale RPA company-wide. Through a deployment of over 400 UiPath robots across its finance, operations, compliance, and technology functions, Equifax has created over 1.1 million hours of capacity using our platform, including Automation Hub, Studio, Orchestrator, and unattended and attended robots. Equifax also has expanded its use of our platform by applying attended robots to support call center operations to enhance customer service and responsiveness.
RPA was never a cost play. It is about speed of doing business and compliance, getting the benefits out of the workforce that we have never achieved before.Senior Vice President, Global Shared Services, Equifax
Orange Spain
Orange Spain is the Spanish subsidiary of the French multinational telecommunications company which launched as a commercial brand in Spain in 2006. Orange offers telephone, internet, and internet protocol television services and is currently the second largest operator in Spain for mobile telephone services.
Situation: In 2016, an enterprise-wide transformation was unveiled around three tenets: become a digital and human-centric company, where agility and flexibility are fostered, and where not only teamwork is encouraged, but also individual talent is utilized to maximize potential. RPA was viewed as a technology that wasnt simply a means to optimize operations, but was key to achieving these tenets across the organization.
Solution and Benefits: Orange created the Orange Robot Factory in 2017, a business within the business dedicated to the automation of internal processes so that employees can provide greater value to Oranges customers. Following successes in finance and operations, the factory expanded its use of the UiPath platform to focus on customer care, including through implementing Studio, Orchestrator, and attended and unattended robots. In one use case, over 30 robots were deployed to trigger the diagnostics, escalations, and testing necessary to quickly resolve customer service inquired at all hours of the day, from sending a replacement router to booking an appointment with a technician. In 2020, Orange added StudioX to begin its Citizen Developer program to expand the reach of automation. Altogether, Orange has created and deployed more than 400 robots, saving the company over 34 million in just over two years.
We went all out early, setting ourselves the target to create and operationalize one robot per week. Within the first six months, the Orange Robot Factory had automated over two million interactions in the company performed by robots. This proved we can deliver best-in-class digital transformation.Head of Orange Robot Factory, Orange Spain
Rogers Communications
Founded in 1960, Rogers Communications has grown to become a leading technology and media company that strives to provide the very best in wireless, residential communications, and media to Canadians and Canadian businesses.
Situation: Rogers is determined to drive digital transformation initiatives that improve the companys operational performance and customer satisfaction.
124
Table of Contents
Solution and Benefits: Rogers used UiPath to develop its automation COE in 2019. Rogers started with Studio, Orchestrator, and unattended robots to digitally transform its back-office operations. Rogers expanded with a combination of unattended and attended robots to transform its customer experience, resulting in an additional customer visit per day per field technician, reducing average hold times in its call center by 50 seconds, and deploying robots along with AI to identify and resolve customer issues before they happen, saving $20 million per year.
The big value proposition in automation is time-to-market and time-to-value. Digital transformation is now rapidly raising our bottom-line and customer experience.Senior Vice President Digital Operations and Process Improvement, Rogers Communications
Large U.S. State Government Agency
The Department of Labor, or DoL, within a large U.S. state government is responsible for enforcing labor law and administers unemployment benefits. The mission of the DoL is to protect workers and assist the unemployed and connect job seekers to jobs.
Situation: At the peak of COVID-19 in March 2020, the state faced an unprecedented increase in unemployment filings. The states citizens filed over 1.5 million unemployment insurance requests to obtain immediate benefits. This compares to typically 300,000 over an entire year. The result was a significant backlog and incredible pressure on the state to serve its citizens.
Solution and Benefits: In April 2020, the state deployed our platform, including Automation Hub, Studio, Orchestrator, and attended robots and unattended robots to address the backlog of unemployment insurance requests. Within one week, the state deployed 200 robots which reliably and accurately processed 300,000 unemployment claims in a single weekend. Following the success of the robots, the state turned to automation more broadly to meet the challenges of the pandemic and automated an additional 90 tasks, resulting in a cumulative 350 robots in operation. The most significant outcome was applied to fraud detection. The robots were able to save the state over $1 billion in fraudulent claims in just a few weeks.
Automation has become a catch phrase for anything that is not moving as fast as it should. It is not a replacement of our skilled workforce its more of an augmentation. In the space of IT that provides round-the-clock services, the robots help improve IT efficiency.Chief Technology Officer, U.S. State Government
Ernst & Young
Ernst & Young Global Limited, or EY, is a leading, global professional services organization with more than 270,000 employees. EY has a mission to transform work not only for its clients, but also for its employees. As part of EYs Next Wave strategy, EYs goal is to deliver automation to every EY employee desktop in order to improve its employee experiences by reducing the impact of excessive internal work hours required by legacy systems, delivering both cost and resource optimization, and increasing the productive time available to perform work for clients. A key part of this strategy was the roll out of a global SAP platform to all EY colleagues.
Situation: In 2019, EY set out to achieve its Next Wave strategy to deliver higher productivity and improve operational efficiency through utilization of new technologies. EY wanted to optimize leverage of its existing enterprise IT systems, such as SAP, and found that UiPaths automation platform could potentially deliver enterprise-wide digital transformation that could benefit clients, employees, and other stakeholders alike. EY continues to automate across its business utilizing UiPaths enterprise platform.
Solution and Benefits: EY utilized UiPath to automate internal manual processes common to EY employees which had previously required EY employees to utilize complex legacy systems. They used UiPath as an overlay on top of systems such as SAP in order to enhance usability, accelerate processing time, improve accuracy, and upskill employees in using automation technologies. EY estimates significant time has been saved for each client facing staff member, improving client utilization while creating a better employee experience by reducing mundane tasks which could be completed more quickly and accurately through automation. In addition, EY avoided significant training costs on legacy IT systems due to the ease of use of our platform on top of those
125
Table of Contents
systems. Finally, EY is further utilizing UiPaths platform throughout its business, such as utilizing UiPath Process Mining to reduce audit set-up times while increasing speed and accuracy for clients. In addition, there was previously a high cost to train employees to use different platforms which decreased substantially after implementing UiPath, resulting in significant training cost reduction.
EY wants to deliver transformation to its employees, leaders, and clients. The UiPath platform has enabled EY to accelerate its Next Wave strategy to deliver excellent benefits through digital transformation along with a better employee and client experienceEY Global Managing Partner, Enablement
Our Platform
Our platform is purpose-built to advance the next generation of automation. By addressing the complete lifecycle of automation, including identifying specific tasks and processes to automate, building and managing automation software robots, deploying them to execute processes, and measuring their business impact, our platform is intended to address a wide and diverse array of automation opportunities, including complex, long-running workflows. We believe our platform delivers compelling ease-of-use and intuitive user experiences through our low-code development environment and seamlessly integrates with an ever-expanding ecosystem of third-party technologies and enterprise applications without changing the existing infrastructure of an organization. In doing all of this, we enable businesses to redefine the relationship between enterprise applications and business processes.
Our platform encapsulates seven modular product pillars that together address the automation lifecycle within an enterprise:
| | Discover. Easily and accurately identifying the right processes to automate and how to emulate those processes across different types of end users is a challenge for all enterprises. Our Discover products combine AI with desktop recording, back-end mining of both human activity and system logs, and intuitive visualization tools, enabling users to discover, analyze, and identify unique processes to automate in a centralized portal. |
| | Build. Employees with no background in programming have lacked accessible tools to reduce manual tasks and make their jobs easier through automation. Our Build products are low-code development environments with easy-to-use, drag-and-drop functionality that users in an organization can learn to use to create attended and unattended automations without any prior knowledge of coding. We offer hundreds of out-of-the-box, pre-built activities and easy integration with a variety of proprietary and third-party AI/ML models, empowering users to start automating complex tasks immediately. |
| | Manage. Traditionally, robots, AI, and ML models were created and managed by specialized, siloed IT departments, which bottlenecked enterprise-wide deployment and impact of automation. The products in our Manage category offer centralized tools designed to securely and resiliently manage, test, and deploy automations and ML models across the entire enterprise, with seamless access, enterprise-grade security, and endless scalability of data. |
| | Run. Running automations in todays enterprise means smoothly integrating robots across a complex landscape of applications, systems, and users. With our Run products, an enterprise can deploy our robots in highly immersive attended experiences or in standalone, unattended modes behind the scenes, and can leverage hundreds of native connectors built for commonly used line-of-business applications such as those offered by SAP SE, Salesforce.com inc., and ServiceNow, Inc., and productivity tools such as Microsoft Office and Google G Suite. |
| | Engage. Engaging with automations was traditionally limited and relegated to only those who could build them. With our Engage products, there are multiple ways for users to remain connected and interact with robots, whether they are running in a data center, in the cloud, or right on their desktop. This capability allows our customers to manage long running processes that orchestrate work between robots and humans. From triggering robots to handling requests from robots, or consuming data that is surfaced by robots, people can easily remain a key part of the automated processes and launch, audit, and enhance automations. |
| | Measure. The success of automations in an enterprise is often evaluated by highly manual, disconnected methods, such as static spreadsheets. Our Measure products enable users to track, measure, and forecast |
126
Table of Contents
| the performance of automation in their enterprise. We provide out-of-the-box tools and visualization dashboards that can measure and quantify the return on investment of an automation program to allow for continuous improvement of automations and strategic alignment with business goals. |
| | Govern. Managing and governing automations across an enterprise used to require multiple tools, business units, and IT resources to ensure control. We offer powerful, centralized governance capabilities designed to help businesses ensure compliance with business standards. Our platform is designed to balance compliance with empowerment through granular control of what can be automated, who can build and publish automations, and complete lifecycle management with role-based access control and enforcement. |
Our platform is powered by the following key differentiating elements that are necessary for end-to-end automation within todays enterprise:
| | AI Computer Vision. Today, business processes are largely defined by the interaction between people and software UIs. Our robots are powered by a multi-pronged approach, combining proprietary computer vision technology that uses highly-trained AI with technical introspection of visual hierarchy to dynamically recognize and interact with constantly changing elements of on-screen documents, images, and applications. Combined with our differentiated ability to emulate a humans interactions with digital systems and UIs, our robots are designed to execute business processes with reliability, resiliency, and intelligence. |
| | Fully AI-Enabled Platform. We have purposefully infused our platform with AI to enable organizations to use our products easily and deeply embed AI into their core operations. We leverage AI to capture task and process data and scientifically identify the best opportunities for automation. Our out-of-the-box models help the robots process unstructured or semi-structured sources of information in a similar manner as human users. Our platform is designed to be open and interoperable with a diverse set of AI/ML technologies, including out-of-the-box, internally developed, and third-party AI models from our ecosystem of approximately 75 AI technology partners. We provide a simple, drag-and-drop product for businesses to upload domain-specific types of AI/ML model (e.g., loan underwriting or fraud detection) and import them into automations to address more advanced, cognitive use cases. |
| | Document Understanding. We combine our proprietary computer vision technology with optical character recognition, or OCR, natural language processing, or NLP, and a variety of ML technologies to classify and extract data from unstructured, semi-structured, and structured documents and images, handwriting, and scans. This gives our robots the ability to handle entire processes, with humans only needed to validate data or handle exceptions. Our document understanding capabilities leverage extensibility of our core platform to plug-and-play third-party domain (or language) specific ML models and are designed to achieve the highest value and accuracy for our customers. |
| | Low-Code Development Experiences. Our platform is built to be intuitive and easy to use with low-code, drag-and-drop development tools and interfaces that knowledge workers can understand, making it easier for everyone, from non-technically oriented workers to professional developers, to build and deploy robots. |
| | Widespread and Rich Human and Robot Interaction. Our platform facilitates a broad array of interactions between humans and robots, allowing users to easily engage with robots when, where, and how they want. From a simple-to-use robot assistant on peoples desktops that serves as a hub for executing and managing automations to robots seamlessly requesting approvals for workflows that require human intervention through rich and engaging user experiences, we give enterprises the ability to engage employees throughout the enterprise and significantly expand the impact of automation. |
| | Enterprise-Grade Governance and Security. As enterprises expand their usage of automation, a robust ability to govern and maintain the performance and security of multiple robots at scale is critical. We |
127
Table of Contents
| deliver centralized governance and data security capabilities built for businesses to securely and resiliently deploy and manage automations at enterprise scale. |
| | Open and Extensible Platform Architecture. Our platform delivers both UI automation and API integration on a single platform. We offer hundreds of out-of-the-box, native integrations with a wide range of enterprise applications and productivity tools from our technology partners. Our platform features built-in, customizable, and shareable automation components that serve as building blocks for users to quickly and easily build automations. Our open and extensible architecture is designed to allow our platform to work seamlessly across lines of businesses and with numerous combinations of enterprise applications, without the need for significant IT resources, invasive implementation or changes to existing infrastructure. |
| | Flexible Deployment. We have built our platform to be multi-tenant and deployable across on-premises, private and public cloud, and hybrid environments to meet any level of scaling, availability, and infrastructure requirements. We also offer our own hosted SaaS Automation Cloud for customers that want us to manage their infrastructure. |
UiPath Community
We have created and cultivated a vibrant, global network of nearly 1.0 million automation professionals who are building and sharing automations that are transforming work and their organizations. Over 800,000 users are enrolled in UiPath Academy, our online training platform that offers free, unlimited access to learning plans based on various automation-related job roles. More than 750 universities and colleges are in our Academic Alliance program, which gives professors free automation curriculum to teach automation skills to future generations. Over 83,000 users participate in the UiPath Forum, where our users go to ask questions, get help, and share ideas. More than 7,000 unique users globally have attended over 200 online UiPath Community meetups in 2020. Our third annual developer conference, held virtually in 2020, attracted 20,100 developers from over 100 countries around the world. We have a number of highly engaged advocates, including 3,900 individuals from our customers and partners who influence product direction as part of the Insiders Program, and a carefully vetted group of 20 Most Valuable Professionals who contribute to the community through content creation, speaking, and other ambassadorship programs.
Core Personas on Our Platform

We take an inclusive approach to automation as we firmly believe that every single person in an enterprise should be able to leverage and easily engage with automation to make their jobs easier and more enjoyable. Our platform is designed to address the diverse needs of varying levels of expertise and job functions in todays enterprise. Because our platform can impact everyone in an organization, the decision to onboard our platform elevates above the IT organization to the board room. The stakeholders of our platform fall into the following categories:
| | Process Analysts. Through our Discover products, we give process analysts the tools to better understand and analyze distinct business processes and empower them to optimize processes through automation. |
128
Table of Contents
| | Automation Developers. Professional automation developers benefit from our platforms underlying power in developing complex automations that flexibly bring together a variety of activities, integrations, and ML models. |
| | Citizen Developers. Employees benefit from the ease-of-use of our Build products, empowering them to automate tasks that are relevant to both them and broader teams. |
| | IT Professionals. Our platform unburdens IT professionals through extensive administrative capabilities that enable seamless delivery, reliable governance, and secure management of automation programs. |
| | Center of Excellence Leads. COE leads are responsible for managing, orchestrating, and maintaining the virtual workforce within an enterprise, and leverage our Measure and Govern products to continuously improve robot performance and resource allocation. |
| | Employees and Business Users. Automations can be deployed directly to the desktop of any employee within an organization, where employees with little-to-no technical knowledge can easily use automations directly in their workflows. |
| | Business Analysts. With our Measure products, business analysts can evaluate the impact of automation across the business through a variety of customizable key performance indicators relevant to their needs. |
Our Products
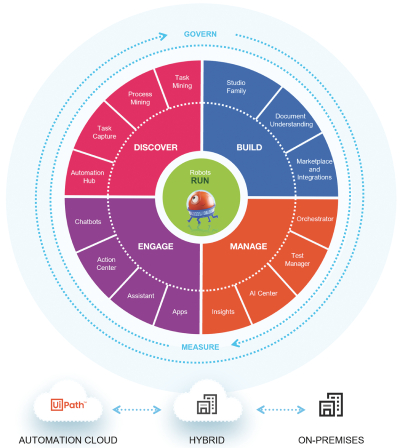
Our platform is built to span the entire automation lifecycle. Our products are designed to be modular. Customers adopt our products as a unified solution or use a subset of our products.
129
Table of Contents
Discover
| | Automation Hub. UiPath Automation Hub is a command center that enables an organizations COE to easily source, manage, and control the automation pipeline in one place. Automation Hub includes tools for engaging and rewarding top contributors of automations and dashboards for visualizing automation complexity and measuring return on investment, and creates a repository for automation components to fast-track development by uploading, curating, and publishing reusable components. |
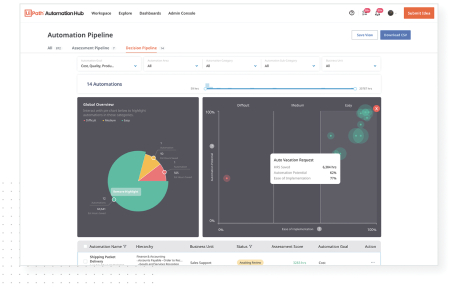
| | Process Mining. UiPath Process Mining has a built-in extract, transform, load, or ETL, layer that can natively extract, transform, and log data from business applications and productivity tools (for example, enterprise resource planning and customer relationship management applications) to get a thorough understanding of a business processes. Through powerful analysis and visualizations, users gain full visibility into variances in process execution, identify root-cause issues, and discover opportunities to improve their business operations through process improvements and automation. |
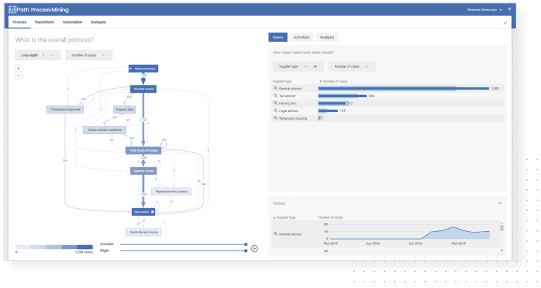
130
Table of Contents
| | Task Capture. UiPath Task Capture allows employees to document processes on their computers by simply hitting record. As the user performs a process they would like to automate, Task Capture gathers data for each step, including step timing and the total number of applications, as well as the underlying UI selectors. Our software automatically generates a fully editable process map from the recorded data, and pulls the inputs together into a process definition document or XAML file that is instantly ready for development teams to finalize the corresponding automation. |
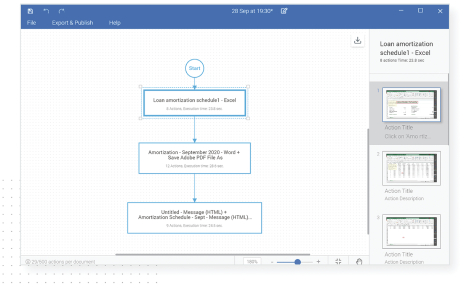
| | Task Mining. We are currently developing UiPath Task Mining, which will allow enterprises to record work that is performed by users across an allowed list of applications. The software will automatically aggregate the anonymized recorded process data across multiple users and then apply AI to tease out frequent task patterns and identify processes that are candidates for automation. The COE will then be able to easily prioritize the automation pipeline using computed estimates for potential savings and ease of automation. UiPath Task Mining is now in Public Preview, and we expect to broadly release the product in 2021. |
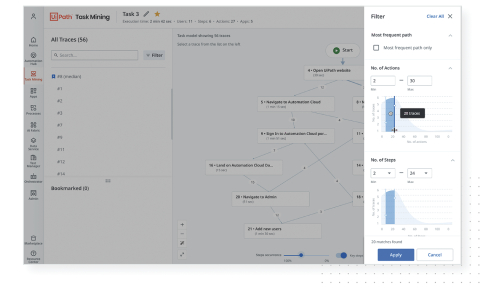
131
Table of Contents
Build
| | StudioX. UiPath StudioX is our low-code, drag-and-drop, citizen development platform empowering employees to automate tasks for themselves and their immediate teams. A friendly and familiar interface coupled with easy integration into Microsoft Office and pre-designed templates and scenarios enable employees throughout an organization to build automations without prior knowledge of programming or coding. StudioX works with virtually every web and desktop application, recognizes text, images, and fields, and can switch across applications to perform insertions, extractions, and more to automate everyday tasks. |
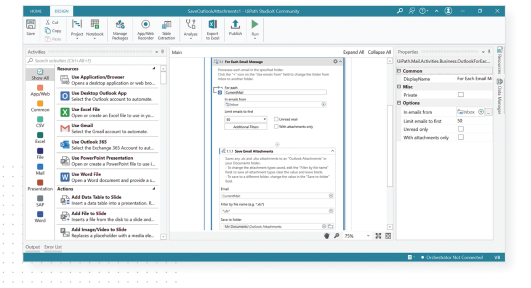
| | Studio. UiPath Studio is an easy to use, drag-and-drop development platform designed for RPA developers looking to build complex process automations with built-in governance capabilities. Studio features robust debugging tools, API automation, wizards to automate desktop or web applications, the ability to leverage custom code, and a simple way to integrate ML models into production workflows. |
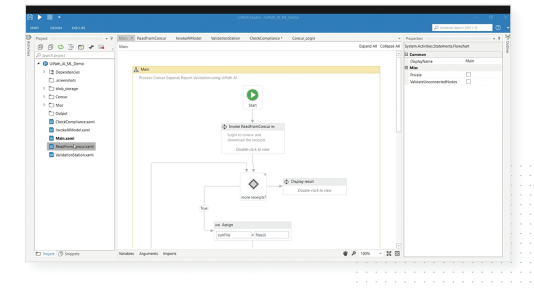
132
Table of Contents
| | Studio Pro. UiPath Studio Pro is our most advanced Studio IDE (integrated development environment) designed for specialized developers. Studio Pro contains all of the capabilities included in Studio as well as additional testing capabilities, supporting both RPA and application test development. |
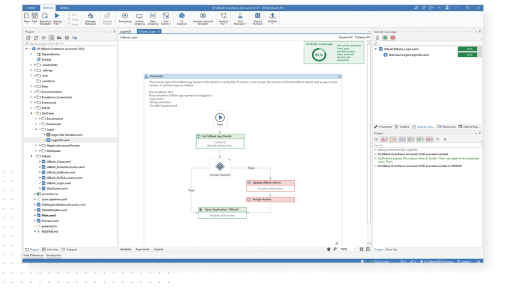
| | Document Understanding. Without document understanding capabilities, automated workflows require humans to step in and process documents manually. UiPath Document Understanding leverages AI to enable software robots to extract, interpret, and process data from structured, semi-structured, and unstructured documents. Our robots embed ML models, enabling them to improve accuracy and efficiency over time, reducing the risk of errors and the need for, and costs associated with, manual document processing. |
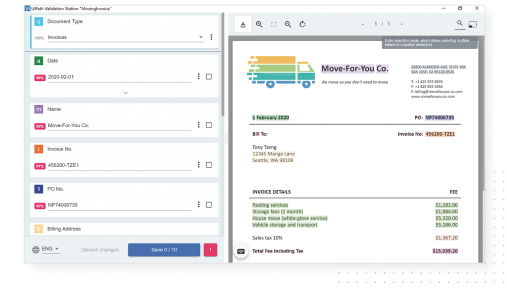
| | Marketplace. Our Marketplace offers automation solutions to accelerate unique enterprise workflows. Organizations and their employees can access over 1,200 vetted, pre-built, and reusable automaton activities and components developed by our employees, customers, partners, and students with |
133
Table of Contents
| approximately 10,000 user-initiated downloads per month. Users can download components from the UiPath Marketplace and access user guides, videos, and documentation to help speed the deployment of automation within their enterprise for multiple industries and use cases. All components are reviewed and approved by UiPath for security, functionality, and quality to help enterprises rapidly implement automations and save development time and costs. |
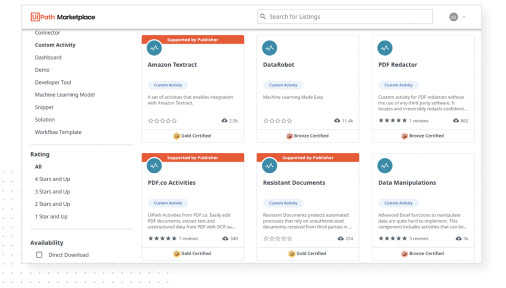
Manage
| | Automation Cloud. The UiPath Automation Cloud is our multi-tenant, SaaS delivery option that enables enterprises to start automating instantly and scale without upfront hardware and infrastructure costs. With the UiPath Automation Cloud, organizations can scale as needed without the expense and complexity of managing their own infrastructure while also benefitting from frequent delivery of the latest versions and newest features, and world-class security and compliance certifications. |
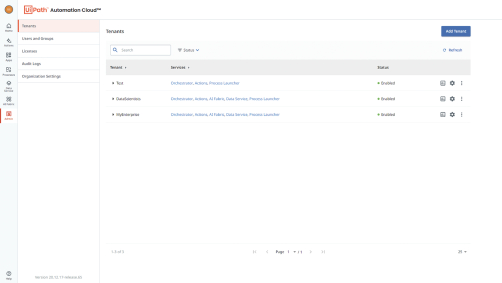
134
Table of Contents
| | Orchestrator. The UiPath Orchestrator is designed to be the heart of an enterprises automation management, giving an organization the power to provision, deploy, trigger, monitor, measure, and track the successful operation of a businesss robots from any supported device. The UiPath Orchestrator tracks and logs robot activity, along with what people do in tandem to maintain strict compliance and governance through dashboards and visualization tools. Orchestrator enables seamless integration with the UiPath Marketplace, software, and third-party products, giving the opportunity to leverage our global RPA community and deploy automations across cloud, on-premises, and hybrid environments. |
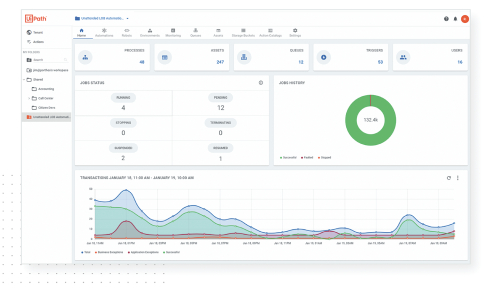
| | AI Center. UiPath AI Center bridges the gap between data scientists and automation, enabling organizations to integrate and deploy their own ML models, pre-built UiPath models, or custom models from a UiPath partner or other third-party into their workflows. AI Center eases the complexity of deploying, consuming, managing, and improving ML models, all with visibility and control over how, when, and where AI models are being used across the enterprise. AI models can be easily and seamlessly inserted into different processes via drag-and-drop in UiPath Studio to automate cognitive workflows with ease, broadening the scope of automation beyond simple use cases. |
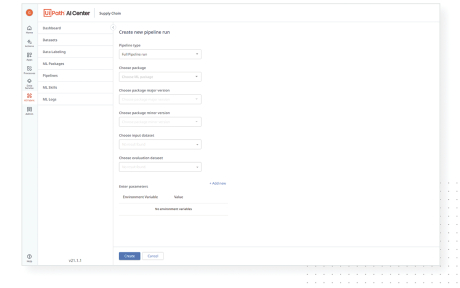
135
Table of Contents
| | Test Manager. UiPath Test Manager automates and centralizes testing to improve the quality of automations and applications before they go live, whether testing RPA workflows, web applications, enterprise applications, or mobile applications. UiPath Test Manager offers a web-based interface to expedite comprehensive test planning, requirements traceability, and defect reporting, and is seamlessly integrated with Atlassian Jira. |
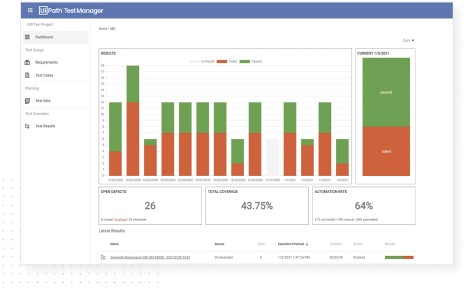
| | Insights. UiPath Insights is an RPA analytics solution that tracks, measures, and forecasts the performance of a single automation to the entire automation program through dashboards and one-click drilldowns. UiPath Insights offers tools to share reports with key stakeholders across the company and gives teams access to self-service analysis and custom reporting. Organizations can view historical trends to forecast performance, create smart alerts and custom reports for goals, critical events, and major milestones, as well as track and troubleshoot process exceptions and bottlenecks. |
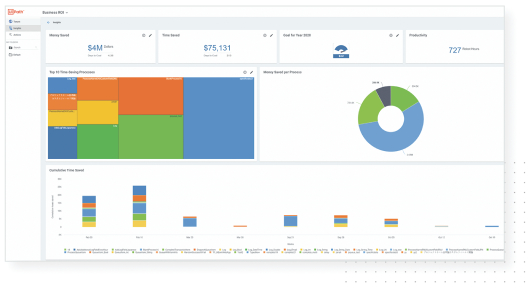
136
Table of Contents
| | Data Service. UiPath Data Service is a cloud-based data service that provides low-code data modeling and storage capabilities to centrally model, manage, and store automation data directly in our platform with enterprise-grade security. Data Service creates a single data source combining information from enterprise and legacy systems, databases, documents, and other custom applications, and enables enterprises to adapt to growing user and data volumes and changes to business processes and infrastructure. |
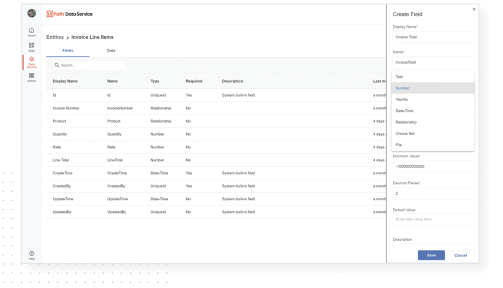
Run
| | Attended Robots. Attended robots work side-by-side with people, handling workflow tasks as specified and running either on command or based on pre-defined triggers. People interact with their attended robot via the UiPath Assistant described below. |
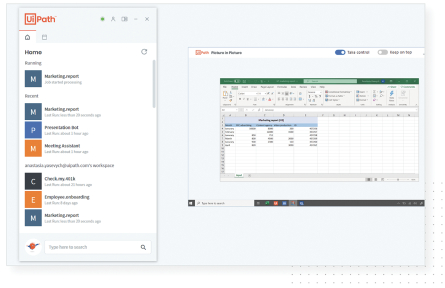
137
Table of Contents
| | Unattended Robots. Unattended robots are designed to work independently and can handle complex, long-running processes. Despite often working in the background, unattended robots can easily involve people as needed to validate information, handle exceptions, or simply to notify them that a task has been completed. |
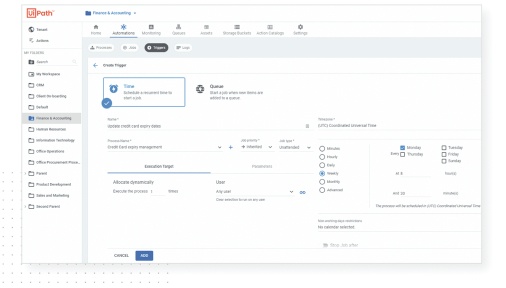
| | Test Robots. Test robots run test automations for both RPA testing and application testing. |
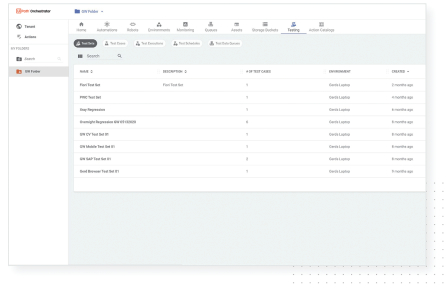
138
Table of Contents
Engage
| | Assistant. The UiPath Assistant is an application that enables users to view, manage, and set reminders for automations, as well as request to start or stop jobs and change settings based on user inputs. Although specifically designed for attended use, UiPath Assistant has no limits to what processes can be changed and is seamlessly connected with UiPath Orchestrator for starting new jobs. |
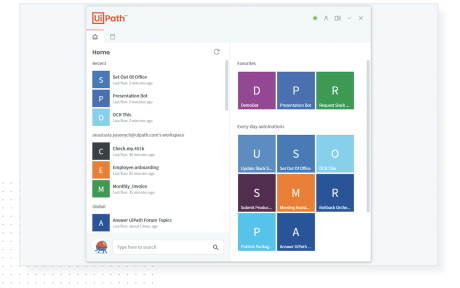
| | Action Center. When an automation includes decisions that humans should makesuch as approvals, escalations, and exceptionsUiPath Action Center enables robots and people to collaborate more efficiently and effectively. Action Center puts humans in the loop when needed, making it easy for robots to handoff requests to humans and pick up the automation again when the request is fulfilled, effectively combining multiple automated processes into longer, complex workflows. Users access Action Center through a central portal where they can see all their tasks and supporting documents, take actions, and pass the job back to a robot. |
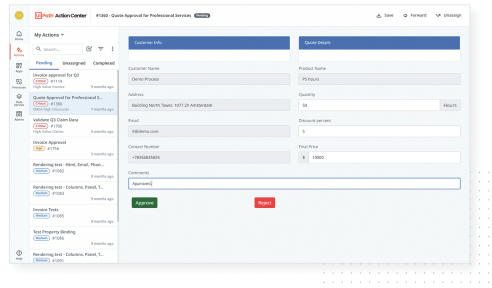
139
Table of Contents
| | Chatbots. UiPath Chatbots enable users to trigger robots to accomplish tasks through conversational interfaces, social messaging apps, and even voice channels. We have natively integrated leading chatbot providers with the UiPath Platform so that users can build conversational automations across over 40 languages. UiPath Chatbots enable efficient interaction with customers and free employees from having to open, enter, and exit dozens of applications and enterprise systems each day. Our open platform offers direct integration with other leading enterprise chatbots to match an organizations specific technology stack. |
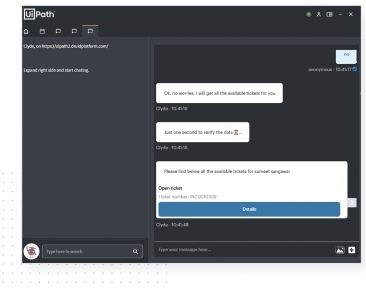
| | Apps. UiPath Apps enables users to easily develop a purpose-built presentation layer that acts as the interface between people and robots. Serving as a single launchpad, users leverage Apps to interact with multiple automations at once, both triggering automations as needed, and aggregating the results of those automations in real-time. Apps are designed using a low-code designer, and can be used from any supported device, allowing people to leverage automation as needed, whether from a workstation desktop, tablet, or mobile phone. |
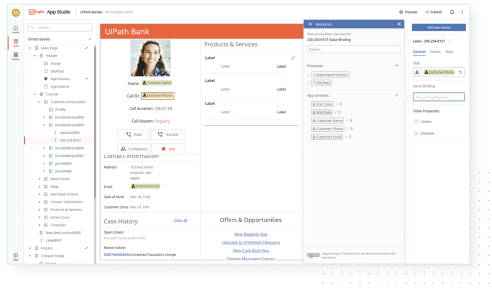
140
Table of Contents
Measure
| | The success of automations was previously commonly evaluated by multiple, static spreadsheets held by IT developers. Our Measure products enable users to track, measure, and forecast the performance of automation in their enterprise. We provide out-of-the-box tools and visualization dashboards that can measure and quantify the return on investment of an automation program to allow for continuous improvement of automations and strategic alignment with business goals. The primary driver of measurement is our Insights product, however measurement features are embedded across our platform. |
Govern
| | We offer powerful, centralized governance capabilities designed to ensure compliance with business standards. Our platform balances compliance with empowerment through granular control of what can be automated, who can build and publish automations, and complete lifecycle management with role-based access control and enforcement. Governance capabilities are embedded across our platform. The combination of our measurement and governance capabilities are critical as they are key to enterprise-scale automation programs and are a differentiated feature of our platform. |
Sales and Marketing
We have made significant investments in our sales and marketing efforts globally. As of January 31, 2021, our sales and marketing organization was comprised of 1,409 employees including our field sales organization, which maintains a physical sales presence in every major, global software market including each of the top 20 software markets around the world. Our global go-to-market strategy has enabled us to establish a geographically diverse revenue and customer base with meaningful contributions across the Americas, Europe, Middle East, and Africa, or EMEA, and Asia Pacific and Japan, or APJ. Our sales and marketing strategy is focused on driving growth through selling products to new customers and driving expansion within our existing customers. Our Chief Revenue Officer, together with our sales, marketing, and executive teams, promote our global brand by working to cultivate long-term relationships with current and prospective customers, expand our partnership network and foster our developer community.
We sell our solution through a direct sales team and through channel partnerships. Our sales organization is segmented into three areas: enterprise sales sells to large businesses and public sector organizations; high-velocity inside-sales is focused on landing a high volume of new small and mid-sized customers; and a global strategic sales team focused on the largest strategic global accounts. Additionally, our sales team is supported by our renewals team that is focused on identifying upsell potential for our sales team and handling the operations behind the renewal. In agreement with the sales team, they can also help execute on small upsells so that our field sellers can focus on the larger opportunities. Supplementing our direct sales organization are channel sales partnerships with system integrators, regional developers, business process outsourcing providers and distributors. Our channel partners enable us to extend our local and global reach, in particular with smaller customers and in geographies where we have less direct sales presence. Additionally, our customer success team on-boards new customers and accelerates expansion within our largest customers. Our enterprise and high velocity teams are organized regionally across Americas, APJ, and EMEA. In certain geographies, we maintain specialized vertical teams within our enterprise sales organization that concentrate their efforts on selling into banking and financial services, healthcare, and government entities. Our sales organization is supported by a team of pre-sales engineers and our professional services organization that offer technical expertise to help customers speed adoption and return on investment.
We sell to organizations of all sizes across a broad range of industries, with a focus on enterprise customers. Our go-to-market strategy is focused on a land-and-expand model. Our ability to expand within our existing customer base is facilitated by the breadth of our platform. Our customers frequently see rapid time to value with our products, and we are able to quickly expand sales within organizations as customers add features, expand use cases and increase the number of software robots beyond their initial deployment. The potential for broad
141
Table of Contents
applicability of the UiPath platform enables us to sell across all levels of an organization, from the C-Suite to the IT department, and to sell into multiples departments within an enterprise, which reduces friction for expansion of our products across the enterprise.
Our marketing team drives brand awareness, cultivates a large and growing community, and drives demand through a combination of global and local campaigns. We employ a variety of marketing tactics to reach prospective customers, including community evangelism, in-person and digital events, content marketing, digital advertising, search optimization, partner marketing, social media, and public relations. We host and present at regional and global events, including our Forward, Together and DevCon conferences, and our UiPath Live! and virtual Reboot Work Festival, which both launched during the COVID-19 pandemic, to share customer success stories, developer breakthroughs, and analyst insights and to deepen customer relationships.
A key marketing objective is to have prospective customers try our software. We provide easy access to our software through our Community Edition and Enterprise Trial, both available on-line. This try-before-you-buy strategy has been a key driver of developer education and future customer purchases of our products and platform. To democratize automation, we offer a free Community Edition to small businesses, university students, and individuals. Our Enterprise Trial edition, which is a time-limited license, provides prospective customers with full functionality of our platform to learn, build, and deploy automations. We nurture users through their trial license by providing training and certifications through our Academy, detailing best practices and use cases, and offering continuous support through our interactive forum or pre-sales organization.
Our Culture
We believe our culture and values are critical to our success and have delivered tangible financial and operational benefits to our customers, employees, and stockholders. Early on in our companys history, we decided to make humility at the center of our values. While humility is a muscle to be trained, we believe it should come through in everything we do.

We complement humility with three other core tenets in our culture: Be Bold, Be Immersed, Be Fast. Together, our four values are exemplified as follows:
| | Be Humble listen, learn, help |
Being humble is listening and being open to learn in everything that we do, even that at which we already excel. We expect to get our hands dirty and to do whatever it takes to drive innovation.
We encourage everyone to speak up, and we all listen and help each other. Everybody at UiPath can impact this organization with great ideas, and our leaders are, before all else, listeners.
| | Be Bold challenge, seek, explore |
We need to be able to jump right in and start taking smart risks. We are making a real impact on the world, and thus risk-taking stems not from bravery but from responsibility.
142
Table of Contents
Bold does not mean loud.
It means believing in what you do and doing it with conviction. It means pushing boundaries, challenging each other to be better, and having the courage to explore the unknown. Healthy debates help us understand each other better and remain open to even greater possibilities. They also create contexts for innovation.
| | Be Immersed consider, reflect, imagine |
Imagine a different way of working and a different world. Our mission is to make it real.
We are fully engaged in what we are doing, we are extremely passionate, and we have a sense of ownership.
Thats why, in order to achieve our ambitious purpose, we need to allow ourselves to consider different paths and give ourselves space for reflection and ideation. This keeps us moving towards excellence.
| | Be Fast act, preempt, experiment |
Our world is in perpetual motion and so is UiPath. We constantly renew, rethink, and reinvent to create something better. We build what comes next. We move to improve.
We accelerate our efforts so that we can innovate and evolve with speed.
We are constantly experimenting. Thats why we expect failure and, when that happens, own up to it and learn from it.
In addition to our four values, we believe open and transparent communications are critical to a high-performing business. And, our employees must feel that they work in a psychologically safe environment.
We are determined to always act quickly to best serve our customers and partners, deliver on our product platform vision, and to create a better place to work.
Social Responsibility and Community Initiatives
We live our values at UiPath. Be Humble: we listen, learn and help others. Be Bold: we challenge, seek, and explore. Be Immersed: we consider, reflect, and imagine. Be Fast: we act, preempt, and transform. These values describe our aspirations from a cultural perspective at our global company. They express how we drive our business. Finally, they reflect what we want to do for the global community of which we are a part. We aim to make work more meaningful as we help accelerate human achievement.
This is reflected in our desire to improve our communities by bringing our technology to underserved areas. For instance, through the UiPath Bridge program, one of our charity-focused initiatives, we have partnered with The New York Foundling, one of New York Citys oldest and largest child welfare agencies, to provide our platform to the agencys clinicians allowing them to spend more time with children and less time in front of their computer screen. Through our global Automation for Good Program, we have also worked with governments during the COVID-19 pandemic to deploy our technology to assist governments, hospitals, and non-profit organizations to improve citizen response, free health care workers to spend more time with patients, and accelerate mission objectives the world over. Additionally, through our other corporate social responsibility programs, we bring automation into schools to help underserved communities thrive in the digital economy, and we use our technology to minimize our own environmental impact and protect natural resources around the world. We have also established the UiPath Foundation, through which we aim to provide children living in poverty with the skills and tools necessary to reach their potential.
143
Table of Contents
At UiPath, we aim to change the status quo for both our customers and society as a whole. In furtherance of our values and this goal, we are joining the Pledge 1% movement, and are committing to donate 2,810,082 shares of our Class A common stock (representing approximately 0.5% of our fully-diluted capitalization immediately prior to this offering) over the next ten years to fund our social impact and environmental, social, and governance initiatives. Additionally, we intend to donate up to $0.6 million of the net proceeds of this offering for charitable purposes. We plan to continue to commit our time and platform, in addition to our equity and resources, to support our initiatives. We are committed to our social, educational, and philanthropic efforts, and we seek to promote the use of automation to encourage people to strive to learn more, do more, and have more fulfilling careers. We believe this commitment will help to make automation a force for good across our world.
Partnerships
We develop and maintain business and technology partnerships that help us seamlessly integrate the latest technology into our platform and market and deliver our platform to our customers around the world.
Our business partners include more than 3,700 global and regional system integrators, value-added resellers, and business consultants. We provide tiering recognition through Diamond, Gold, Silver, and Registered levels for partners that meet competency requirements and deliver and maintain a specified number of satisfied customers. These partnerships enhance our market presence and drive greater sales efficiencies.
Our technology partners bring specialized capabilities to our platform. In collaboration with our technology partners, we develop integrations that simplify the interoperability of our platform with their technology, resulting in faster time-to-value. These integrations give our customers more choices on how they integrate and offer a low-code option of traditional native integration. Examples of integrations available to our customers built by our partners or by us in collaboration with partners include integrations with offerings from Amazon Web Services Inc., Adobe Inc., Alteryx, Inc., Box, Inc., International Business Machines Corporation, Microsoft Corporation, Oracle Corporation, Salesforce.com, inc., SAP SE, ServiceNow, Inc. and Workday, Inc.
We also drive innovation with leading AI technology partners that specialize in OCR, NLP, and custom ML and AI algorithms that are additive to our platform and can enhance the long-term business outcomes for our customers automations. We also maintain partnerships with leading cloud vendors, such as Amazon Web Services Inc., Google Inc., and Microsoft Corporation, to simplify both the deployment of our platform and to extend our platform to offer customers the benefits of cloud-based AI capabilities.
Our partnerships with other leading technology companies power the significant extensibility of our platform and offer our customers the ability to use the technologies of their choice on our platform, driving increased customer affinity and product stickiness.
Competition
The market for RPA is one of the fastest growing enterprise software markets and is increasingly competitive. We believe our competitors primarily exist across the across the following three categories:
| | RPA software providers¸ which provide RPA platforms, but lack end-to-end automation capabilities. |
| | Automation lifecycle enhancing technology providers, such as low-code, iBPMS, iPaaS, process mining, and test automation vendors, which provide additional features that can be useful for automations. We have alliances and integrate with the key vendors in each category, but they often develop and market automation capabilities as extensions of their core platforms. |
| | Enterprise platform vendors, which provide horizontal applications and productivity tools and are acquiring, building, or investing in RPA functionality or partnering with RPA providers. |
See the section titled Risk FactorsRisks Related to Our Business, Products, Operations, and IndustryThe markets in which we participate are competitive and, if we do not compete effectively, our business, financial condition, and results of operations could be harmed for a description of the risks related to our competition in our industry.
144
Table of Contents
Intellectual Property
Intellectual property rights are important to the success of our business. We rely on a combination of patent, copyright, trademark, and trade secret laws in the United States and other jurisdictions, as well as license agreements, confidentiality procedures, non-disclosure agreements with third parties, and other contractual protections, to protect our intellectual property rights, including our proprietary technology, software, know-how, and brand.
As of January 31, 2021, we held four issued patents, three U.S. patents, and one South Korean patent. We also had 129 pending patent applications in the United States, including one allowed U.S. patent application, 60 PCT pending patent applications, and 148 pending patent applications in other jurisdictions. Our issued patents are scheduled to expire between October 2039 and February 2040. As of January 31, 2021, we held eight registered U.S. trademarks, seven pending U.S. trademark applications, and more than 500 active foreign trademark filings. As of January 31, 2021, we held 49 domain names in the United States and in foreign jurisdictions. We continually review our development efforts to assess and identify the existence and patentability of new intellectual property.
The terms of individual patents extend for varying periods of time, depending upon the date of filing of the patent application, the date of patent issuance, and the legal term of patents in the countries in which they are obtained. Generally, patents issued for applications filed in the United States are effective for 20 years from the earliest effective filing date of a non-provisional patent application. The duration of patents outside of the United States varies in accordance with provisions of applicable local law, but typically is also 20 years from the earliest effective filing date. However, the actual protection afforded by a patent varies on a country-to-country basis and depends upon many factors, including the type of patent, the scope of its coverage, the availability of legal remedies in a particular country, and the validity and enforceability of the patent.
Although we rely on intellectual property rights, including patents, copyrights, trademarks, and trade secrets, as well as contractual protections to establish and protect our proprietary rights, we believe that factors such as the technological and creative skills of our personnel, development of new services, features, and functionality, and frequent enhancements to our platform are equally essential to establishing and maintaining our technology leadership position.
We control access to and use of our proprietary technology and other confidential information through the use of internal and external controls, including contractual protections with employees, contractors, customers, and partners. We require our employees, consultants, and other third parties to enter into confidentiality and proprietary rights agreements and we control and monitor access to our software, documentation, proprietary technology, and other confidential information. Our policy is to require all employees and independent contractors to sign agreements assigning to us any inventions, trade secrets, works of authorship, developments, processes, and other intellectual property generated by them on our behalf and under which they agree to protect our confidential information. In addition, we generally enter into confidentiality agreements with our customers and partners. See the section titled Risk FactorsRisks Related to Our Intellectual Property for a description of risks related to our intellectual property.
Government Regulation
Our business is and will continue to be subject to extensive U.S. federal and state and foreign laws and regulations, including laws and regulations involving privacy, data protection, security, intellectual property, competition, taxation, anti-corruption, anti-bribery, anti-money laundering, and other similar laws. Many of these laws and regulations are still evolving and are likely to remain uncertain for the foreseeable future, and these laws and regulations can vary significantly from jurisdiction to jurisdiction. The costs of complying with these laws and regulations are high and likely to increase in the future. Further, the impact of these laws and regulations may disproportionately affect our business in comparison to our competitors that have greater resources.
145
Table of Contents
In the United States, we are subject to data security and privacy rules and regulations promulgated under the authority of the Federal Trade Commission, the Electronic Communications Privacy Act, the Computer Fraud and Abuse Act, the California Consumer Privacy Act of 2018, or CCPA, and other state and federal laws relating to privacy and data security. The CCPA requires covered businesses to provide new disclosures to California residents and to provide them new ways to opt-out of the sale of personal information, and provides a private right of action and statutory damages for data breaches. Other jurisdictions in the United States are beginning to propose laws similar to the CCPA.
As a result of our international operations, we must comply with a multitude of data security and privacy laws that may vary significantly from jurisdiction to jurisdiction. Virtually every jurisdiction in which we operate has established or is in the process of establishing data security and privacy legal frameworks with which we or our customers must comply. Our failure to comply with the laws of each jurisdiction may subject us to significant penalties. For example, the data protection landscape in Europe, including with respect to cross-border data transfers, is currently unstable and other countries outside of Europe have enacted or are considering enacting cross-border data transfer restrictions and laws requiring local data residency.
For a discussion of the various risks we face from regulation and compliance matters, see the sections titled Risk FactorsRisks Related to Data Privacy and Cybersecurity and Risk FactorsRisks Related to Regulatory Compliance and Governmental Matters.
Legal Proceedings
From time to time, we are involved in various legal proceedings arising from the normal course of business activities. We are not presently a party to any litigation the outcome of which, we believe, if determined adversely to us, would individually or taken together have a material adverse effect on our business, operating results, cash flows or financial condition. Defending such proceedings is costly and can impose a significant burden on management and employees. The results of any current or future litigation cannot be predicted with certainty, and regardless of the outcome, litigation can have an adverse impact on us because of defense and settlement costs, diversion of management resources, and other factors.
Facilities
Our corporate headquarters is located in New York, New York, where we lease approximately 21,350 square feet pursuant to a lease that expires in December 2023. We have other office locations both inside and outside the United States. Our offices outside the United States include offices in Romania, Japan, India, the Netherlands, and other countries. These offices are leased, and we do not own any real property. We believe that our current facilities are adequate to meet our current needs.
Employees and Human Capital Resources
Our strongest asset is the human capital that we have been able to attract, retain, and motivate. We were recognized as one of Inc.s Best Workplaces for 2020 and we won six Best Company awards from Comparably in 2020, including awards for Happiness, Professional Development, and Leadership. As a result, we attract exceptionally talented, highly educated, experienced, and motivated employees. Our human capital resources objectives include, as applicable, identifying, recruiting, retaining, incentivizing, and integrating our existing and additional employees. The principal purposes of our equity and other incentive plans are to attract, retain, and motivate selected employees, consultants, and directors through the granting of stock-based compensation awards and cash-based performance bonus awards.
As of January 31, 2021, we had a total of 2,863 full-time employees. Of our employees, 714 were engaged in research and development. 122 full-time employees were based at our headquarters in New York, New York, and 727 full-time employees were based in Bucharest, Romania. We are subject to, and comply with, local labor law requirements in all countries in which we operate. Some countries, such as France, Italy, and Brazil, may
146
Table of Contents
automatically make our employees subject to industry-wide collective bargaining agreements. Other countries in which we operate require our employees to have a representation organism. For example, in France and the Netherlands, the interests of our employees are represented by an employees representative and a works council, respectively. We comply with the applicable legislation regarding the involvement of these representation organisms and we have a good relationship with them. We consider our employee relations to be good and we have not experienced any work stoppages.
147
Table of Contents
The following sets forth information, as of January 31, 2021, regarding our current executive officers and directors.
| Name |
Age | Position |
||||
| Executive Officers: |
||||||
| Daniel Dines |
49 | Chief Executive Officer, Co-Founder, and Chairman | ||||
| Ashim Gupta |
42 | Chief Financial Officer | ||||
| Brad Brubaker |
57 | General Counsel and Chief Legal Officer | ||||
| Thomas Hansen |
50 | Chief Revenue Officer | ||||
| Ted Kummert |
57 | Executive Vice President of Product and Engineering | ||||
| Non-Employee Directors: |
||||||
| Philippe Botteri |
47 | Director | ||||
| Carl Eschenbach |
54 | Director | ||||
| Michael Gordon |
51 | Director | ||||
| Kimberly L. Hammonds |
53 | Director | ||||
| Thomas Mendoza |
70 | Director | ||||
| Daniel D. Springer |
57 | Director | ||||
| Laela Sturdy |
43 | Director | ||||
| Jennifer Tejada |
50 | Director | ||||
| Richard P. Wong |
51 | Director | ||||
Executive Officers
Daniel Dines is our Co-Founder and has served as our Chief Executive Officer and Chairman of our board of directors since October 2005. Before founding UiPath, Mr. Dines was a software development engineer at Microsoft Corporation. Mr. Dines holds an M.S. from the University of Bucharest. We believe that Mr. Dines is qualified to serve on our board of directors because of his leadership in conceptualizing and developing our brand and business, his software development expertise and his extensive knowledge of our industry.
Ashim Gupta has served as our Chief Financial Officer since November 2019 and served as our Chief Customer Success Officer from February 2018 to November 2019. Prior to joining UiPath, Mr. Gupta served in various roles at General Electric Company from January 2000 to February 2018, including most recently as Senior Vice President and Chief Information Officer for Finance and Global Operations from March 2016 to February 2018, and as Chief Financial Officer of GE Water from August 2013 to March 2016. Mr. Gupta holds a B.A. from Rutgers University.
Brad Brubaker has served as our Chief Legal Officer since April 2019. Prior to joining UiPath, Mr. Brubaker served in various roles at SAP SE, an enterprise software company, from April 1994 to April 2019, including most recently as General Counsel-Global Field from July 2008 to April 2019. Mr. Brubaker holds a B.S. from Albright College and a J.D. from Temple University.
Thomas Hansen has served as our Chief Revenue Officer since April 2020. Prior to joining UiPath, Mr. Hansen served as Senior Vice President of Operations, Carbon Black Security Division at VMware, Inc., a software company, from October 2019 to April 2020. Until its acquisition by VMware in October 2019, Mr. Hansen served at Carbon Black, Inc., a cybersecurity company, as Chief Operating Officer and Executive Vice President from October 2018 to October 2019 and Chief Revenue Officer and Executive Vice President from July 2017 to October 2018. Previously, Mr. Hansen served as Global Vice President of Revenue for Dropbox, Inc., a cloud computing company, from August 2015 to July 2017. Mr. Hansen holds a B.S. and an M.S. from the Copenhagen Business School.
148
Table of Contents
Ted Kummert has served as our Executive Vice President of Product and Engineering since March 2020. Mr. Kummert has also served as a Venture Partner at Madrona Venture Group, an investment company, since October 2017. Mr. Kummert served as Executive Vice President of Products and Engineering for Apptio Inc., an enterprise software company, from November 2013 to October 2017. Mr. Kummert holds a B.S. from the University of Washington.
Non-Employee Directors
Philippe Botteri has served as a member of our board of directors since February 2020, and previously served as a board observer beginning in April 2017. Mr. Botteri serves, since June 2011, in various senior roles and as a Partner at Accel, a venture capital firm, where he focuses on investments in early stage technology companies, including cloud applications, enterprise security, and online marketplaces. Mr. Botteri currently holds directorships and management positions for several Accel entities and other private companies. Mr. Botteri also serves on the board of directors of Fiverr International Ltd., an online marketplace for freelance services, since January 2016. Mr. Botteri holds an M.A. from Ecole Polytechnique and Ecole des Mines in France. We believe that Mr. Botteri is qualified to serve on our board of directors because of his financial expertise, technology industry experience, and cloud computing experience.
Carl Eschenbach has served as a member of our board of directors since March 2021 after previously serving as a board observer beginning in November 2018. Mr. Eschenbach serves, since April 2016, as a General Partner at Sequoia Capital Operations, LLC, a venture capital firm. Prior to joining Sequoia, Mr. Eschenbach spent 14 years at VMware, Inc., a global virtual infrastructure software provider, most recently as its President and Chief Operating Officer, a role he held from December 2012 to March 2016. Mr. Eschenbach served as VMwares Co-President and Chief Operating Officer from April 2012 to December 2012, as Co-President, Customer Operations from January 2011 to April 2012, and as Executive Vice President of Worldwide Field Operations from May 2005 to January 2011. Prior to joining VMware in 2002, Mr. Eschenbach held various sales management positions with Inktomi, 3Com Corporation, Lucent Technologies Inc. and EMC. Mr. Eschenbach serves on the boards of directors of Snowflake Inc., a cloud-based data-warehousing company, since May 2019, Zoom Video Communications, Inc., a video communications technology company, or Zoom, since January 2017, Workday, Inc., a human capital management software company, since February 2018, and Palo Alto Networks, Inc., a cybersecurity company, since May 2013, and he is also a director of several private companies. Mr. Eschenbach received an electronics technician diploma from DeVry University. We believe that Mr. Eschenbach is qualified to serve on our board of directors because of his financial expertise, management experience and experience in the cloud computing industry.
Michael Gordon has served as a member of our board of directors since September 2020. Mr. Gordon serves, since July 2015, as Chief Financial Officer of MongoDB, Inc., a database platform company, and as its Chief Operating Officer since November 2018. Prior to joining MongoDB, Inc., Mr. Gordon worked at Yodle, Inc., an online marketing company, where he served as the Chief Financial Officer from May 2009 until July 2015 and as the Chief Operating Officer and Chief Financial Officer from March 2014 until July 2015. Prior to joining Yodle, Mr. Gordon was a Managing Director in the Media and Telecom investment banking group at Merrill Lynch, Pierce, Fenner and Smith Incorporated, a financial services company, where he worked from 1996 to 2009. Mr. Gordon serves on the board of directors of Share Our Strength, a non-profit, anti-hunger organization. Mr. Gordon received an A.B. from Harvard College and an M.B.A. from Harvard Business School. We believe that Mr. Gordon is qualified to serve on our board of directors because of his financial expertise, management experience, and experience in the software industry.
Kimberly L. Hammonds has served as a member of our board of directors since September 2020. Ms. Hammonds founded the Mangrove Digital Group, LLC, a company that provides technology and business solutions to CEOs of technology companies, in May 2018. Ms. Hammonds previously served as Group Chief Operating Officer of Deutsche Bank AG, a global financial services company, from January 2016 to June 2018, and as a member of the management board of Deutsche Bank from August 2016 to June 2018. She joined
149
Table of Contents
Deutsche Bank as Global Chief Information Officer and Global Co-Head of Group Technology and Operations in November 2013, a position that she held until January 2016. Ms. Hammonds serves on the boards of directors of Box, Inc., an enterprise cloud content and file sharing provider, since October 2018, Zoom since September 2018, and Tenable Holdings, Inc., a cybersecurity solutions provider, since June 2018. Ms. Hammonds previously served on the boards of directors of Cloudera, Inc., a data management, ML, and advance analytics platform provider, from March 2017 to January 2020, and Red Hat, Inc., an open source solutions provider, from August 2015 to July 2019. Ms. Hammonds received a B.S.E. from the University of Michigan at Ann Arbor and an M.B.A. from Western Michigan University. We believe that Ms. Hammonds is qualified to serve on our board of directors because of her financial expertise, management experience, and experience in the cloud computing industry.
Thomas Mendoza has served as a member of our board of directors since October 2017. Mr. Mendoza served in various roles at NetApp, Inc., a storage and data management solutions provider, from March 2009 to August 2019, including Senior Vice President of Sales, President and Vice Chairman. Mr. Mendoza has more than 30 years of experience as a high-technology executive and has held executive positions at Auspex Systems, Inc., a data storage company, and Stratus Technologies, Inc., a computer server and software company. Mr. Mendoza serves as a director of Varonis Systems Inc., a technology company, since June 2015. He holds a B.A. from Notre Dame and is an alumnus of Stanford Universitys Executive Business Program. We believe that Mr. Mendoza is qualified to serve on our board of directors because of his financial expertise, management experience and experience in the software industry.
Daniel D. Springer has served as a member of our board of directors since March 2021. Mr. Springer serves, since January 2017, as Chief Executive Officer, President, and director of DocuSign, Inc., an e-signature technology company. From May 2015 to January 2017, he served as an Operating Partner at Advent International Corp., a private equity investment firm. From March 2004 to March 2014, Mr. Springer served as Chairman and Chief Executive Officer of Responsys, Inc., a marketing software company that was acquired by Oracle Corp. in 2014. Mr. Springer previously served on the board of directors of YuMe Inc., a digital advertising company, from October 2013 to July 2017. Mr. Springer holds a B.A. from Occidental College and an M.B.A. from Harvard University. We believe that Mr. Springer is qualified to serve on our board of directors because of his financial expertise, management experience, and experience in the software industry.
Laela Sturdy has served as a member of our board of directors since March 2021 after previously serving as a board observer beginning in November 2018. Ms. Sturdy serves, since October 2013, as a General Partner of CapitalG LP, the late-stage growth venture capital fund financed by Alphabet Inc. Previously, Ms. Sturdy held several roles at Google LLC, including Managing Director, Emerging Businesses, Sales and Business Operations from March 2010 to October 2013. From July 2016 to May 2019, Ms. Sturdy served as a member of the board of directors of Care.Com, Inc. and she is also a director of several private companies. Ms. Sturdy holds an A.B. in biochemistry from Harvard College, an M.S. from Trinity College Dublin and an M.B.A. from Stanford University. We believe that Ms. Sturdy is qualified to serve on our board of directors because of her financial expertise, management experience and experience in the technology industry.
Jennifer Tejada has served as a member of our board of directors since September 2020. Ms. Tejada serves as the Chairperson and Chief Executive Officer of PagerDuty, Inc., a cloud-native digital operations management company, and as a member of PagerDutys board of directors since July 2016. Prior to joining PagerDuty, she served as President and Chief Executive Officer at Keynote Systems, Inc., an enterprise software company, from July 2013 to July 2015. Ms. Tejada serves on the board of directors of The Estée Lauder Companies Inc., a multinational manufacturer and marketer of beauty products, since April 2018. Ms. Tejada holds a B.A. from the University of Michigan. We believe Ms. Tejada is qualified to serve on our board of directors because of her experience and leadership with technology and data companies.
Richard P. Wong has served as a member of our board of directors since March 2018. Mr. Wong serves, since November 2006, as a General Partner at Accel. From January 2001 to November 2006, Mr. Wong held a
150
Table of Contents
number of executive roles at Openwave Systems Inc., a mobile software company, including Senior Vice President of Products and Chief Marketing Officer. Mr. Wong serves on the boards of directors of Atlassian Corporation Plc, a software development tool company, since July 2010, and a number of other private companies. Mr. Wong also served on the board of directors of Sunrun Inc., a solar energy company, from July 2009 to March 2018. Mr. Wong holds a B.S. and an M.S. from the Massachusetts Institute of Technology. We believe that Mr. Wong is qualified to serve on our board of directors because of his financial expertise and management experience.
Composition of Our Board of Directors
Our business and affairs are managed under the direction of our board of directors. We currently have 10 directors. Each director is elected to the board of directors for a one-year term, to serve until the election and qualification of a successor director at our annual meeting of stockholders, or until the directors earlier removal, resignation, or death. All of our directors currently serve on the board of directors pursuant to the provisions of a voting agreement between us and several of our stockholders. This agreement will terminate upon the closing of this offering, after which there will be no further contractual obligations regarding the election of our directors. Following the closing of this offering, no stockholder will have any special rights regarding the election or designation of members of our board of directors. Our current directors will continue to serve as directors until their resignation, removal, or successor is duly elected.
Lead Independent Director
Daniel Dines serves as both our Chief Executive Officer and as Chairman of our board of directors. Our corporate governance guidelines provide that one of our independent directors may serve as the lead independent director at any time that Mr. Dines or anyone else who is not an independent director is serving as the chairman of the board of directors. Our board of directors appointed Richard P. Wong, effective upon the completion of this offering, to serve as our lead independent director. As lead independent director, Mr. Wong will preside over periodic meetings of our independent directors and coordinate certain activities of the independent directors.
Director Independence
Our board of directors has undertaken a review of the independence of each director. Based on information provided by each director concerning his or her background, employment, and affiliations, our board of directors has determined that none of our directors, other than Mr. Dines, has any relationships that would interfere with the exercise of independent judgment in carrying out the responsibilities of a director and that each of these directors is independent as that term is defined under the listing standards. In making these determinations, our board of directors considered the current and prior relationships that each non-employee director has with our company and all other facts and circumstances our board of directors deemed relevant in determining their independence, including the beneficial ownership of our shares by each non-employee director and the transactions described in the section titled Certain Relationships and Related Party Transactions.
Committees of Our Board of Directors
Our board of directors has established an audit committee, a compensation committee, and a nominating and corporate governance committee. The composition and responsibilities of each of the committees of our board of directors are described below. Members serve on these committees until their resignation or until otherwise determined by our board of directors. Our board of directors may establish other committees as it deems necessary or appropriate from time to time.
Audit Committee
Our audit committee consists of Michael Gordon, Carl Eschenbach, Kimberly L. Hammonds, and Daniel D. Springer. Our board of directors has determined that each of Michael Gordon, Carl Eschenbach,
151
Table of Contents
Kimberly L. Hammonds, and Daniel D. Springer satisfies the independence requirements under the listing standards of the New York Stock Exchange and Rule 10A-3(b)(1) of the Exchange Act. The chair of our audit committee is Michael Gordon, who our board of directors has determined is an audit committee financial expert within the meaning of SEC regulations. Each member of our audit committee can read and understand fundamental financial statements in accordance with applicable requirements. In arriving at these determinations, our board of directors has examined each audit committee members scope of experience and the nature of their employment in the corporate finance sector.
The principal duties and responsibilities of our audit committee include, among other things:
| | selecting a qualified firm to serve as the independent registered public accounting firm to audit our financial statements; |
| | helping to ensure the independence and performance of the independent registered public accounting firm; |
| | helping to maintain and foster an open avenue of communication between management and the independent registered public accounting firm; |
| | discussing the scope and results of the audit with the independent registered public accounting firm, and reviewing, with management and the independent accountants, our interim and year-end operating results; |
| | developing procedures for employees to submit concerns anonymously about questionable accounting or audit matters; |
| | reviewing our policies on risk assessment and risk management; |
| | reviewing related party transactions; |
| | obtaining and reviewing a report by the independent registered public accounting firm at least annually, that describes its internal quality-control procedures, any material issues with such procedures, and any steps taken to deal with such issues when required by applicable law; and |
| | approving (or, as permitted, pre-approving) all audit and all permissible non-audit services to be performed by the independent registered public accounting firm. |
Our audit committee will operate under a written charter, to be effective prior to the closing of this offering, that satisfies the applicable listing standards of the New York Stock Exchange.
Compensation Committee
Our compensation committee consists of Richard P. Wong, Thomas Mendoza, and Laela Sturdy. The chair of our compensation committee is Richard P. Wong. Our board of directors has determined that each of Richard P. Wong, Thomas Mendoza, and Laela Sturdy is independent under the listing standards of the New York Stock Exchange, a non-employee director as defined in Rule 16b-3 promulgated under the Exchange Act.
The principal duties and responsibilities of our compensation committee include, among other things:
| | approving the retention of compensation consultants and outside service providers and advisors; |
152
Table of Contents
| | reviewing and approving, or recommending that our board of directors approve, the compensation, individual, and corporate performance goals and objectives and other terms of employment of our executive officers, including evaluating the performance of our chief executive officer and, with his assistance, that of our other executive officers; |
| | reviewing and recommending to our board of directors the compensation of our directors; |
| | administering our equity and non-equity incentive plans; |
| | reviewing our practices and policies of employee compensation as they relate to risk management and risk-taking incentives; |
| | reviewing and evaluating succession plans for the executive officers; |
| | reviewing and approving, or recommending that our board of directors approve, incentive compensation and equity plans; and |
| | reviewing and establishing general policies relating to compensation and benefits of our employees and reviewing our overall compensation philosophy. |
Our compensation committee will operate under a written charter, to be effective prior to the closing of this offering, that satisfies the applicable listing standards of the New York Stock Exchange.
Nominating and Corporate Governance Committee
Our nominating and corporate governance committee consists of Jennifer Tejada and Philippe Botteri. The chair of our nominating and corporate governance committee is Jennifer Tejada. Our board of directors has determined that each of Jennifer Tejada and Philippe Botteri is independent under the listing standards of the New York Stock Exchange.
The nominating and corporate governance committees responsibilities include, among other things:
| | identifying, evaluating, and selecting, or recommending that our board of directors approve, nominees for election to our board of directors and its committees; |
| | approving the retention of director search firms; |
| | evaluating the performance of our board of directors and of individual directors; |
| | considering and making recommendations to our board of directors regarding the composition of our board of directors and its committees; |
| | evaluating the adequacy of our corporate governance practices and reporting; and |
| | overseeing an annual evaluation of the boards performance. |
Our nominating and corporate governance committee will operate under a written charter, to be effective prior to the closing of this offering, that satisfies the applicable listing standards of the New York Stock Exchange.
Code of Conduct
We have adopted a Code of Conduct that applies to all our employees, officers, and directors. This includes our principal executive officer, principal financial officer, and principal accounting officer or controller, or
153
Table of Contents
persons performing similar functions. The full text of our Code of Conduct will be posted on our website at www.uipath.com. We intend to disclose on our website any future amendments of our Code of Conduct or waivers that exempt any principal executive officer, principal financial officer, principal accounting officer or controller, persons performing similar functions or our directors from provisions in the Code of Conduct. Information contained on, or that can be accessed through, our website is not incorporated by reference into this prospectus, and you should not consider information on our website to be part of this prospectus.
Compensation Committee Interlocks and Insider Participation
None of the members of the compensation committee are currently, or have been at any time, one of our officers or employees. None of our executive officers currently serve, or have served during the last year, as a member of the board of directors or compensation committee of any entity that has one or more executive officers serving as a member of our board of directors or compensation committee.
Non-Employee Director Compensation
The following table sets forth information regarding compensation earned by or paid to our non-employee directors for and subsequent to the fiscal year ended January 31, 2021:
| Name |
Stock Awards(1)(2) |
Total | ||||||
| Philippe Botteri(3) |
$ | 972,205 | $ | 972,205 | ||||
| Carl Eschenbach(4) |
972,205 | 972,205 | ||||||
| Michael Gordon(5) |
4,020,246 | 4,020,246 | ||||||
| Kimberly L. Hammonds(6) |
3,415,237 | 3,415,237 | ||||||
| Alexandru Iancu(7) |
| | ||||||
| Dan Lupu(8) |
| | ||||||
| Thomas Mendoza |
| | ||||||
| Daniel D. Springer(9) |
4,885,428 | 4,885,428 | ||||||
| Laela Sturdy(10) |
972,205 | 972,205 | ||||||
| Jennifer Tejada(11) |
3,811,932 | 3,811,932 | ||||||
| Richard P. Wong(12) |
972,205 | 972,205 | ||||||
| (1) | Amounts reported represent the aggregate grant date fair value of stock awards, RSUs granted to our directors under our 2018 Plan, computed in accordance with ASC Topic 718, excluding the effect of estimated forfeitures. The assumptions used in calculating the grant date fair value of the stock awards are set forth in the notes to our audited consolidated financial statements included elsewhere in this prospectus. This amount does not reflect the actual economic value that may be realized by the non-employee director. |
| (2) | As of the date of this prospectus, the aggregate number of outstanding shares of restricted stock and shares underlying outstanding RSUs under our 2018 Plan held by each of our non-employee directors was as follows: |
| Name |
Number of Shares of Restricted Stock |
Number of Shares Underlying RSUs |
||||||
| Philippe Botteri |
| 16,057 | ||||||
| Carl Eschenbach |
| 16,057 | ||||||
| Michael Gordon |
121,033 | | ||||||
| Kimberly L. Hammonds |
| 80,688 | ||||||
| Alexandru Iancu |
| | ||||||
| Dan Lupu |
| | ||||||
| Thomas Mendoza |
| | ||||||
| Daniel D. Springer |
| 80,688 | ||||||
| Laela Sturdy |
| 16,057 | ||||||
| Jennifer Tejada |
| 80,688 | ||||||
| Richard P. Wong |
| 16,057 | ||||||
| (3) | Amount consists of 16,057 shares of Class A common stock underlying RSUs with an aggregate grant date fair value of $972,205, granted to Mr. Botteri in March 2021. |
154
Table of Contents
| (4) | Mr. Eschenbach joined our board of directors in March 2021. Amount consists of 16,057 shares of Class A common stock underlying RSUs with an aggregate grant date fair value of $972,205, granted to Mr. Eschenbach in March 2021. |
| (5) | Mr. Gordon joined our board of directors in September 2020. |
| (6) | Ms. Hammonds joined our board of directors in September 2020. Amount includes 26,896 shares of Class A common stock underlying RSUs with an aggregate grant date fair value of $1,628,476, granted to Ms. Hammonds in March 2021. |
| (7) | Mr. Iancu resigned from our board of directors in December 2020. |
| (8) | Mr. Lupu resigned from our board of directors in January 2021. |
| (9) | Mr. Springer joined our board of directors in March 2021. Amount consists of 80,688 shares of Class A common stock underlying RSUs with an aggregate grant date fair value of $4,885,428, granted to Mr. Springer in March 2021. |
| (10) | Ms. Sturdy joined our board of directors in March 2021. Amount consists of 16,057 shares of Class A common stock underlying RSUs with an aggregate grant date fair value of $972,205, granted to Ms. Sturdy in March 2021. |
| (11) | Ms. Tejada joined our board of directors in October 2020. Amount includes 26,896 shares of Class A common stock underlying RSUs with an aggregate grant date fair value of $1,628,476, granted to Ms. Tejada in March 2021. |
| (12) | Amount consists of 16,057 shares of Class A common stock underlying RSUs with an aggregate grant date fair value of $972,205, granted to Mr. Wong in March 2021. |
Daniel Dines, our Chief Executive Officer, Co-Founder, and Chairman, is also a member of our board of directors but does not receive any additional compensation for his service as a director. See the section titled Executive Compensation for more information regarding the compensation earned by Mr. Dines.
Non-Employee Director Compensation Policy
Our board of directors adopted a non-employee director compensation policy in April 2021 that will become effective upon the execution and delivery of the underwriting agreement related to this offering, or the effective date, and will be applicable to all of our non-employee directors. This compensation policy provides that each such non-employee director will receive the following compensation for service on our board of directors:
| | an annual cash retainer of $30,000; |
| | an additional annual cash retainer of $15,000 for service as lead independent director; |
| | an additional annual cash retainer of $15,000 for service as a member of the audit committee, compensation committee, and the nominating and corporate governance committee; |
| | an initial RSU award granted upon a non-employee directors initial election or appointment to the board, with a value equal to $400,000, vesting in three equal annual installments; and |
| | a refresher RSU award granted at each annual meeting of our stockholders, or annual meeting, held after the effective date to each non-employee director serving on such date, with a value equal to $200,000, vesting on the earlier of (1) the date of the following years annual meeting (or the day immediately preceding the next annual meeting, if sooner) or (2) the first anniversary of the grant date. |
Any awards granted under this policy that are unvested as of the occurrence of a corporate transaction (as defined in the 2021 Plan) will vest as of such corporate transaction. Pursuant to the compensation policy, the compensation described above, with respect to any fiscal year beginning in fiscal 2022, shall be subject to the limits on non-employee director compensation set forth in the 2021 Plan. Each of the RSU awards described above will be granted under our 2021 Plan, the terms of which are described in more detail below under Executive CompensationEmployee Benefit Plans2021 Equity Incentive Plan. Each such RSU award will vest subject to the directors continuous service with us, provided that each RSU award will vest in full upon a change in control of the company.
155
Table of Contents
Our named executive officers, consisting of our principal executive officer and the next two most highly compensated executive officers, as of January 31, 2021, were:
| | Daniel Dines, Chief Executive Officer, Co-Founder, and Chairman; |
| | Ted Kummert, Executive Vice President of Product and Engineering; and |
| | Thomas Hansen, Chief Revenue Officer. |
Fiscal Year 2021 Summary Compensation Table
The following table presents all of the compensation awarded to or earned by or paid to our named executive officers for the fiscal year ended January 31, 2021.
| Name and Principal Position |
Salary | Stock Awards(1) |
Option Awards(1) |
Non-Equity Incentive Plan Compensation(2) |
All Other Compensation(3) |
Total | ||||||||||||||||||
| Daniel Dines |
$ | 106,044 | (4) | $ | | $ | | $ | | $ | 110,032 | (5) | $ | 216,076 | ||||||||||
| Chief Executive Officer, Co-Founder, and Chairman |
||||||||||||||||||||||||
| Ted Kummert(6) |
404,384 | 8,250,328 | 15,362,969 | (7) | 225,117 | 319 | 24,243,116 | |||||||||||||||||
| Executive Vice President of Product and Engineering |
||||||||||||||||||||||||
| Thomas Hansen(8) |
305,753 | | 15,192,987 | | 172,128 | (9) | 15,670,869 | |||||||||||||||||
| Chief Revenue Officer |
||||||||||||||||||||||||
| (1) | Amounts reported represents the aggregate grant date fair value of stock awards or stock options, as applicable, granted to our executive officer during the fiscal year ended January 31, 2021 under the 2018 Plan, computed in accordance with ASC Topic 718. The assumptions used in calculating the grant date fair value of the stock awards and stock options reported in this column are set forth in the notes to our audited consolidated financial statements included elsewhere in this prospectus. This amount does not reflect the actual economic value that may be realized by the executive officer. |
| (2) | Amounts shown represent the executive officers total bonuses earned for the fiscal year 2021 based on the achievement of company performance goals as determined by our board of directors. |
| (3) | Amounts shown represent life insurance premium payments made by us on behalf of each named executive officer. |
| (4) | Amount shown includes $5,809 from UiPath, Inc. and $100,235 from our Romanian subsidiary. |
| (5) | Amount shown also includes personal security services in the amount of $66,500, health insurance costs, gym membership fees, expenses related to personal meals and events, expenses related to tax preparation services, and our 401(k) match contribution for Mr. Dines. |
| (6) | Mr. Kummert was hired as our Executive Vice President of Product and Engineering in March 2020. His annualized base salary as of January 31, 2021 was $450,000. |
| (7) | This amount also reflects (i) the grant date fair value for the stock option award granted to Mr. Kummert in March 2020 of $5,190,872, computed as of the grant date, plus (ii) the incremental fair value of the repricing of the stock option award in July 2020 of $10,172,097, computed as of the repricing date, each in accordance with ASC Topic 718. |
| (8) | Mr. Hansen was hired as our Chief Revenue Officer in April 2020. His annualized base salary as of January 31, 2021 was $400,000. |
| (9) | Amount shown also includes sales commissions in the amount of $160,755 and our 401(k) match contribution for Mr. Hansen. |
156
Table of Contents
Outstanding Equity Awards as of January 31, 2021
The following table sets forth certain information about outstanding equity awards granted to our named executive officers that remain outstanding as of January 31, 2021.
| Option Awards | Stock Awards | |||||||||||||||||||||||||||
| Name |
Grant Date(1) |
Number of Securities Underlying Unexercised Options Exercisable (#) |
Number of Securities Underlying Unexercised Options Unexercisable (#) |
Option Exercise Price |
Option Expiration Date |
Number of Shares or Units of Stock that Have Not Vested (#) |
Market Value of Shares or Units of Stock that Have Not Vested |
|||||||||||||||||||||
| Daniel Dines |
| | | $ | | | | $ | | |||||||||||||||||||
| Ted Kummert |
3/27/2020 | | | 3/26/2027 | 838,590 | (2) | 8,250,328 | |||||||||||||||||||||
| 7/20/2020 | | 838,590 | (3) | 5.06 | 3/26/2030 | | | |||||||||||||||||||||
| Thomas Hansen |
4/30/2020 | | 1,600,947 | (4) | 3.38 | 4/29/2030 | | | ||||||||||||||||||||
| (1) | All equity awards listed in this table were granted pursuant to the 2015 Plan or 2018 Plan, the terms of which are described below under Employee Benefit Plans2015 Stock Plan and Employee Benefit Plans2018 Stock Plan, respectively. |
| (2) | 25% of the shares underlying this stock award vested on March 9, 2021, with the remaining shares vesting in equal quarterly installments over the next three years, subject to the executive officers continuous service through each such vesting date. |
| (3) | 25% of the shares underlying this option vested on March 9, 2021, with the remaining shares vesting in equal monthly installments over the next three years, subject to the executive officers continuous service through each such vesting date. |
| (4) | 25% of the shares underlying this option will vest on April 27, 2021, with the remaining shares vesting in equal monthly installments over the next three years, subject to the executive officers continuous service through each such vesting date. Mr. Hansen partially early exercised such options for 1,482,723 shares of restricted stock, which were unvested as of January 31, 2021. |
We may in the future, on an annual basis or otherwise, grant additional equity awards to our executive officers pursuant to the 2021 Plan, the terms of which are described below under Employee Benefit Plans2021 Equity Incentive Plan.
Employment Arrangements
Prior to the completion of this offering, we will enter into revised offer letters with each of our named executive officers setting forth the terms and conditions of such executives employment with us. The offer letters generally will provide for at-will employment and set forth the executive officers initial base salary. Each of our named executive officers has executed our standard confidential information and invention assignment agreement.
Daniel Dines
In February 2021, we entered into a letter with Daniel Dines governing his position as our Co-Founder and Chief Executive Officer. The letter has no specific term and provides for an at-will relationship with Mr. Dines. The letter does not provide for any compensation for Mr. Dines in connection with his service as Co-Founder and Chief Executive Officer or upon termination or resignation from such position.
Theodore Kummert
In February 2020, we entered into an offer letter with Theodore Kummert, our Executive Vice President of Product and Engineering. The offer letter has no specific term and provides for at-will employment. Mr. Kummerts current annual base salary is $450,000, and he is currently eligible for an annual discretionary performance bonus of up to 50% of his annual base salary, based on individual and corporate performance goals.
Under Mr. Kummerts offer letter, if he resigns for Good Reason or we terminate his employment without Cause (each as defined in his offer letter), then as a severance benefit Mr. Kummert will be eligible to receive twelve months of base salary (less applicable tax withholdings) paid in accordance with our regular payroll practices. As a condition to receiving the severance benefit above, Mr. Kummert must sign and comply with a
157
Table of Contents
general release agreement in a form acceptable to us. Further, if Mr. Kummert resigns for Good Reason or we terminate Mr. Kummerts employment without Cause, in either case within 12 months of a Change in Control (as defined in his offer letter), 100% of his then-unvested equity will immediately accelerate, vest and become exercisable.
Thomas Hansen
In March 2020, we entered into an offer letter with Thomas Hansen, our Chief Revenue Officer. The offer letter has no specific term and provides for at-will employment. Mr. Hansens current annual base salary is $400,000, and he is currently eligible for an incentive opportunity for 2021 based on a target variable of $400,000, in accordance with the terms and conditions of the Companys Sales Incentive Plan.
Under Mr. Hansens offer letter, if he resigns for Good Reason or we terminate his employment without Cause (each as defined in his offer letter), then Mr. Hansen will be eligible to receive the following severance benefits (less applicable tax withholdings): (1) twelve months of base salary paid in accordance with our regular payroll practices; (2) a prorated portion of his incentive compensation, calculated based on his effective termination date and pursuant to the Sales Incentive Plan in effect at the time; and (3) acceleration of an additional six months of stock options and/or the service-time component of RSUs as of the effective termination date. As a condition to receiving the severance benefit above, Mr. Hansen must sign and comply with a general release agreement in a form acceptable to us. Further, if Mr. Hansen resigns for Good Reason or we terminate Mr. Hansens employment without Cause, in either case within 12 months of a Change in Control (as defined in his offer letter), 100% of his then-unvested equity will immediately accelerate, vest and become exercisable.
Employee Benefit Plans
2021 Equity Incentive Plan
Our board of directors adopted, and our stockholders approved, the 2021 Plan in April 2021. The 2021 Plan will become effective on the date of, and contingent upon the execution of, the underwriting agreement related to this offering. No grants will be made under the 2021 Plan prior to its effectiveness. Once the 2021 Plan becomes effective, no further grants will be made under the 2018 Plan.
Awards. The 2021 Plan provides for the grant of incentive stock options, or ISOs, within the meaning of Section 422 of the Code, to our employees and our parent and subsidiary corporations employees, and for the grant of nonstatutory stock options, or NSOs, stock appreciation rights, restricted stock awards, or RSAs, RSU awards, performance awards and/or other forms of awards to our employees, directors, and consultants and any of our affiliates employees and consultants.
Authorized Shares. Initially, the maximum number of shares of our Class A common stock that may be issued under the 2021 Plan after it becomes effective will not exceed 118,795,563 shares of our Class A common stock, which is the sum of (i) 50,500,000 new shares, plus (ii) an additional number of shares not to exceed 68,295,563 shares, consisting of (a) shares that remain available for the issuance of awards under the 2018 Plan as of immediately prior to the time the 2021 Plan becomes effective and (b) any shares of our Class A common stock subject to outstanding stock options or other stock awards granted under the 2018 Plan or 2015 Plan that, on or after the 2021 Plan becomes effective, terminate or expire prior to exercise or settlement; are not issued because the award is settled in cash; are forfeited because of the failure to vest; or are reacquired or withheld (or not issued) to satisfy a tax withholding obligation or the purchase or exercise price. In addition, the number of shares of our Class A common stock reserved for issuance under the 2021 Plan will automatically increase on February 1 of each year for a period of ten years, beginning on February 1, 2022 and continuing through February 1, 2031, in an amount equal to (1) 5% of the total number of shares of our common stock (both Class A and Class B) outstanding on the preceding January 31, or (2) a lesser number of shares determined by our board of directors no later than the February 1 increase. The maximum number of shares of our Class A common stock that may be issued on the exercise of ISOs under the 2021 Plan will be 360,000,000 shares.
158
Table of Contents
Shares subject to stock awards granted under the 2021 Plan that expire or terminate without being exercised in full or that are paid out in cash rather than in shares will not reduce the number of shares available for issuance under the 2021 Plan. Shares withheld under a stock award to satisfy the exercise, strike, or purchase price of a stock award or to satisfy a tax withholding obligation will not reduce the number of shares available for issuance under the 2021 Plan. If any shares of our Class A common stock issued pursuant to a stock award are forfeited back to or repurchased or reacquired by us (i) because of a failure to meet a contingency or condition required for the vesting of such shares; (ii) to satisfy the exercise, strike, or purchase price of a stock award; or (iii) to satisfy a tax withholding obligation in connection with a stock award, the shares that are forfeited or repurchased or reacquired will revert to and again become available for issuance under the 2021 Plan.
Plan Administration. Our board of directors, or a duly authorized committee of our board of directors, will administer the 2021 Plan. Our board of directors may delegate to one or more of our officers the authority to (i) designate employees (other than officers) to receive specified stock awards; and (ii) determine the number of shares subject to such stock awards. Under the 2021 Plan, our board of directors will have the authority to determine stock award recipients, the types of stock awards to be granted, grant dates, the number of shares subject to each stock award, the fair market value of our Class A common stock, and the provisions of each stock award, including the period of exercisability and the vesting schedule applicable to a stock award.
Under the 2021 Plan, our board of directors also generally will have the authority to effect, with the consent of any materially adversely affected participant, (i) the reduction of the exercise, purchase, or strike price of any outstanding option or stock appreciation right; (ii) the cancellation of any outstanding option or stock appreciation right and the grant in substitution therefore of other awards, cash, or other consideration; or (iii) any other action that is treated as a repricing under generally accepted accounting principles.
Stock Options. ISOs and NSOs are granted under stock option agreements adopted by the administrator. The administrator will determine the exercise price for stock options, within the terms and conditions of the 2021 Plan, except the exercise price of a stock option generally will not be less than 100% of the fair market value of our Class A common stock on the date of grant. Options granted under the 2021 Plan will vest at the rate specified in the stock option agreement as will be determined by the administrator.
The administrator will determine the term of stock options granted under the 2021 Plan, up to a maximum of 10 years. Unless the terms of an optionholders stock option agreement, or other written agreement between us and the recipient, provide otherwise, if an optionholders service relationship with us or any of our affiliates ceases for any reason other than disability, death, or cause, the optionholder may generally exercise any vested options for a period of three months following the cessation of service. This period may be extended in the event that exercise of the option is prohibited by applicable securities laws. If an optionholders service relationship with us or any of our affiliates ceases due to death, or an optionholder dies within a certain period following cessation of service, the optionholder or a beneficiary may generally exercise any vested options for a period of 18 months following the date of death. If an optionholders service relationship with us or any of our affiliates ceases due to disability, the optionholder may generally exercise any vested options for a period of 12 months following the cessation of service. In the event of a termination for cause, options generally terminate upon the termination date. In no event may an option be exercised beyond the expiration of its term.
Acceptable consideration for the purchase of Class A common stock issued upon the exercise of a stock option will be determined by the administrator and may include (i) cash, check, bank draft, or money order; (ii) a broker-assisted cashless exercise; (iii) the tender of shares of our Class A common stock previously owned by the optionholder; (iv) a net exercise of the option if it is an NSO; or (v) other legal consideration approved by the administrator.
Unless the administrator provides otherwise, options or stock appreciation rights generally are not transferable except by will or the laws of descent and distribution. Subject to approval of the administrator or a duly authorized officer, an option may be transferred pursuant to a domestic relations order, official marital settlement agreement, or other divorce or separation instrument.
159
Table of Contents
Tax Limitations on ISOs. The aggregate fair market value, determined at the time of grant, of our Class A common stock with respect to ISOs that are exercisable for the first time by an award holder during any calendar year under all of our stock plans may not exceed $100,000. Options or portions thereof that exceed such limit will generally be treated as NSOs. No ISO may be granted to any person who, at the time of the grant, owns or is deemed to own stock possessing more than 10% of our total combined voting power or that of any of our parent or subsidiary corporations unless (i) the option exercise price is at least 110% of the fair market value of the stock subject to the option on the date of grant; and (ii) the term of the ISO does not exceed five years from the date of grant.
Restricted Stock Unit Awards. RSU awards are granted under RSU award agreements adopted by the administrator. RSU awards may be granted in consideration for any form of legal consideration that may be acceptable to our board of directors and permissible under applicable law. An RSU award may be settled by cash, delivery of stock, a combination of cash and stock as deemed appropriate by the administrator, or in any other form of consideration set forth in the RSU award agreement. Additionally, dividend equivalents may be credited in respect of shares covered by an RSU award. Except as otherwise provided in the applicable award agreement, or other written agreement between us and the recipient, RSU awards that have not vested will be forfeited once the participants continuous service ends for any reason.
Restricted Stock Awards. RSAs are granted under RSA agreements adopted by the administrator. An RSA may be awarded in consideration for cash, check, bank draft or money order, past or future services to us, or any other form of legal consideration that may be acceptable to our board of directors and permissible under applicable law. The administrator will determine the terms and conditions of RSAs, including vesting and forfeiture terms. If a participants service relationship with us ends for any reason, we may receive any or all of the shares of Class A common stock held by the participant that have not vested as of the date the participant terminates service with us through a forfeiture condition or a repurchase right.
Stock Appreciation Rights. Stock appreciation rights are granted under stock appreciation right agreements adopted by the administrator. The administrator will determine the purchase price or strike price for a stock appreciation right, which generally will not be less than 100% of the fair market value of our Class A common stock on the date of grant. A stock appreciation right granted under the 2021 Plan will vest at the rate specified in the stock appreciation right agreement as will be determined by the administrator. Stock appreciation rights may be settled in cash or shares of our Class A common stock or in any other form of payment as determined by our board of directors and specified in the stock appreciation right agreement.
The administrator will determine the term of stock appreciation rights granted under the 2021 Plan, up to a maximum of 10 years. If a participants service relationship with us or any of our affiliates ceases for any reason other than cause, disability, or death, the participant may generally exercise any vested stock appreciation right for a period of three months following the cessation of service. This period may be further extended in the event that exercise of the stock appreciation right following such a termination of service is prohibited by applicable securities laws. If a participants service relationship with us, or any of our affiliates, ceases due to disability or death, or a participant dies within a certain period following cessation of service, the participant or a beneficiary may generally exercise any vested stock appreciation right for a period of 12 months in the event of disability and 18 months in the event of death. In the event of a termination for cause, stock appreciation rights generally terminate upon the termination date. In no event may a stock appreciation right be exercised beyond the expiration of its term.
Performance Awards. The 2021 Plan will permit the grant of performance awards that may be settled in stock, cash, or other property. Performance awards may be structured so that the stock or cash will be issued or paid only following the achievement of certain pre-established performance goals during a designated performance period. Performance awards that are settled in cash or other property are not required to be valued in whole or in part by reference to, or otherwise based on, our Class A common stock.
The performance goals may be based on any measure of performance selected by our board of directors. The performance goals may be based on company-wide performance or performance of one or more business units,
160
Table of Contents
divisions, affiliates, or business segments, and may be either absolute or relative to the performance of one or more comparable companies or the performance of one or more relevant indices. Unless specified otherwise by our board of directors at the time the performance award is granted, our board will appropriately make adjustments in the method of calculating the attainment of performance goals as follows: (i) to exclude restructuring or other nonrecurring charges; (ii) to exclude exchange rate effects; (iii) to exclude the effects of changes to generally accepted accounting principles; (iv) to exclude the effects of any statutory adjustments to corporate tax rates; (v) to exclude the effects of items that are unusual in nature or occur infrequently as determined under generally accepted accounting principles; (vi) to exclude the dilutive effects of acquisitions or joint ventures; (vii) to assume that any business divested by us achieved performance objectives at targeted levels during the balance of a performance period following such divestiture; (viii) to exclude the effect of any change in the outstanding shares of our common stock by reason of any stock dividend or split, stock repurchase, reorganization, recapitalization, merger, consolidation, spin-off, combination or exchange of shares or other similar corporate change, or any distributions to common stockholders other than regular cash dividends; (ix) to exclude the effects of stock-based compensation and the award of bonuses under our bonus plans; (x) to exclude costs incurred in connection with potential acquisitions or divestitures that are required to be expensed under generally accepted accounting principles; and (xi) to exclude the goodwill and intangible asset impairment charges that are required to be recorded under generally accepted accounting principles.
Other Stock Awards. The administrator will be permitted to grant other awards based in whole or in part by reference to our Class A common stock. The administrator will set the number of shares under the stock award (or cash equivalent) and all other terms and conditions of such awards.
Non-Employee Director Compensation Limit. The aggregate value of all compensation granted or paid to any non-employee director with respect to any fiscal year, including awards granted and cash fees paid by us to such non-employee director, will not exceed $1.0 million in total value, except such amount will increase to $1.5 million for the first year for newly appointed or elected non-employee directors.
Changes to Capital Structure. In the event there is a specified type of change in our capital structure, such as a stock split, reverse stock split, or recapitalization, appropriate adjustments will be made to (i) the class and maximum number of shares reserved for issuance under the 2021 Plan, (ii) the class and maximum number of shares by which the share reserve may increase automatically each year, (iii) the class and maximum number of shares that may be issued on the exercise of ISOs, and (iv) the class and number of shares and exercise price, strike price, or purchase price, if applicable, of all outstanding stock awards.
Corporate Transactions. In the event of a corporate transaction (as defined below), unless otherwise provided in a participants stock award agreement or other written agreement with us or one of our affiliates or unless otherwise expressly provided by the administrator at the time of grant, any stock awards outstanding under the 2021 Plan may be assumed, continued, or substituted for by any surviving or acquiring corporation (or its parent company), and any reacquisition or repurchase rights held by us with respect to the stock award may be assigned to the successor (or its parent company). If the surviving or acquiring corporation (or its parent company) does not assume, continue, or substitute for such stock awards, then (i) with respect to any such stock awards that are held by participants whose continuous service has not terminated prior to the effective time of the corporate transaction, or current participants, the vesting (and exercisability, if applicable) of such stock awards will be accelerated in full (or, in the case of performance awards with multiple vesting levels depending on the level of performance, vesting will accelerate at 100% of the target level) to a date prior to the effective time of the corporate transaction (contingent upon the effectiveness of the corporate transaction), and such stock awards will terminate if not exercised (if applicable) at or prior to the effective time of the corporate transaction, and any reacquisition or repurchase rights held by us with respect to such stock awards will lapse (contingent upon the effectiveness of the corporate transaction); and (ii) any such stock awards that are held by persons other than current participants will terminate if not exercised (if applicable) prior to the effective time of the corporate transaction, except that any reacquisition or repurchase rights held by us with respect to such stock awards will not terminate and may continue to be exercised notwithstanding the corporate transaction.
161
Table of Contents
In the event a stock award will terminate if not exercised prior to the effective time of a corporate transaction, the administrator may provide, in its sole discretion, that the holder of such stock award may not exercise such stock award but instead will receive a payment equal in value to the excess (if any) of (i) the value of the property the participant would have received upon the exercise of the stock award, over (ii) any per share exercise price payable by such holder, if applicable. In addition, any escrow, holdback, earn out, or similar provisions in the definitive agreement for the corporate transaction may apply to such payment to the same extent and in the same manner as such provisions apply to the holders of our Class A common stock.
Under the 2021 Plan, a corporate transaction is generally the consummation of (i) a sale or other disposition of all or substantially all of our consolidated assets; (ii) a sale or other disposition of at least 50% of our outstanding securities; (iii) a merger, consolidation, or similar transaction following which we are not the surviving corporation; or (iv) a merger, consolidation, or similar transaction following which we are the surviving corporation but the shares of our common stock outstanding immediately prior to such transaction are converted or exchanged into other property by virtue of the transaction.
Change in Control. Stock awards granted under the 2021 Plan may be subject to acceleration of vesting and exercisability upon or after a change in control (as defined below) as may be provided in the applicable stock award agreement or in any other written agreement between us or any affiliate and the participant, but in the absence of such provision, no such acceleration will automatically occur.
Under the 2021 Plan, a change in control is generally (i) the acquisition by any person or company of more than 50% of the combined voting power of then outstanding stock; (ii) a merger, consolidation, or similar transaction in which our stockholders immediately before the transaction do not own, directly or indirectly, more than 50% of the combined voting power of the surviving entity (or the parent of the surviving entity) in substantially the same proportions as their ownership immediately prior to such transaction; (iii) stockholder approval of a complete dissolution or liquidation; (iv) a sale, lease, exclusive license, or other disposition of all or substantially all of our assets other than to an entity more than 50% of the combined voting power of which is owned by our stockholders in substantially the same proportions as their ownership of our outstanding voting securities immediately prior to such transaction; or (v) when a majority of our board of directors becomes comprised of individuals who were not serving on our board of directors on the date of the underwriting agreement related to this offering, or the incumbent board, or whose nomination, appointment, or election was not approved by a majority of the incumbent board still in office.
Plan Amendment or Termination. Our board of directors has the authority to amend, suspend, or terminate the 2021 Plan at any time, provided that such action does not materially impair the existing rights of any participant without such participants written consent. Certain material amendments also require the approval of our stockholders. No ISOs may be granted after the tenth anniversary of the date our board of directors adopts the 2021 Plan. No stock awards may be granted under the 2021 Plan while it is suspended or after it is terminated.
2021 Employee Stock Purchase Plan
Our board of directors adopted, and our stockholders approved, the ESPP in April 2021. The ESPP will become effective on the date of, and contingent upon the execution of, the underwriting agreement related to this offering. The purpose of our ESPP is to secure the services of new employees, to retain the services of existing employees and to provide incentives for such individuals to exert maximum efforts toward our success and that of our affiliates. Our ESPP includes two components. One component is designed to allow eligible U.S. employees to purchase our Class A common stock in a manner that may qualify for favorable tax treatment under Section 423 of the Code. The other component permits the grant of purchase rights that do not qualify for such favorable tax treatment in order to allow deviations necessary to permit participation by eligible employees who are foreign nationals or employed outside of the United States while complying with applicable foreign laws.
Share Reserve. Following this offering, our ESPP will authorize the issuance of 10,500,000 shares of our Class A common stock under purchase rights granted to our employees or to employees of any of our designated
162
Table of Contents
affiliates. The number of shares of our Class A common stock reserved for issuance will automatically increase on February 1 of each year for a period of ten years, beginning on February 1, 2022 and continuing through February 1, 2031, by the lesser of (i) 1% of the total number of shares of our common stock (both Class A and Class B) outstanding on the preceding January 31; and (ii) 15,500,000 shares, except before the date of any such increase, our board of directors may determine that such increase will be less than the amount set forth in clauses (i) and (ii).
Administration. Our board of directors will administer our ESPP and may delegate its authority to administer our ESPP to our compensation committee. Our ESPP will be implemented through a series of offerings under which eligible employees are granted purchase rights to purchase shares of our Class A common stock on specified dates during such offerings. Under our ESPP, our board of directors will be permitted to specify offerings with durations of not more than 27 months and to specify shorter purchase periods within each offering. Each offering will have one or more purchase dates on which shares of our Class A common stock will be purchased for employees participating in the offering. Our ESPP will provide that an offering may be terminated under certain circumstances.
Payroll Deductions. Generally, all regular employees, including executive officers, employed by us or by any of our designated affiliates, will be eligible to participate in our ESPP and to contribute, normally through payroll deductions, up to 15% of their earnings (as defined in our ESPP) for the purchase of our Class A common stock under our ESPP. Unless otherwise determined by our board of directors, common stock will be purchased for the accounts of employees participating in our ESPP at a price per share equal to the lesser of (i) 85% of the fair market value of a share of our Class A common stock on the first day of an offering; or (ii) 85% of the fair market value of a share of our Class A common stock on the date of purchase.
Limitations. Employees may have to satisfy one or more of the following service requirements before participating in our ESPP, as determined by our board of directors: (i) being customarily employed for more than 20 hours per week; (ii) being customarily employed for more than five months per calendar year; or (iii) continuous employment with us or one of our affiliates for a period of time (not to exceed two years). No employee will be permitted to purchase shares under our ESPP at a rate in excess of $25,000 worth of our common stock (based on the fair market value per share of our common stock at the beginning of an offering) for each calendar year such a purchase right is outstanding. Finally, no employee will be eligible for the grant of any purchase rights under our ESPP if immediately after such rights are granted, such employee has voting power over 5% or more of our outstanding capital stock measured by vote or value under Section 424(d) of the Code.
Changes to Capital Structure. Our ESPP provides that in the event there occurs a change in our capital structure through such actions as a stock split, merger, consolidation, reorganization, recapitalization, reincorporation, stock dividend, dividend in property other than cash, large nonrecurring cash dividend, liquidating dividend, combination of shares, exchange of shares, change in corporate structure, or similar transaction, our board of directors will make appropriate adjustments to: (i) the class(es) and maximum number of shares reserved under our ESPP; (ii) the class(es) and maximum number of shares by which the share reserve may increase automatically each year; (iii) the class(es) and number of shares subject to, and purchase price applicable to, outstanding offerings and purchase rights; and (iv) the class(es) and number of shares that are subject to purchase limits under ongoing offerings.
Corporate Transactions. Our ESPP provides that in the event of a corporate transaction (as defined below), any then-outstanding rights to purchase our stock under our ESPP may be assumed, continued, or substituted for by any surviving or acquiring entity (or its parent company). If the surviving or acquiring entity (or its parent company) elects not to assume, continue, or substitute for such purchase rights, then the participants accumulated payroll contributions will be used to purchase shares of our Class A common stock within 10 business days before such corporate transaction, and such purchase rights will terminate immediately after such purchase.
163
Table of Contents
Under our ESPP, a corporate transaction is generally the consummation of (i) a sale or other disposition of all or substantially all of our consolidated assets; (ii) a sale or other disposition of at least 50% of our outstanding securities; (iii) a merger, consolidation, or similar transaction following which we are not the surviving corporation; or (iv) a merger, consolidation, or similar transaction following which we are the surviving corporation but the shares of our common stock outstanding immediately prior to such transaction are converted or exchanged into other property by virtue of the transaction.
Amendment or Termination. Our board of directors will have the authority to amend or terminate our ESPP, except in certain circumstances such amendment or termination may not materially impair any outstanding purchase rights without the holders consent. We will obtain stockholder approval of any amendment to our ESPP as required by applicable law or listing requirements.
2018 Stock Plan
Our board of directors adopted and our stockholders approved the 2018 Plan in June 2018. The 2018 Plan has been periodically amended, most recently in July 2020. The 2018 Plan permits the direct award or sale of shares of common stock, the grant of options to purchase shares of common stock, and the grant of RSUs to acquire shares of common stock. Options granted under the 2018 Plan may be ISOs granted at 100% of the fair value of the Companys common stock on the date of the grant, as determined by the board of directors, and intended to qualify under Code Section 422 or NSOs which are not intended to so qualify. ISOs may be granted only to our employees and to any of our parent or subsidiary corporations employees. All other awards may be granted to employees, directors and consultants of ours and to any of our parent or subsidiary corporations employees or consultants. The 2018 Plan will be terminated prior to the closing of this offering, and thereafter we will not grant any additional awards under the 2018 Plan. However, the 2018 Plan will continue to govern the terms and conditions of the outstanding awards previously granted thereunder.
2015 Stock Plan
Our board of directors adopted and our stockholders approved the 2015 Plan in June 2015 and in July 2015, respectively. The 2015 Plan permits the direct award or sale of shares of common stock, the grant of Options to purchase shares of common stock, and the grant of RSUs to acquire shares of common stock. Options granted under the 2015 Plan may be ISOs granted at 100% of the fair value of the Companys common stock on the date of the grant, as determined by the board of directors, and intended to qualify under Code Section 422 or NSOs which are not intended to so qualify. ISOs may be granted only to our employees and to any of our parent or subsidiary corporations employees. All other awards may be granted to employees, directors, and consultants of ours and to any of our parent or subsidiary corporations employees or consultants. Upon adoption of the 2018 Plan, the 2015 Plan was terminated. Thereafter, we have not granted any additional awards under the 2015 Plan. However, the 2015 Plan continues to govern the terms and conditions of the outstanding awards previously granted thereunder.
Limitations of Liability and Indemnification Matters
On the closing of this offering, our amended and restated certificate of incorporation will contain provisions that limit the liability of our current and former directors for monetary damages to the fullest extent permitted by Delaware law. Delaware law provides that directors of a corporation will not be personally liable for monetary damages for any breach of fiduciary duties as directors, except liability for:
| | any breach of the directors duty of loyalty to the corporation or its stockholders; |
| | any act or omission not in good faith or that involves intentional misconduct or a knowing violation of law; |
| | unlawful payments of dividends or unlawful stock repurchases or redemptions; or |
| | any transaction from which the director derived an improper personal benefit. |
164
Table of Contents
Such limitation of liability does not apply to liabilities arising under federal securities laws and does not affect the availability of equitable remedies such as injunctive relief or rescission.
Our amended and restated certificate of incorporation that will be in effect on the closing of this offering will authorize us to indemnify our directors, officers, employees, and other agents to the fullest extent permitted by Delaware law. Our amended and restated bylaws that will be in effect on the closing of this offering will provide that we are required to indemnify our directors and officers to the fullest extent permitted by Delaware law and may indemnify our other employees and agents. Our amended and restated bylaws that will be in effect on the closing of this offering will also provide that, on satisfaction of certain conditions, we will advance expenses incurred by a director or officer in advance of the final disposition of any action or proceeding, and permit us to secure insurance on behalf of any officer, director, employee, or other agent for any liability arising out of his or her actions in that capacity regardless of whether we would otherwise be permitted to indemnify him or her under the provisions of Delaware law. We have entered and expect to continue to enter into agreements to indemnify our directors, executive officers, and other employees as determined by the board of directors. With certain exceptions, these agreements provide for indemnification for related expenses including attorneys fees, judgments, fines, and settlement amounts incurred by any of these individuals in any action or proceeding. We believe that these amended and restated certificate of incorporation and amended and restated bylaw provisions and indemnification agreements are necessary to attract and retain qualified persons as directors and officers. We also maintain customary directors and officers liability insurance.
The limitation of liability and indemnification provisions in our amended and restated certificate of incorporation and amended and restated bylaws may discourage stockholders from bringing a lawsuit against our directors for breach of their fiduciary duty. They may also reduce the likelihood of derivative litigation against our directors and officers, even though an action, if successful, might benefit us and other stockholders. Further, a stockholders investment may be adversely affected to the extent that we pay the costs of settlement and damage awards against directors and officers as required by these indemnification provisions.
Insofar as indemnification for liabilities arising under the Securities Act may be permitted for directors, executive officers, or persons controlling us, we have been informed that, in the opinion of the SEC, such indemnification is against public policy as expressed in the Securities Act and is therefore unenforceable.
Rule 10b5-1 Sales Plans
Our directors and officers may adopt written plans, known as Rule 10b5-1 plans, in which they will contract with a broker to buy or sell shares of our Class A common stock or Class B common stock on a periodic basis. Under a Rule 10b5-1 plan, a broker executes trades under parameters established by the director or officer when entering into the plan, without further direction from them. The director or officer may amend a Rule 10b5-1 plan in some circumstances and may terminate a plan at any time. Our directors and executive officers may also buy or sell additional shares outside of a Rule 10b5-1 plan when they do not possess of material nonpublic information, subject to compliance with the terms of our insider trading policy.
165
Table of Contents
CERTAIN RELATIONSHIPS AND RELATED PARTY TRANSACTIONS
Other than compensation arrangements for our directors and executive officers, which are described elsewhere in this prospectus, below we describe transactions since January 1, 2018 to which we were a party or will be a party, in which:
| | the amounts involved exceeded or will exceed $120,000; and |
| | any of our directors, executive officers, or holders of more than 5% of our capital stock, or any member of the immediate family of, or person sharing the household with, the foregoing persons, had or will have a direct or indirect material interest. |
Series B Convertible Preferred Stock Financing
In March 2018, we sold 43,734,270 shares of our Series B-1 convertible preferred stock and 12,972,030 shares of our Series B-2 convertible preferred stock, in each case at a price per share of $2.6981, for an aggregate purchase price of approximately $153.0 million in private placements to accredited investors. The table below sets forth the number of shares of our Series B-1 and Series B-2 convertible preferred stock purchased by our executive officers, directors, holders of more than 5% of our capital stock and their affiliated entities or immediate family members. Each share of Series B-1 and Series B-2 convertible preferred stock will automatically convert into one share of our Class A common stock immediately prior to the closing of this offering. The holders of our Series B-1 and Series B-2 convertible preferred stock listed below are entitled to specified registration rights. See the section titled Description of Capital StockRegistration Rights for additional information regarding these registration rights.
| Participants |
Number of Series B-1 Shares Purchased |
Number of Series B-2 Shares Purchased |
Aggregate Purchase Price |
|||||||||
| Entities affiliated with Accel(1) |
24,605,520 | 7,298,280 | $ | 86,080,068 | ||||||||
| CapitalG LP(2) |
10,004,580 | 2,967,450 | 35,000,007 | |||||||||
| Digital East Fund 2013 SCA SICAR(3) |
2,947,770 | 874,350 | 10,312,513 | |||||||||
| Thomas Mendoza(4) |
57,180 | 16,950 | 200,011 | |||||||||
| (1) | Entities affiliated with Accel holding our securities whose shares are aggregated for purposes of reporting share ownership information are Accel Growth Fund Investors 2016 L.L.C., Accel Growth Fund IV L.P., Accel Growth Fund IV Strategic Partners L.P., Accel London Investors 2016 L.P., Accel London V L.P. and Accel London V Strategic Partners L.P. These entities beneficially own more than 5% of our outstanding capital stock. Richard P. Wong and Philippe Botteri, each a member of our board of directors, is a Managing Partner and Partner of Accel, respectively. Thomas Mendoza, a member of our board of directors, is a director of Varonis Systems, Inc., an affiliate of Accel. |
| (2) | CapitalG LP and its affiliated entities collectively beneficially own more than 5% of our outstanding capital stock. Laela Sturdy, a member of our board of directors, is a General Partner at CapitalG LP. |
| (3) | Digital East Fund 2013 SCA SICAR is affiliated with Earlybird Management S.A. The entities affiliated with Earlybird Management S.A. beneficially own more than 5% of our outstanding capital stock and Dan Lupu, a former member of our board of directors, is a Partner and Manager of Earlybird Advisory SARL, the Advisor to Earlybird Management S.A. |
| (4) | Thomas Mendoza is a member of our board of directors. |
Series C Convertible Preferred Stock Financing
In September and October 2018, we sold an aggregate of 19,625,772 shares of our Series C-1 convertible preferred stock and 16,459,311 shares of our Series C-2 convertible preferred stock, in each case at a price per share of $6.37936, for an aggregate purchase price of approximately $230.2 million in private placements to accredited investors. The table below sets forth the number of shares of our Series C-1 and Series C-2 convertible preferred stock purchased by our executive officers, directors, holders of more than 5% of our capital stock and their affiliated entities or immediate family members. Each share of Series C-1 and Series C-2 convertible
166
Table of Contents
preferred stock will automatically convert into one share of our Class A common stock in connection with the closing of this offering. The holders of our Series C-1 and Series C-2 convertible preferred stock listed below are entitled to specified registration rights. See the section titled Description of Capital StockRegistration Rights for additional information regarding these registration rights.
| Participants |
Number of Series C-1 Shares Purchased |
Number of Series C-2 Shares Purchased |
Aggregate Purchase Price |
|||||||||
| Entities affiliated with Accel(1) |
4,357,410 | 3,480,357 | $ | 49,999,990 | ||||||||
| Entities affiliated with CapitalG LP(2) |
8,714,820 | 6,960,717 | 99,999,998 | |||||||||
| Entities affiliated with Sequoia Capital Operations, LLC(3) |
6,536,112 | 5,220,540 | 74,999,994 | |||||||||
| Thomas F. Mendoza Revocable Trust(4) |
17,430 | 13,920 | 199,993 | |||||||||
| (1) | Entities affiliated with Accel holding our securities whose shares are aggregated for purposes of reporting share ownership information are Accel Growth Fund IV L.P., Accel Growth Fund IV Strategic Partners L.P., Accel Growth Fund Investors 2016 L.L.C., Accel Leaders Fund L.P. and Accel Leaders Fund Investors 2016 L.L.C. These entities beneficially own more than 5% of our outstanding capital stock and Richard P. Wong and Philippe Botteri, each a member of our board of directors, is a Managing Partner and Partner of Accel, respectively. Thomas Mendoza, a member of our board of directors, is a director of Varonis Systems, Inc., an affiliate of Accel. |
| (2) | Entities affiliated with CapitalG LP holding our securities whose shares are aggregated for purposes of reporting share ownership information are CapitalG LP and CapitalG II LP. These entities collectively beneficially own more than 5% of our outstanding capital stock. Laela Sturdy, a member of our board of directors, is a General Partner at CapitalG LP. |
| (3) | Entities affiliates with Sequoia Capital Operations, LLC holding our securities whose shares are aggregated for purposes of reporting share ownership information are Sequoia Capital U.S. Growth Fund VII, L.P., Sequoia Capital U.S. Growth VII Principals Fund, L.P., and Sequoia Capital U.S. Growth Fund VIII, L.P. Carl Eschenbach, a member of our board of directors, is a Partner at Sequoia Capital Operations, LLC. |
| (4) | Thomas Mendoza, a member of our board of directors, is the trustee and a beneficiary of the Thomas F. Mendoza Revocable Trust. |
Issuer Tender Offer
In October 2018, we commenced a tender offer to purchase shares of our Class A common stock from certain of our employees and former employees at a price per share of $6.37936. We purchased 5,276,901 shares of Class A common stock in the tender offer for an aggregate purchase price of approximately $33.7 million. Mihai Faur, our current Chief Accounting Officer and Global Controller who was serving as our Chief Financial Officer at the time of the tender offer, sold 178,977 shares of Class A common stock to us in the tender offer for an aggregate purchase price of approximately $1.1 million.
167
Table of Contents
Series D Convertible Preferred Stock Financing
In April and July 2019, we sold an aggregate of 34,504,224 shares of our Series D-1 convertible preferred stock and 9,986,862 shares of our Series D-2 convertible preferred stock, in each case at a price per share of $13.11723, for an aggregate purchase price of approximately $583.6 million in private placements to accredited investors. The table below sets forth the number of shares of our Series D-1 and Series D-2 convertible preferred stock purchased by our executive officers, directors, holders of more than 5% of our capital stock and their affiliated entities or immediate family members. Each share of Series D-1 and Series D-2 convertible preferred stock will automatically convert into one share of our Class A common stock in connection with the closing of this offering. The holders of our Series D-1 and Series D-2 convertible preferred stock listed below are entitled to specified registration rights. See the section titled Description of Capital StockRegistration Rights for additional information regarding these registration rights.
| Participants |
Number of Series D-1 Shares Purchased |
Number of Series D-2 Shares Purchased |
Aggregate Purchase Price |
|||||||||
| Entities affiliated with Accel(1) |
979,122 | 164,412 | $ | 15,000,002 | ||||||||
| CapitalG II LP(2) |
1,631,871 | 274,020 | 25,000,017 | |||||||||
| Entities affiliated with Sequoia Capital Operations, LLC(3) |
195,825 | 32,883 | 3,000,016 | |||||||||
| Thomas F. Mendoza Revocable Trust(4) |
13,053 | 2,193 | 199,985 | |||||||||
| (1) | Entities affiliated with Accel holding our securities whose shares are aggregated for purposes of reporting share ownership information are Accel Leaders Fund L.P., Accel Leaders Fund Investors 2016 L.L.C., Accel Growth Fund IV L.P., Accel Growth Fund IV Strategic Partners L.P. and Accel Growth Fund Investors 2016 L.L.C. These entities beneficially own more than 5% of our outstanding capital stock and Richard P. Wong and Philippe Botteri, each a member of our board of directors, is a Managing Partner and Partner of Accel, respectively. Thomas Mendoza, a member of our board of directors, is a director of Varonis Systems, Inc., an affiliate of Accel. |
| (2) | CapitalG II LP and its affiliated entities collectively beneficially own more than 5% of our outstanding capital stock. Laela Sturdy, a member of our board of directors, is a General Partner at CapitalG II LP. |
| (3) | Entities affiliates with Sequoia Capital Operations, LLC holding our securities whose shares are aggregated for purposes of reporting share ownership information are Sequoia Capital U.S. Growth Fund VII, L.P. and Sequoia Capital U.S. Growth Fund VIII, L.P. Carl Eschenbach, a member of our board of directors, is a Partner at Sequoia Capital Operations, LLC. |
| (4) | Thomas Mendoza, a member of our board of directors, is the trustee and a beneficiary of the Thomas F. Mendoza Revocable Trust. |
Series E Convertible Preferred Stock Financing
In July 2020, we sold an aggregate of 12,149,646 shares of our Series E convertible preferred stock at a price per share of $18.59346 for an aggregate purchase price of approximately $225.9 million in private placements to accredited investors. The table below sets forth the number of shares of our Series E convertible preferred stock purchased by our executive officers, directors, holders of more than 5% of our capital stock, and their affiliated entities or immediate family members. Each share of Series E convertible preferred stock will automatically convert into one share of our Class A common stock immediately prior to the closing of this offering. The holders of our Series E convertible preferred stock listed below are entitled to specified registration rights. See the section titled Description of Capital StockRegistration Rights for additional information regarding these registration rights.
| Participants |
Number of Series E Shares Purchased |
Aggregate Purchase Price |
||||||
| Entities affiliated with Accel(1) |
53,782 | $ | 999,994 | |||||
| Entities affiliated with Sequoia Capital Operations, LLC(2) |
53,782 | 999,994 | ||||||
168
Table of Contents
| (1) | Entities affiliated with Accel holding our securities whose shares are aggregated for purposes of reporting share ownership information are Accel Leaders Fund L.P., Accel Leaders Fund Investors 2016 L.L.C., Accel London V L.P., Accel London V Strategic Partners L.P. and Accel London Investors 2016 L.P. These entities beneficially own more than 5% of our outstanding capital stock and Richard P. Wong and Philippe Botteri, each a member of our board of directors, is a Managing Partner and Partner of Accel, respectively. Thomas Mendoza, a member of our board of directors, is a director of Varonis Systems, Inc., an affiliate of Accel. |
| (2) | Entities affiliates with Sequoia Capital Operations, LLC holding our securities whose shares are aggregated for purposes of reporting share ownership information are Sequoia Capital U.S. Growth Fund VII, L.P. and Sequoia Capital U.S. Growth Fund VIII, L.P. Carl Eschenbach, a member of our board of directors, is a Partner at Sequoia Capital Operations, LLC. |
Repurchases of Outstanding Stock
In 2018 and 2019, as required by Section 1.3 of each of the stock purchase agreements entered into in connection with the Series B, Series C and Series D convertible preferred stock financings described above, we repurchased from our employees an aggregate of 13,812,285 shares of Class A common stock and an aggregate of 25,441,506 shares of Class B common stock, in each case for a price per share in excess of fair value and using proceeds raised in each respective convertible preferred stock financing, for aggregate consideration of approximately $268.8 million. The table below sets forth the number of shares of Class B common stock repurchased from Daniel Dines, our Chief Executive Officer, Co-Founder, and Chairman:
| Repurchase Date |
Number of Class B Common Shares Repurchased |
Aggregate Repurchase Amount |
||||||
| March 2018 |
10,080,330 | $ | 27,197,873 | |||||
| October 2018 |
10,189,098 | $ | 64,999,992 | |||||
| April 2019 |
5,172,078 | $ | 67,843,354 | |||||
Investor Rights, Voting, and Right of First Refusal and Co-Sale Agreements
In connection with our convertible preferred stock financings, we entered into investor rights, voting, right of first refusal, and co-sale agreements containing registration rights, information rights, voting rights, board representation rights, indemnification provisions and rights of first refusal, among other things, with certain holders of our convertible preferred stock and certain holders of our common stock, including entities affiliated with Accel, entities affiliated with CapitalG LP, entities affiliated with Earlybird Management S.A., Daniel Dines, and Thomas Mendoza and affiliated entities.
The covenants included in these stockholder agreements generally will terminate upon the closing of this offering, except with respect to registration rights, as more fully described in the section titled Description of Capital StockRegistration Rights. See also the section titled Principal and Selling Stockholders for additional information regarding beneficial ownership of our capital stock.
Equity Grants to Directors and Executive Officers
We have granted stock options, RSUs and RSAs to certain of our directors and executive officers. For more information regarding the stock options and stock awards granted to our directors and named executive officers, see the sections titled ManagementNon-Employee Director Compensation and Executive Compensation.
Loans to Officers
On February 6, 2019 and March 6, 2019, we entered into loan agreements with Ashim Gupta, our Chief Financial Officer, pursuant to which we provided Mr. Gupta with principal loan amounts of $161,700 and $13,475, respectively, to facilitate his exercise of stock options under the 2018 Plan. Neither of these loans accrued interest and each loan was repaid in full by Mr. Gupta on November 3, 2020.
169
Table of Contents
Consulting Arrangement with Former Director
Following Alexandru Iancus resignation from our board of directors, we entered into a procurement agreement with Mr. Iancu to provide certain services to us. Pursuant to this agreement, in March 2021 we granted Mr. Iancu options to purchase 25,783 shares of Class A common stock and reimbursement for certain expenses.
Indemnification Agreements
Our amended and restated certificate of incorporation that will be in effect on the closing of this offering will contain provisions limiting the liability of directors, and our amended and restated bylaws that will be in effect on the closing of this offering will provide that we will indemnify each of our directors and officers to the fullest extent permitted under Delaware law. Our amended and restated certificate of incorporation and amended and restated bylaws that will be in effect on the closing of this offering will also provide our board of directors with discretion to indemnify our employees and other agents when determined appropriate by the board. In addition, we have entered into an indemnification agreement with each of our directors and executive officers, which requires us to indemnify them. For more information regarding these agreements, see the section titled Executive CompensationLimitations of Liability and Indemnification Matters.
Relationship with an Immediate Family Member of our Chief Executive Officer
In August 2019, Aharon Dines, the brother of Daniel Dines, our Chief Executive Officer, Co-Founder, and Chairman, entered into an employment agreement with Adecco Israel Staffing Services Ltd. to serve as a security specialist providing services to us. Pursuant to this agreement, we paid Aharon Dines $177,986 in compensation for the fiscal year ended January 31, 2020, which included approximately $50,000 in cash compensation, 15,246 RSUs with an aggregate grant date fair value of $119,986, and approximately $8,000 related to the accrual of a cash bonus. For the fiscal year ended January 31, 2021, we paid Aharon Dines $191,860 in compensation, which included approximately $100,000 in cash compensation and 6,000 RSUs with an aggregate grant date fair value of $91,860. For the fiscal year ended January 31, 2021, Aharon Dines also earned approximately $23,000 related to the accrual of a cash bonus, which we expect to pay during the fiscal year ending January 31, 2022. Additionally, in March 2021, we granted Aharon Dines options to purchase 7,000 shares of Class A common stock at an exercise price of $0.10 per share, with an aggregate grant date fair value of $407,750.
Policies and Procedures for Transactions with Related Persons
Prior to the closing of this offering, we intend to adopt a policy that our executive officers, directors, nominees for election as a director, beneficial owners of more than 5% of any class of our common stock, and any members of the immediate family of any of the foregoing persons are not permitted to enter into a related person transaction with us without the approval or ratification of our board of directors or our audit committee. Any request for us to enter into a transaction with an executive officer, director, nominee for election as a director, beneficial owner of more than 5% of any class of our common stock, or any member of the immediate family of any of the foregoing persons, in which the amount involved exceeds $120,000 and such person would have a direct or indirect interest, must be presented to our board of directors or our audit committee for review, consideration, and approval. In approving or rejecting any such proposal, our board of directors or our audit committee is to consider the material facts of the transaction, including whether the transaction is on terms no less favorable than terms generally available to an unaffiliated third party under the same or similar circumstances and the extent of the related persons interest in the transaction.
170
Table of Contents
PRINCIPAL AND SELLING STOCKHOLDERS
The following table sets forth information with respect to the beneficial ownership of our shares as of January 31, 2021 by:
| | each named executive officer; |
| | each of our directors; |
| | our directors and executive officers as a group; |
| | each of the selling stockholders; and |
| | each other person or entity known by us to own beneficially more than 5% of our Class A common stock and Class B common stock (by number or by voting power). |
We have determined beneficial ownership in accordance with the rules and regulations of the SEC, and the information is not necessarily indicative of beneficial ownership for any other purpose. Except as indicated by the footnotes below, we believe, based on information furnished to us, that the persons and entities named in the table below have sole voting and sole investment power with respect to all shares that they beneficially own, subject to applicable community property laws.
Applicable percentage ownership before this offering is based on 408,294,571 shares of Class A common stock and 83,835,916 shares of Class B common stock outstanding as of January 31, 2021, assuming (1) the automatic conversion of all outstanding shares of convertible preferred stock into 306,300,407 shares of Class A common stock (after giving effect to the Series F Financing), which will occur immediately prior to the closing of this offering, and (2) the Class B Conversion. Applicable percentage ownership after this offering is based on (1) 419,094,123 shares of Class A common stock and (2) 82,452,748 shares of Class B common stock outstanding immediately after the closing of this offering, assuming no exercise by the underwriters of their option to purchase additional shares of Class A common stock from us and excluding any potential purchases in this offering by the persons and entities named in the table below. In computing the number of shares beneficially owned by a person and the percentage ownership of such person, we deemed to be outstanding all shares subject to options or RSUs held by the person that are currently exercisable, or exercisable or would vest based on service-based vesting conditions within 60 days of January 31, 2021. However, except as described above, we did not deem such shares outstanding for the purpose of computing the percentage ownership of any other person.
The following table does not reflect any shares of Class A common stock that may be purchased pursuant to our directed share program described under Underwriting. If any shares are purchased by our existing principal stockholders, directors, officers or their affiliated entities, the number and percentage of shares of our Class A common stock beneficially owned by them after this offering will differ from those set forth in the following table.
Unless otherwise indicated, the address for each beneficial owner listed in the table below is c/o UiPath, Inc., 90 Park Ave, 20th Floor, New York, New York 10016.
171
Table of Contents
| Beneficial Ownership Before the Offering |
Number of Shares of Class A Common Stock Being Offered |
Beneficial Ownership After the Offering |
||||||||||||||||||||||||||||||||||||||||||
| Class A Common Stock |
Class B Common Stock |
% of Total Voting Power Before the Offering |
Class A Common Stock |
Class B Common Stock |
% of Total Voting Power After the Offering |
|||||||||||||||||||||||||||||||||||||||
| Name of Beneficial Owner |
Shares | % | Shares | % | Shares | % | Shares | % | ||||||||||||||||||||||||||||||||||||
| 5% Stockholders: |
||||||||||||||||||||||||||||||||||||||||||||
| Daniel Dines(1) |
27,057,582 | 6.6 | 83,835,916 | 100.0 | 64.4 | 1,383,168 | 27,057,582 | 6.5 | 82,452,748 | 100.0 | 88.1 | |||||||||||||||||||||||||||||||||
| Entities associated with Accel(2) |
106,287,673 | 26.0 | | | 9.9 | 5,314,386 | 100,973,287 | 24.1 | | | 3.1 | |||||||||||||||||||||||||||||||||
| Entities associated with Earlybird Management S.A.(3) |
42,007,171 | 10.3 | | | 3.9 | 2,100,400 | 39,906,771 | 9.5 | | | 1.2 | |||||||||||||||||||||||||||||||||
| Entities associated with CapitalG LP(4) |
30,553,458 | 7.5 | | | 2.9 | 1,527,673 | 29,025,785 | 6.9 | | | * | |||||||||||||||||||||||||||||||||
| Other Directors and Named Executive Officers: |
||||||||||||||||||||||||||||||||||||||||||||
| Thomas Hansen |
1,482,723 | * | | | * | | 1,482,723, | * | | | * | |||||||||||||||||||||||||||||||||
| Ted Kummert(5) |
779,304 | * | | | * | | 779,304 | * | | | * | |||||||||||||||||||||||||||||||||
| Philippe Botteri(6) |
106,287,673 | 26.0 | | | 9.9 | 5,314,386 | 100,973,287 | 24.1 | | | 3.1 | |||||||||||||||||||||||||||||||||
| Carl Eschenbach(7) |
| | | | | | | | | | | |||||||||||||||||||||||||||||||||
| Michael Gordon |
121,033 | * | | | * | | 121,033 | * | | | * | |||||||||||||||||||||||||||||||||
| Kimberly L. Hammonds(8) |
17,186 | * | | | * | | 17,186 | * | | | * | |||||||||||||||||||||||||||||||||
| Thomas Mendoza(9) |
1,831,846 | * | | | * | 120,726 | 1,711,120 | * | | | * | |||||||||||||||||||||||||||||||||
| Daniel D. Springer(10) |
| | | | | | | | | | | |||||||||||||||||||||||||||||||||
| Laela Sturdy(11) |
30,553,458 | 7.5 | | | 2.9 | 1,527,673 | 29,025,785 | 6.9 | | | * | |||||||||||||||||||||||||||||||||
| Jennifer Tejada(12) |
| | | | | | | | | | | |||||||||||||||||||||||||||||||||
| Richard P. Wong(13) |
106,287,673 | 26.0 | | | 9.9 | 5,314,386 | 100,973,287 | 24.1 | | | 3.1 | |||||||||||||||||||||||||||||||||
| All directors and executive officers as a group (14 persons)(14) |
169,003,253 | 41.2 | 83,835,916 | 100.0 | 77.6 | 8,345,953 | 162,040,468 | 38.5 | 82,452,748 | 100.0 | 92.2 | |||||||||||||||||||||||||||||||||
| Other Selling Stockholders: |
||||||||||||||||||||||||||||||||||||||||||||
| Credo Stage II L.P.(15) |
14,515,420 | 3.6 | | | 1.4 | 726,000 | 13,789,420 | 3.3 | | | * | |||||||||||||||||||||||||||||||||
| Entities associated with Coatue(16) |
13,348,698 | 3.3 | | | 1.2 | 1,766,337 | 11,582,361 | 2.8 | | | * | |||||||||||||||||||||||||||||||||
| Institutional Venture Partners XVI, L.P.(17) |
9,416,263 | 2.3 | | | * | 472,420 | 8,943,843 | 2.1 | | | * | |||||||||||||||||||||||||||||||||
| KPCB Holdings, Inc., as Nominee(18) |
5,559,420 | 1.4 | | | * | 277,971 | 5,281,449 | 1.3 | | | * | |||||||||||||||||||||||||||||||||
| Entities associated with Seedcamp(19) |
3,882,991 | 1.0 | | | * | 194,150 | 3,688,841 | * | | | * | |||||||||||||||||||||||||||||||||
| Entities associated with Harmony(20) |
2,601,987 | * | | | * | 136,000 | 2,465,987 | * | | | * | |||||||||||||||||||||||||||||||||
| Entities associated with Meritech Capital Partners(21) |
2,141,793 | * | | | * | 107,092 | 2,034,701 | * | | | * | |||||||||||||||||||||||||||||||||
| Certain Other Selling Stockholders(22) |
3,615,130 | * | | | * | 348,070 | 3,267,060 | * | | | * | |||||||||||||||||||||||||||||||||
| * | Represents beneficial ownership or outstanding total voting power, as applicable, of less than 1%. |
| | Percentage of total voting power represents voting power with respect to all shares of our Class A and Class B common stock, as a single class. The holders of our Class B common stock are entitled to 35 votes per share, and holders of our Class A common stock are entitled to one vote per share. See the section titled Description of Capital StockClass A Common Stock and Class B Common Stock for additional information about the voting rights of our Class A and Class B common stock. |
| (1) | Before giving effect to the Class B Conversion, consists of (a) 26,347,495 shares of Class B common stock held by Mr. Dines, (b) 240,000 shares of Class A common stock held by Alexandra Dines, Mr. Dines spouse, and (c) 84,306,003 shares of Class B common stock held by Ice Vulcan Holding Limited. In connection with the Class B Conversion, 26,347,495 shares of Class B common stock held by Mr. Dines will be converted into an equivalent number of shares of Class A common stock and 470,087 shares of Class A common stock held by Ice Vulcan Holding Limited will be converted into an equivalent number of shares of Class A common stock, each prior to the closing of this offering. 1,383,168 shares of Class B common stock beneficially owned by Mr. Dines will be converted into 1,383,168 shares of Class A common stock in connection with this offering and are being offered for sale pursuant to the registration statement of which this prospectus forms a part. IceVulcan Investments Ltd. is the sole shareholder of Ice Vulcan Holding Limited, and Mr. Dines is the sole shareholder of IceVulcan Investments Ltd. Mr. Dines retains sole voting and investment power with respect to the shares of Class B common stock held by Ice Vulcan Holding Limited. |
| (2) | Consists of (a) 1,361,739 shares of Class A common stock held by Accel Growth Fund Investors 2016 L.L.C., (b) 28,470,054 shares of Class A common stock held by Accel Growth Fund IV L.P., (c) 161,979 shares of Class A common stock held by Accel Growth Fund IV Strategic Partners L.P., (d) 328,862 shares of Class A common stock held by Accel Leaders Fund Investors 2016 L.L.C., (e) 6,883,068 shares of Class A common stock held by Accel Leaders Fund L.P., (f) 6,003,207 shares of Class A common stock held by Accel London Investors 2016 L.P., (g) 62,132,346 shares of Class A common stock held by Accel London V L.P., and (h) 946,418 shares of Class A common stock held by Accel London V Strategic Partners L.P., or collectively, the Accel Shares. 84,457 of such shares held by Accel Growth Fund Investors 2016 L.L.C., 1,765,783 of such shares held by Accel Growth Fund IV L.P., 10,046 of such shares held by Accel Growth Fund IV Strategic Partners L.P., 300,161 of such shares held by Accel London Investors 2016 L.P., 3,106,618 of such shares held by Accel London V L.P., and 47,321 of such shares held by Accel London V Strategic Partners L.P. are being offering for sale pursuant to the registration statement of which this prospectus forms a part. Accel Growth Fund IV Associates L.L.C., or AGF4A, is the General Partner of both Accel Growth Fund IV L.P. and Accel Growth Fund IV Strategic Partners L.P., and has sole voting and investment power. Andrew G. Braccia, Sameer K. Gandhi, Ping Li, Tracy L. Sedlock, |
172
Table of Contents
| Ryan J. Sweeney, and Richard P. Wong are the Managing Members of AGF4A and share such powers. Andrew G. Braccia, Sameer K. Gandhi, Ping Li, Tracy L. Sedlock, Ryan J. Sweeney, and Richard P. Wong are the Managing Members of Accel Growth Fund Investors 2016 L.L.C. and share the voting and investment powers. Accel Leaders Fund Associates L.L.C., or ALFA, is the General Partner of Accel Leaders Fund L.P. and has sole voting and investment power. Andrew G. Braccia, Sameer K. Gandhi, Ping Li, Tracy L. Sedlock, Ryan J. Sweeney, and Richard P. Wong are the Managing Members of ALFA and share such powers. Andrew G. Braccia, Sameer K. Gandhi, Ping Li, Tracy L. Sedlock, Ryan J. Sweeney, and Richard P. Wong are the Managing Members of Accel Leaders Fund Investors 2016 L.L.C. and share voting and investment powers. Accel London V Associates L.L.C., or ALA L.L.C., is the General Partner of Accel London V Associates L.P., which is the general partner of each of Accel London V L.P., and Accel London V Strategic Partners L.P. ALA L.L.C. has sole voting and investment power. Philippe Botteri, Hendrik Nelis, and Sonali de Rycker are the managers of ALA L.L.C. and share such powers. ALA L.L.C. is the General Partner of Accel London Investors 2016 L.P. and has sole voting and investment power. Philippe Botteri, Hendrik Nelis, and Sonali de Rycker are the managers of ALA L.L.C. and share such powers. The address for all Accel entities listed above is 500 University Avenue, Palo Alto, California, 94301, USA. |
| (3) | Consists of 42,007,171 shares of Class A common stock held by Digital East Fund 2013 SCA SICAR. 2,100,400 of such shares are being offered for sale pursuant to the registration statement of which this prospectus forms a part. Earlybird Management S.A., the general partner of Digital East Fund 2013 SCA SICAR, and RSM Fund Management Luxembourg S.A., the Alternative Investment Fund Manager of Digital East Fund 2013 SCA SICAR, may be deemed to share voting and investment power over the shares held by Digital East Fund 2013 SCA SICAR. The address for each of Digital East Fund 2013 SCA SICAR and Earlybird Management S.A. is 7, Avenue Gaston Diderich, L-1420 Luxembourg, and the address for RSM Fund Management Luxembourg S.A. is 6, Rue Adolphe, L-1116 Luxembourg. |
| (4) | Consists of (a) 16,890,915 shares of Class A common stock held by CapitalG LP and (b) 13,662,543 shares of Class A common stock held by CapitalG II LP. 1,527,673 of such shares held by CapitalG LP are being offered for sale pursuant to the registration statement of which this prospectus forms a part. CapitalG GP LLC, the general partner of CapitalG LP, CapitalG II GP LLC, the general partner of CapitalG II LP, Alphabet Holdings LLC, the managing member of each of CapitalG GP LLC and CapitalG II GP LLC, XXVI Holdings Inc., the managing member of Alphabet Holdings LLC, and Alphabet Inc., the controlling stockholder of XXVI Holdings Inc., may each be deemed to share voting and investment power over the shares held by CapitalG LP and CapitalG II LP. Laela Sturdy, a member of our board of directors, is a General Partner at CapitalG LP and CapitalG II LP and may be deemed to share voting and investment power over the shares held by CapitalG LP and CapitalG II LP. The address of each of these entities is 1600 Amphitheatre Parkway, Mountain View, California 94043. |
| (5) | Consists of 779,304 shares of Class A common stock issuable upon the exercise of options. Mr. Kummert holds RSUs, none of which will vest within 60 days of January 31, 2021. |
| (6) | Consists of the shares set forth in (2). Mr. Botteri also holds RSUs, none of which will vest within 60 days of January 31, 2021. |
| (7) | Mr. Eschenbach holds RSUs, none of which will vest within 60 days of January 31, 2021. |
| (8) | Ms. Hammonds holds RSUs, none of which will vest within 60 days of January 31, 2021. |
| (9) | Consists of (a) 1,731,846 shares of Class A common stock held by the Amended and Restated Thomas F. Mendoza Revocable Trust, of which Mr. Mendoza is the trustee and a beneficiary and may be deemed to share voting and investment power over such shares and, (b) 100,000 shares of Class A common stock held by the Thomas F. Mendoza 2021 GRAT, of which Mr. Mendoza is the trustee and a beneficiary and may be deemed to share voting and investment power over such shares. 120,726 of such shares held by the Thomas F. Mendoza Revocable Trust are being offered for sale pursuant to the registration statement of which this prospectus forms a part. |
| (10) | Mr. Springer holds RSUs, none of which will vest within 60 days of January 31, 2021. |
| (11) | Consists of the shares set forth in (4). Ms. Sturdy also holds RSUs, none of which will vest within 60 days of January 31, 2021. |
| (12) | Ms. Tejada holds RSUs, none of which will vest within 60 days of January 31, 2021. |
| (13) | Consists of the shares set forth in (2). Mr. Wong also holds RSUs, none of which will vest within 60 days of January 31, 2021. |
| (14) | Consists of (a) 167,920,126 shares of Class A common stock, (b) 83,835,916 shares of Class B common stock, and (c) 1,083,127 shares of Class A common stock issuable upon the exercise of options. |
| (15) | Consists of 14,515,420 shares of Class A common stock held by Credo Stage II L.P. 726,000 of such shares are being offered for sale pursuant to the registration statement of which this prospectus forms a part. Credo Ventures (GP) Limited, the general partner of Credo Stage II L.P., may be deemed to share voting and investment power over the shares held by Credo Stage II L.P. The registered address for both Credo Stage II L.P. and Credo Ventures (GP) Limited is 11 - 15 Seaton Place, St Helier, JE4 0QH, Bailiwick of Jersey. |
| (16) | Consists of (a) 403,368 shares of Class A common stock held by Coatue CT 81 LLC, (b) 1,905,888 shares of Class A common stock held by Coatue CT XXXVIII LLC, (c) 2,613,000 shares of Class A common stock held by Coatue Kona III LP, and (d) 8,426,442 shares of Class A common stock held by Coatue Offshore Master Fund, Ltd. 1,766,337 of such shares held by Coatue Offshore Master Fund, Ltd. are being offering for sale pursuant to the registration statement of which this prospectus forms a part. Each of Coatue CT 81 LLC, Coatue CT XXXVIII LLC, Coatue Kona III LP and Coatue Offshore Master Fund, Ltd. is managed by or affiliated with Coatue Management, L.L.C. The sole owner of Coatue Management, L.L.C. is Coatue Management Partners L.P., for which Coatue Management Partners GP L.L.C. serves as general partner. Mr. Philippe Laffont serves as managing member of Coatue Management Partners GP L.L.C and has voting and dispositive power with respect to shares held by Coatue CT 81 LLC, Coatue CT XXXVIII LLC, Coatue Kona III LP and Coatue Offshore Master Fund, Ltd. The business address for Mr. Laffont and each of the entities identified in this footnote is 9 West 57th Street, 25th Floor, New York, NY 10019. |
| (17) | Consists of 9,416,263 shares of Class A common stock held by Institutional Venture Partners XVI, or IVP XVI. Institutional Venture Management XVI LLC is the general partner of IVP XVI. Todd C. Chaffee, Somesh Dash, Norman A. Fogelsong, Stephen J. Harrick, Eric Liaw, Jules A. Maltz, J. Sanford Miller and Dennis B. Phelps are the managing directors of Institutional Venture Management XVI LLC and may be deemed to share voting and dispositive power over the shares held by IVP XVI. The business address of each of the entities identified in this footnote is c/o Institutional Venture Partners, 3000 Sand Hill Road, Building 2 Suite 250, Menlo Park, CA 94025. |
| (18) | Consists of 5,491,595 shares of Class A common stock held by KPCB Digital Growth Fund III, LLC, or KPCB DGF III, and 67,825 shares of Class A common stock held by KPCB Digital Growth Founders Fund III, LLC, or KPCB DGF FF III. 274,580 of such shares held by KPCB DGF III and 3,391 of such shares held by KPCB DGF FF III are being offered for sale pursuant to the registration statement of which this prospectus forms a part. All shares are held for convenience in the name of KPCB Holdings, Inc., as nominee for the accounts of such entities. The managing member of KPCB DGF III and KPCB DGF FF III is KPCB DGF III Associates, LLC, or DGF III Associates. Mary Meeker, Mahmud Rowghani, Noah Knauf and Theodore E. Schlein, the managing members of DGF III Associates, exercise shared voting and dispositive control over the shares held by KPCB DGF III and KPCB DGF FF III. Such managing members disclaim beneficial ownership of all shares held by KPCB DGF III and KPCB DGF FF III except to the extent of their pecuniary interest therein. The principal business address for all entities and individuals affiliated with Kleiner Perkins Caufield & Byers is c/o Kleiner Perkins Caufield & Byers, LLC, 2750 Sand Hill Road, Menlo Park, CA 94025. |
| (19) | Consists of (a) 806,736 shares of Class A common stock held by SC_3_OF3 HOF, A SERIES OF HOF CAPITAL GROWTH OPPORTUNITY XI, L.P., (b) 489,337 shares of Class A common stock held by SC_3_OF2 LP, and (c) 2,586,918 shares of Class A common stock held by SC_3_OF6. 40,337 of such shares held by SC_3_OF3 HOF, A SERIES OF HOF CAPITAL GROWTH OPPORTUNITY XI, L.P., 24,467 of such shares held by SC_3_OF2 LP, and 129, 346 of such shares held by SC_3_OF6 are being offering for sale pursuant to the registration statement of which this prospectus forms a part. SC_3_OF6 LP is a wholly-owned subsidiary holding company special purpose vehicle, or SPV, of Seedcamp III LP, which is managed by Seedcamp Investment Management LLP and Seedcamp GP LLP is the general partner. Reshma Sohoni and Carlos Espinal are managing partners of Seedcamp III LP and members Seedcamp Investment Management LLP and Seedcamp GP |
173
Table of Contents
| LLP, who share the voting and investment power of the shares in SC_3_OF6 LP. SC_3_OF2 LP is a an SPV affiliate of Seedcamp III LP, which is managed by Seedcamp Investment Management LLP and Seedcamp GP LLP is the general partner. Reshma Sohoni and Carlos Espinal are managing partners of Seedcamp III LP and members of Seedcamp Investment Management LLP and Seedcamp GP LLP, who share the voting and investment power of the shares in SC_3_OF2 LP. SC_3_OF3 HOF, A SERIES OF HOF CAPITAL GROWTH OPPORTUNITY XI, L.P is an SPV affiliate of Seedcamp III LP, which is co-managed by HOF Capital Management, LLC and Seedcamp GP LLP. Reshma Sohoni and Carlos Espinal are managing partners of Seedcamp III LP and members of Seedcamp Investment Management LLP and Seedcamp GP LLP, and Hisham Elhaddad, Onsi Sawiris, and Fady Yacoub, are directors of HOF Capital Management, LLC, who share the voting and investment power of the shares in SC_3_OF3 HOF, A SERIES OF HOF CAPITAL GROWTH OPPORTUNITY XI, L.P. The address for SC_3_OF6 LP is 35 New Bridge Street, London, England, EC4V 6BW, the address for SC_3_OF2 LP is 727-729 High Road, London, England, N12 0BP and the address for SC_3_OF3 HOF, A SERIES OF HOF CAPITAL GROWTH OPPORTUNITY XI, L.P. is 7 Hubert St TH5, New York, NY 10013, United States. |
| (20) | Consists of (a) 948,108 shares of Class A common stock held by Harmony Partners IV, L.P., (b) 806,334 shares of Class A common stock held by Harmony UiPath LLC, (c) 577,545 shares of Class A common stock held by Harmony RPA LLC, and (d) 270,000 shares of Class A common stock held by Harmony Ivy LLC. 136,000 of such shares of Class A common stock are being offered for sale pursuant to the registration statement of which this prospectus is part. 50,000 of such shares held by Harmony Partners IV, L.P., 42,000 of such shares held by Harmony UiPath LLC, 30,000 of such shares held by Harmony RPA LLC, and 14,000 of such shares held by Harmony Ivy LLC are being offering for sale pursuant to the registration statement of which this prospectus forms a part. Harmony Partners GP IV LLC is the General Partner of Harmony Partners IV, L.P. and the Managing Member of Harmony UiPath LLC, Harmony RPA LLC and Harmony Ivy LLC, and has sole voting and investment power. Mark J. Lotke is the Managing Partner of Harmony Partners GP IV LLC and has sole voting and investment power. The address for the entities listed above is 7 West 18th St 6th Floor, New York, New York 10011. |
| (21) | Consists of (a) 2,058,906 shares of Class A common stock held by Meritech Capital Partners VI L.P., (b) 55,044 shares of Class A common stock held by Meritech Capital Affiliates VI L.P., and (c) 27,843 shares of Class A common stock held by Meritech Capital Entrepreneurs VI L.P. 107,092 of such shares of Class A common stock are being offered for sale pursuant to the registration statement of which this prospectus is part. 102,946 of such shares held by Meritech Capital Partners VI L.P., 2,753 of such shares held by Meritech Capital Affiliates VI L.P., and 1,393 of such shares held by Meritech Capital Entrepreneurs VI L.P. are being offering for sale pursuant to the registration statement of which this prospectus forms a part. Meritech Capital Associates VI L.L.C. is the general partner of these partnerships and has sole voting and investment power over these shares. The address for the entities listed above is 245 Lytton Avenue, Suite 350, Palo Alto, California 94301. |
| (22) | Consists of selling stockholders not otherwise listed in this table who collectively own less than 1% of our Class A common stock. |
174
Table of Contents
General
The following description of our capital stock and certain provisions of our amended and restated certificate of incorporation and amended and restated bylaws are summaries and are qualified by reference to the amended and restated certificate of incorporation and the amended and restated bylaws that will be in effect on the closing of this offering. Copies of these documents have been filed with the SEC as exhibits to our registration statement, of which this prospectus forms a part. The descriptions of the common stock and convertible preferred stock reflect changes to our capital structure that will be in effect on the closing of this offering.
On the closing of this offering, our amended and restated certificate of incorporation will provide for two classes of common stock: Class A common stock and Class B common stock. In addition, our amended and restated certificate of incorporation that will be in effect on the closing of this offering will authorize shares of undesignated convertible preferred stock, the rights, preferences, and privileges of which may be designated from time to time by our board of directors.
Upon the closing of this offering, our authorized capital stock will consist of 2,135,741,494 shares, all with a par value of $0.00001 per share, of which:
| | 2,000,000,000 shares are designated Class A common stock; |
| | 115,741,494 shares are designated Class B common stock; and |
| | 20,000,000 shares are designated convertible preferred stock. |
As of January 31, 2021, we had outstanding:
| | 425,901,431 shares of Class A common stock, which assumes (1) the conversion of all of our outstanding shares of convertible preferred stock into 306,300,407 shares of Class A common stock (after giving effect to the Series F Financing), which will occur immediately prior to the closing of this offering, (2) the Class B Conversion, and (3) the net issuance of 17,606,860 shares of Class A common stock following the closing of this offering from the settlement of certain outstanding RSUs for which the service based vesting condition was satisfied on or before the date of this offering and for which the performance-based vesting condition will be satisfied in connection with this offering; and |
| | 83,835,916 shares of Class B common stock, which assumes the Class B Conversion. |
Our outstanding capital stock was held by 3,702 stockholders of record as of January 31, 2021. Our board of directors is authorized, without stockholder approval except as required by the listing standards of the New York Stock Exchange, to issue additional shares of our capital stock.
Class A Common Stock and Class B Common Stock
Voting Rights
The Class A common stock is entitled to one vote per share on any matter that is submitted to a vote of our stockholders. Holders of our Class B common stock are entitled to 35 votes per share on any matter submitted to our stockholders. Holders of shares of Class B common stock and Class A common stock will vote together as a single class on all matters (including the election of directors) submitted to a vote of stockholders, unless otherwise required by Delaware law.
Under Delaware law, holders of our Class A common stock or Class B common stock would be entitled to vote as a separate class if a proposed amendment to our amended and restated certificate of incorporation would increase or decrease the aggregate number of authorized shares of such class, increase or decrease the par value of the shares of such class, or alter or change the powers, preferences, or special rights of the shares of such class
175
Table of Contents
so as to affect them adversely. While the holders of our Class A common stock have waived their right to vote as a separate class as to amendments to our amended and restated certificate of incorporation that would increase or decrease the aggregate number of authorized shares of Class A common stock, they are entitled to the other class protections provided under Delaware law. As a result, in these limited instances, the holders of a majority of the Class A common stock could defeat any amendment to our amended and restated certificate of incorporation. For example, if a proposed amendment of our amended and restated certificate of incorporation provided for the Class A common stock to rank junior to the Class B common stock with respect to (1) any dividend or distribution, (2) the distribution of proceeds were we to be acquired, or (3) any other right, Delaware law would require the vote of the Class A common stock. In this instance, the holders of a majority of Class A common stock could defeat that amendment to our amended and restated certificate of incorporation
Our amended and restated certificate of incorporation that will be in effect on the closing of this offering will not provide for cumulative voting for the election of directors.
Economic Rights
Except as otherwise will be expressly provided in our amended and restated certificate of incorporation that will be in effect on the closing of this offering or required by applicable law, all shares of Class A common stock and Class B common stock will have the same rights and privileges and rank equally, share ratably and be identical in all respects for all matters, including those described below.
Dividends and Distributions. Subject to preferences that may apply to any shares of convertible preferred stock outstanding at the time, the holders of Class A common stock and Class B common stock will be entitled to share equally, identically, and ratably, on a per share basis, with respect to any dividend or distribution of cash or property paid or distributed by the company, unless different treatment of the shares of the affected class is approved by the affirmative vote of the holders of a majority of the outstanding shares of such affected class, voting separately as a class. See the section titled Dividend Policy for additional information.
Liquidation Rights. On our liquidation, dissolution, or winding-up, the holders of Class A common stock and Class B common stock will be entitled to share equally, identically, and ratably in all assets remaining after the payment of any liabilities, liquidation preferences, and accrued or declared but unpaid dividends, if any, with respect to any outstanding convertible preferred stock, unless a different treatment is approved by the affirmative vote of the holders of a majority of the outstanding shares of such affected class, voting separately as a class.
Change of Control Transactions. The holders of Class A common stock and Class B common stock will be treated equally and identically with respect to shares of Class A common stock or Class B common stock owned by them, unless different treatment of the shares of each class is approved by the affirmative vote of the holders of a majority of the outstanding shares of the class treated differently, voting separately as a class, on (a) the closing of the sale, transfer, or other disposition of all or substantially all of our assets, (b) the consummation of a merger, reorganization, consolidation, or share transfer which results in our voting securities outstanding immediately before the transaction (or the voting securities issued with respect to our voting securities outstanding immediately before the transaction) representing less than a majority of the combined voting power of the voting securities of the company or the surviving or acquiring entity, or (c) the closing of the transfer (whether by merger, consolidation, or otherwise), in one transaction or a series of related transactions, to a person or group of affiliated persons of securities of the company if, after closing, the transferee person or group would hold 50% or more of the outstanding voting power of the company (or the surviving or acquiring entity). However, consideration to be paid or received by a holder of common stock in connection with any such assets sale, merger, reorganization, consolidation, or share transfer under any employment, consulting, severance, or other arrangement will be disregarded for the purposes of determining whether holders of common stock are treated equally and identically.
Subdivisions and Combinations. If we subdivide or combine in any manner outstanding shares of Class A common stock or Class B common stock, the outstanding shares of the other classes will be subdivided or combined in the same manner.
176
Table of Contents
No Preemptive or Similar Rights
Our Class A common stock and Class B common stock are not entitled to preemptive rights, and are not subject to conversion, redemption or sinking fund provisions, except for the conversion provisions with respect to the Class B common stock described below.
Conversion
Each share of Class B common stock is convertible at any time at the option of the holder into one share of Class A common stock. On any transfer of shares of Class B common stock, whether or not for value, each such transferred share will automatically convert into one share of Class A common stock, except for certain transfers detailed below and further described in our amended and restated certificate of incorporation that will be in effect on the closing of this offering, so long as the transferring holder continues to hold sole voting and dispositive power with respect to the shares transferred.
Any holders shares of Class B common stock will convert automatically into Class A common stock, on a one-to-one basis, upon certain circumstances, including: (1) the sale or transfer of such share of Class B common stock (except as described above), (2) a date fixed by the board of directors that is no less than 120 days and no more than 180 days following the date that the number of shares of Class B common stock outstanding is less than 20% of the number of shares of Class B common stock outstanding immediately prior to the completion of this offering, or (3) six months after the death or incapacity of Daniel Dines.
Once transferred and converted into Class A common stock, the Class B common may not be reissued.
Permitted Transfers of Class B Common Stock
A transfer by a holder of Class B common stock to any of the persons or entities listed in clauses (A) through (H) below, each a Permitted Transferee, and from any such Permitted Transferee back to such holder of Class B common stock and/or any other Permitted Transferee established by or for such holder of Class B common stock will not trigger an automatic conversion to Class A common stock so long as, in each case, Daniel Dines (or, in the case of clauses (C), (D), (F) or (G) below, Daniel Dines, a Qualified Trustee (as defined below) and/or a Qualified Trust (as defined below)), directly or indirectly, retains sole dispositive and voting power with respect to the shares of Class B common stock transferred: (A) a trust for the benefit of any person; (B) a trust under the terms of which Daniel Dines has retained a qualified interest within the meaning of §2702(b)of the Internal Revenue Code and/or a reversionary interest; (C) a trust for the benefit of one or more of (i) Daniel Dines or one of his family members, (ii) a Permitted Transferee, or a charitable organization, in which the trustee is one or more of (x) Daniel Dines (or his attorney), (y) a professional in the business of providing trustee services, or (z) a director or executive officer of the Company, a private banker at a nationally or internationally recognized financial institution or a legal advisor of Daniel Dines, so long as such person is approved by a majority of the members of the board of directors other than Daniel Dines, any such trustee, a Qualified Trustee; (D) a trust under the terms of which Daniel Dines has the power to revest in himself title to the trust property, if such power is exercisable solely by Daniel Dines without the approval or consent of any other person or with the consent of a related or subordinate party within the meaning of §672(c) of the Internal Revenue Code (a trust satisfying either clause (C) or (D), a Qualified Trust); (E) an Individual Retirement Account, as defined in Section 408(a) of the Internal Revenue Code, or a pension, profit sharing, stock bonus or other type of plan or trust of which Daniel Dines is a participant or beneficiary and which satisfies the requirements for qualification under Section 401 of the Internal Revenue Code; (F) a corporation, partnership or limited liability company in which Daniel Dines, directly or indirectly through one or more Permitted Transferees, owns shares, partnership interests or membership interests, as applicable; (G) a charitable organization organized and operated primarily for religious, scientific, literary, education or a charitable purpose, or a Qualified Charity, provided any such transfer does not involve a disposition for value; and (H) an estate.
177
Table of Contents
Fully Paid and Non-Assessable
In connection with this offering, our legal counsel will opine that the shares of our Class A common stock to be issued under this offering will be fully paid and non-assessable.
Convertible Preferred Stock
As of January 31, 2021, there were 294,257,205 shares of our convertible preferred stock outstanding. In February 2021, we issued 12,043,202 shares of our Series F convertible preferred stock. Immediately prior to the closing of this offering, each outstanding share of our convertible preferred stock will convert into one share of our Class A common stock.
Under our amended and restated certificate of incorporation that will be in effect on the closing of this offering, our board of directors may, without further action by our stockholders (except as noted below), fix the rights, preferences, privileges, and restrictions of up to an aggregate of 20,000,000 shares of convertible preferred stock in one or more series and authorize their issuance. Notwithstanding the foregoing, so long as any shares of Class B common stock remain outstanding, no shares of preferred stock with voting rights equal or superior to those of the Class B common stock may be issued without the approval of the holders of a majority of the outstanding shares of Class B common stock. These rights, preferences, and privileges could include dividend rights, conversion rights, voting rights, terms of redemption, liquidation preferences, and the number of shares constituting any series or the designation of such series, any or all of which may be greater than the rights of our Class A common stock or Class B common stock. Any issuance of our convertible preferred stock could adversely affect the voting power of holders of our Class A common stock or Class B common stock, and the likelihood that such holders would receive dividend payments and payments on liquidation. In addition, the issuance of convertible preferred stock could have the effect of delaying, deferring, or preventing a change of control or other corporate action. On the closing of this offering, no shares of convertible preferred stock will be outstanding. We have no present plan to issue any shares of convertible preferred stock.
Options
As of January 31, 2021, we had outstanding (1) options to purchase 5,175,906 shares of our Class A common stock, with a weighted-average exercise price of approximately $0.07 per share, under the 2015 Plan and (2) options to purchase 17,836,792 shares of our Class A common stock, with a weighted-average exercise price of approximately $2.02 per share, under the 2018 Plan.
Restricted Stock Units (RSUs)
As of January 31, 2021, we had outstanding 34,752,783 RSUs under the 2018 Plan.
Registration Rights
Stockholder Registration Rights
We are party to an investor rights agreement that provides that certain holders of our convertible preferred stock, including certain holders of at least 5% of our capital stock and entities affiliated with certain of our directors, have certain registration rights, as set forth below. This investor rights agreement was entered into in July 2020. The registration of shares of our Class A common stock by the exercise of registration rights described below would enable the holders to sell these shares without restriction under the Securities Act when the applicable registration statement is declared effective. We will pay the registration expenses, other than underwriting discounts and commissions, of the shares registered by the demand, piggyback, and Form S-3 registrations described below.
178
Table of Contents
Generally, in an underwritten offering, the managing underwriter, if any, has the right, subject to specified conditions, to limit the number of shares such holders may include. The demand, piggyback, and Form S-3 registration rights described below will expire five years after the effective date of the registration statement, of which this prospectus forms a part, or with respect to any particular stockholder, such time after the effective date of the registration statement that such stockholder (a) holds less than 1% of our outstanding common stock (including shares issuable on conversion of outstanding convertible preferred stock) and (b) can sell all of its shares under Rule 144 of the Securities Act, or Rule 144, during any 90-day period.
Demand Registration Rights
The holders of an aggregate of 293,297,557 shares of our Class A common stock (after giving effect to sales by selling stockholders in this offering) will be entitled to certain demand registration rights. At any time beginning six months after the effective date of this registration statement, the holders of a majority of these shares may, on not more than two occasions, request that we register all or a portion of their shares. Such request for registration must cover shares with an anticipated aggregate offering price, net of underwriting discounts and commissions, of at least $15 million.
Piggyback Registration Rights
In connection with this offering, the holders of an aggregate of 293,297,557 shares of our Class A common stock (after giving effect to sales by selling stockholders in this offering) were entitled to, and the necessary percentage of holders waived, their rights to notice of this offering and to include their shares of registrable securities in this offering. After this offering, in the event that we propose to, subject to limited exceptions, register any of our securities under the Securities Act, either for our own account or for the account of other security holders, the holders of these shares will be entitled to certain piggyback registration rights allowing the holder to include their shares in such registration, subject to certain marketing and other limitations. As a result, whenever we propose to file a registration statement under the Securities Act, other than with respect to a demand registration or a registration statement on Forms S-4 or S-8, the holders of these shares are entitled to notice of the registration and have the right to include their shares in the registration, subject to limitations that the underwriters may impose on the number of shares included in the offering.
Form S-3 Registration Rights
The holders of an aggregate of at least 20% of the then outstanding shares of Class A common stock (after giving effect to sales by selling stockholders in this offering) will be entitled to certain Form S-3 registration rights. The holders of at least 20% of these shares can make a request that we register their shares on Form S-3 if we are qualified to file a registration statement on Form S-3 and if the reasonably anticipated aggregate gross proceeds of the shares offered would equal or exceed $5 million. We will not be required to effect more than two registrations on Form S-3 within any 12-month period.
Anti-Takeover Provisions
Certificate of Incorporation and Bylaws to Be in Effect on the Closing of this Offering
Because our stockholders do not have cumulative voting rights, stockholders holding a majority of the voting power of our shares of common stock will be able to elect all of our directors. Our amended and restated certificate of incorporation and amended and restated bylaws to be effective on the closing of this offering will provide for stockholder actions at a duly called meeting of stockholders or, so long as any shares of Class B common stock remain outstanding, by written consent. A special meeting of stockholders may be called by a majority of our board of directors, the chair of our board of directors, our chief executive officer, or, so long as any shares of Class B common stock remain outstanding, by our secretary upon written consent of our stockholders entitled to cast at least a majority of the votes at such meeting. Our amended and restated bylaws to
179
Table of Contents
be effective on the closing of this offering will establish an advance notice procedure for stockholder proposals to be brought before an annual meeting of our stockholders, including proposed nominations of persons for election to our board of directors.
Our amended and restated certificate of incorporation to be effective on the closing of this offering will further provide for a dual-class common stock structure, which provides Daniel Dines, our Chief Executive Officer, Co-Founder, and Chairman, who, collectively with his controlled entities, holds 100% of our outstanding Class B common stock, with control over all matters requiring stockholder approval, including the election of directors and significant corporate transactions, such as a merger or other sale of our company or its assets. Additionally, so long as any shares of Class B common stock remain outstanding, a majority vote of the outstanding Class B common stock is required to (1) amend, alter, or repeal any provision of the certificate of incorporation or bylaws in a manner that impacts the rights of the holders of the Class B common stock, (2) reclassify any outstanding shares of Class A common stock into shares having (a) dividend or liquidation rights that are senior to the Class B common stock or (b) the right to more than one vote per share, (3) issue any shares of preferred stock having voting rights equal to superior to those of the Class B common stock, and (4) issue any additional shares of Class B common stock or other securities convertible into Class B common stock (except for the issuance of Class B Common Stock issuable upon a dividend under certain circumstances).
The foregoing provisions will make it more difficult for another party to obtain control of us by replacing our board of directors. Since our board of directors has the power to retain and discharge our officers, these provisions could also make it more difficult for existing stockholders or another party to effect a change in management. In addition, the authorization of undesignated convertible preferred stock makes it possible for our board of directors to issue convertible preferred stock with voting or other rights or preferences that could impede the success of any attempt to change our control.
These provisions, including the dual-class structure of our common stock, are intended to preserve our existing control structure after closing of this offering, facilitate our continued product innovation and the risk-taking that it requires, permit us to continue to prioritize our long-term goals rather than short-term results, enhance the likelihood of continued stability in the composition of our board of directors and its policies and to discourage certain types of transactions that may involve an actual or threatened acquisition of us. These provisions are also designed to reduce our vulnerability to an unsolicited acquisition proposal and to discourage certain tactics that may be used in proxy fights. However, such provisions could have the effect of discouraging others from making tender offers for our shares and may have the effect of deterring hostile takeovers or delaying changes in our control or management. As a consequence, these provisions may also inhibit fluctuations in the market price of our stock that could result from actual or rumored takeover attempts.
Section 203 of the Delaware General Corporation Law
When we have a class of voting stock that is either listed on a national securities exchange or held of record by more than 2,000 stockholders, we will be subject to Section 203 of the Delaware General Corporation Law, which prohibits a Delaware corporation from engaging in any business combination with any interested stockholder for a period of three years after the date that such stockholder became an interested stockholder, subject to certain exceptions.
Choice of Forum
Our amended and restated certificate of incorporation to be effective on the closing of this offering will provide that the Court of Chancery of the State of Delaware be the exclusive forum for actions or proceedings brought under Delaware statutory or common law: (1) any derivative claim or cause of action brought on our behalf; (2) any claim or cause of action asserting a breach of fiduciary duty; (3) any claim or cause of action against us arising under the Delaware General Corporation Law; (4) any claim or cause of action arising under or
180
Table of Contents
seeking to interpret our amended and restated certificate of incorporation or our amended and restated bylaws; or (5) any claim or cause of action against us that is governed by the internal affairs doctrine. The provisions would not apply to suits brought to enforce a duty or liability created by the Exchange Act.
Our amended and restated certificate of incorporation further provides that the federal district courts of the United States of America will be the exclusive forum for resolving any complaint asserting a cause or causes of action arising under the Securities Act, including all causes of action asserted against any defendant to such complaint. For the avoidance of doubt, this provision is intended to benefit and may be enforced by us, our officers and directors, the underwriters to any offering giving rise to such complaint, and any other professional entity whose profession gives authority to a statement made by that person or entity and who has prepared or certified any part of the documents underlying the offering. Investors cannot waive compliance with the federal securities laws and the rules and regulations thereunder.
Limitations of Liability and Indemnification
See the section titled Executive CompensationLimitations of Liability and Indemnification Matters.
Exchange Listing
Our Class A common stock is currently not listed on any securities exchange. We have applied to have our Class A common stock approved for listing on the New York Stock Exchange under the symbol PATH.
Transfer Agent and Registrar
On the closing of this offering, the transfer agent and registrar for our Class A common stock and Class B common stock will be Computershare Trust Company, N.A. The transfer agents address is 150 Royall Street, Canton, Massachusetts 02021.
181
Table of Contents
SHARES ELIGIBLE FOR FUTURE SALE
Prior to this offering, there has been no public market for our Class A common stock. Future sales of substantial amounts of our Class A common stock or Class B common stock, including shares issued on the exercise or settlement of outstanding stock awards, in the public market after this offering, or the possibility of these sales or issuances occurring, could adversely affect the prevailing market price for our Class A common stock or impair our ability to raise equity capital.
Based on our shares outstanding as of January 31, 2021, on the closing of this offering, a total of 436,700,983 shares of Class A common stock will be outstanding, assuming the automatic conversion of all of our outstanding shares of convertible preferred stock into an aggregate of 306,300,407 shares of Class A common stock (after giving effect to the Series F Financing), and a total of 82,452,748 shares of Class B common stock will be outstanding. Of these shares, all of the Class A common stock sold in this offering by us and the selling stockholders, plus any shares sold by us on exercise of the underwriters option to purchase additional Class A common stock, will be freely tradable in the public market without restriction or further registration under the Securities Act, unless these shares are held by affiliates, as that term is defined in Rule 144.
The remaining shares of Class A common stock and Class B common stock will be, and shares of Class A common stock subject to stock options and RSUs will be on issuance, restricted securities, as that term is defined in Rule 144. These restricted securities are eligible for public sale only if they are registered under the Securities Act or if they qualify for an exemption from registration under Rules 144 or 701 under the Securities Act, which are summarized below. Restricted securities may also be sold outside of the United States to non-U.S. persons in accordance with Rule 904 of Regulation S.
Subject to the lock-up agreements described below and the provisions of Rule 144 or Regulation S under the Securities Act, as well as our insider trading policy, these restricted securities will be available for sale in the public market after the date of this prospectus.
As a result of the lock-up agreements and market standoff agreements described below and subject to the provisions of Rules 144 or 701, these restricted securities will be available for sale in the public market as follows:
| Earliest Date Available for Sale in the Public Market | Number of Shares of Class A Common Stock | |
| Immediately prior to the opening of trading on the second full trading day following the release of our regular earnings announcement for our first fiscal quarter following the completion of this offering. |
Up to 88,214,170 shares of Class A common stock. Includes (1) with respect to any selling stockholder that, collectively with its affiliates, indicated an interest in selling at least 1% but less than 5% of such holders and/or its affiliates securities in this offering, 5% of the eligible securities held by such holder and/or its affiliated entities, and (2) with respect to (a) any selling stockholder that, collectively with its affiliates, indicated an interest in selling at least 5% of such holders and/or its affiliates securities in this offering, (b) any of our directors or executive officers, (c) our employees and former employees, and (d) any other equity holder of the company that was neither offered, nor an affiliate of a person that was offered, the right to sell its securities in this offering, 30% of the eligible securities held by such holder and/or its affiliated entities. Excludes securities held by (1) certain stockholders that indicated an interest in selling less than 1% of such holders and/or its affiliates securities in this offering, (2) U.S. holders of RSUs due to holding period restrictions, and (3) affiliates for the purposes of Rule 144, as described below. |
182
Table of Contents
| Earliest Date Available for Sale in the Public Market | Number of Shares of Class A Common Stock | |
| The second full trading day following the release of our regular earnings announcement for our second fiscal quarter following the completion of this offering. |
All remaining shares held by our stockholders not previously eligible for sale, subject to volume limitations applicable to affiliates under Rule 144 as described below, excluding shares underlying RSUs held by U.S. persons due to holding period restrictions. |
Rule 144
In general, under Rule 144 as currently in effect, once we have been subject to public company reporting requirements of Section 13 or Section 15(d) of the Exchange Act for at least 90 days, an eligible stockholder is entitled to sell such shares without complying with the manner of sale, volume limitation, or notice provisions of Rule 144, subject to compliance with the public information requirements of Rule 144. To be an eligible stockholder under Rule 144, such stockholder must not be deemed to have been one of our affiliates for purposes of the Securities Act at any time during the 90 days preceding a sale and must have beneficially owned the shares proposed to be sold for at least six months, including the holding period of any prior owner other than our affiliates. If such a person has beneficially owned the shares proposed to be sold for at least one year, including the holding period of any prior owner other than our affiliates, then such person is entitled to sell such shares without complying with any of the requirements of Rule 144, subject to the expiration of the lock-up agreements described below.
In general, under Rule 144, as currently in effect, our affiliates or persons selling shares on behalf of our affiliates are entitled to sell shares on expiration of the lock-up agreements described below, subject, in the case of restricted securities, to such shares having been beneficially owned for at least six months. Beginning 90 days after the date of this prospectus, within any three-month period, such stockholders may sell a number of shares that does not exceed the greater of:
| | 1% of the number of Class A common stock then outstanding, which will equal approximately 4,367,010 shares immediately after this offering, assuming no exercise of the underwriters option to purchase additional shares of Class A common stock from us; or |
| | the average weekly trading volume of our Class A common stock on the New York Stock Exchange during the four calendar weeks preceding the filing of a notice on Form 144 with respect to such sale. |
Sales under Rule 144 by our affiliates or persons selling shares on behalf of our affiliates are also subject to certain manner of sale provisions and notice requirements and to the availability of current public information about us.
Rule 701
Rule 701 under the Securities Act, or Rule 701, generally allows a stockholder who was issued shares under a written compensatory plan or contract and who is not deemed to have been an affiliate of our company during the immediately preceding 90 days, to sell these shares in reliance on Rule 144, but without being required to comply with the public information, holding period, volume limitation, or notice provisions of Rule 144. Rule 701 also permits affiliates of our company to sell their Rule 701 shares under Rule 144 without complying with the holding period requirements of Rule 144. All holders of Rule 701 shares, however, are required by that rule to wait until 90 days after the date of this prospectus before selling those shares under Rule 701, subject to the expiration of the lock-up agreements described below.
Form S-8 Registration Statements
We intend to file one or more registration statements on Form S-8 under the Securities Act with the SEC to register the offer and sale of shares of our Class A common stock that are issuable under the 2021 Plan, 2018 Plan, 2015 Plan, and ESPP. These registration statements will become effective immediately on filing. Shares covered by these registration statements will then be eligible for sale in the public markets, subject to vesting restrictions, any applicable lock-up agreements described below and Rule 144 limitations applicable to affiliates.
183
Table of Contents
Lock-Up Arrangements
We, all of our directors and executive officers, the selling stockholders, and holders of substantially all of our outstanding common stock and stock awards are subject to lock-up agreements or agreements with market stand-off provisions pursuant to which they have agreed that, without the prior written consent of Morgan Stanley & Co. LLC and J.P. Morgan Securities LLC on behalf of the underwriters, we and they will not, and will not publicly disclose an intention to, during the period ending immediately prior to the opening of trading on the NYSE on the second full trading day following the release of our regular earnings announcement for our second fiscal quarter following the completion of this offering (such period, the restricted period):
| | offer, pledge, sell, contract to sell, sell any option or contract to purchase, purchase any option or contract to sell, grant any option, right or warrant to purchase, lend or otherwise transfer or dispose of, directly or indirectly, any shares of common stock or any securities convertible into or exercisable or exchangeable for shares of common stock; |
| | file any registration statement with the SEC relating to the offering of any shares of common stock or any securities convertible into or exercisable or exchangeable for common stock; or |
| | enter into any swap or other arrangement that transfers to another, in whole or in part, any of the economic consequences of ownership of the common stock, |
whether any such transaction described above is to be settled by delivery of common stock or such other securities, in cash or otherwise.
Notwithstanding the foregoing, immediately prior to the opening of trading on the second full trading day following the release of our regular earnings announcement for our first fiscal quarter following the completion of this offering, such restricted period will terminate (1) with respect to any selling stockholder that, collectively with its affiliates, indicated an interest in selling at least 1% but less than 5% of such holders and/or its affiliates common stock and options to purchase shares of common stock in this offering, 5% of the eligible securities held by such holder and/or its affiliated entities subject to a lock-up agreement or agreement with market stand-off provisions, as the case may be; and (2) with respect to (a) any selling stockholder that, collectively with its affiliates, indicated an interest in selling at least 5% of such holders and/or its affiliates common stock and options to purchase shares of common stock in this offering, (b) any of our directors or executive officers, (c) our employees and former employees, and (d) any other equity holder of the company that was neither offered, nor an affiliate of a person that was offered, the right to sell its securities in this offering, 30% of the eligible securities held by such holder and/or its affiliated entities subject to a lock-up agreement or agreement with market stand-off provisions, as the case may be. In addition, we and each such person have agreed that, without the prior written consent of Morgan Stanley & Co. LLC and J.P. Morgan Securities LLC on behalf of the underwriters, we or such other person will not, during the restricted period, make any demand for, or exercise any right with respect to, the registration of any shares of common stock or any security convertible into or exercisable or exchangeable for common stock.
These agreements described above are subject to a number of exceptions. See the section titled Underwriting for information about these exceptions and a further description of these agreements. Morgan Stanley & Co. LLC and J.P. Morgan Securities LLC may release any of the securities subject to these lock-up agreements at any time, subject to applicable notice requirements.
184
Table of Contents
Registration Rights
Upon the closing of this offering, the holders of 293,297,557 shares of our Class A common stock or their transferees, will be entitled to certain rights with respect to the registration of the offer and sale of their shares under the Securities Act. Registration of these shares under the Securities Act would result in the shares becoming freely tradable without restriction under the Securities Act immediately on the effectiveness of the registration. See the section titled Description of Capital StockRegistration Rights for additional information.
185
Table of Contents
MATERIAL U.S. FEDERAL INCOME TAX CONSEQUENCES TO NON-U.S. HOLDERS OF OUR
CLASS A COMMON STOCK
The following summary describes certain material U.S. federal income tax consequences of the acquisition, ownership, and disposition of our Class A common stock acquired in this offering by Non-U.S. Holders (as defined below). This discussion is not a complete analysis of all potential U.S. federal income tax consequences relating thereto, and does not address foreign, state, and local tax consequences that may be relevant to Non-U.S. Holders in light of their particular circumstances, nor does it address U.S. federal tax consequences (such as gift and estate taxes) other than income taxes. This discussion is limited to Non-U.S. Holders that hold our Class A common stock as a capital asset within the meaning of Section 1221 of the Code (generally, property held for investment). This discussion does not address all U.S. federal income tax consequences relevant to a Non-U.S. Holders particular circumstances, including the impact of the alternative minimum tax, the special tax accounting rules under Section 451(b) of the Code and the Medicare contribution tax on net investment income. Special rules different from those described below may apply to certain Non-U.S. Holders that are subject to special treatment under the Code, such as financial institutions, insurance companies, tax-exempt organizations, broker-dealers, and traders in securities, U.S. expatriates, controlled foreign corporations, passive foreign investment companies, corporations that accumulate earnings to avoid U.S. federal income tax, corporations organized outside of the United States, any state thereof or the District of Columbia that are nonetheless treated as U.S. taxpayers for U.S. federal income tax purposes, persons that hold our Class A common stock as part of a straddle, hedge, conversion transaction, synthetic security, or integrated investment or other risk reduction strategy, persons who acquire our Class A common stock through the exercise of an option or otherwise as compensation, qualified foreign pension funds as defined in Section 897(l)(2) of the Code and entities all of the interests of which are held by qualified foreign pension funds, partnerships, and other pass-through entities or arrangements and investors in such pass-through entities or arrangements. Such Non-U.S. Holders are urged to consult their own tax advisors to determine the U.S. federal, state, local, and other tax consequences that may be relevant to them. Furthermore, the discussion below is based upon the provisions of the Code, and Treasury Regulations, rulings, and judicial decisions thereunder as of the date hereof, and such authorities may be repealed, revoked, or modified, perhaps retroactively, so as to result in U.S. federal income tax consequences different from those discussed below. We have not requested a ruling from the IRS with respect to the statements made and the conclusions reached in the following summary, and there can be no assurance that the IRS will agree with such statements and conclusions.
This discussion is for informational purposes only and is not tax advice. Persons considering the purchase of our Class A common stock pursuant to this offering should consult their own tax advisors concerning the U.S. federal income, estate, and other tax consequences of acquiring, owning, and disposing of our Class A common stock in light of their particular situations as well as any consequences arising under the laws of any other taxing jurisdiction, including any state, local, or foreign tax consequences.
For the purposes of this discussion, a Non-U.S. Holder is, for U.S. federal income tax purposes, a beneficial owner of Class A common stock that is neither a U.S. Holder, nor a partnership (or other entity treated as a partnership for U.S. federal income tax purposes regardless of its place of organization or formation). A U.S. Holder means a beneficial owner of our Class A common stock that is for U.S. federal income tax purposes any of the following:
| | an individual who is a citizen or resident of the United States; |
| | a corporation or other entity treated as a corporation for U.S. federal income tax purposes created or organized in or under the laws of the United States, any state thereof, or the District of Columbia; |
| | an estate the income of which is subject to U.S. federal income taxation regardless of its source; or |
186
Table of Contents
| | a trust if it (1) is subject to the primary supervision of a court within the United States and one or more U.S. persons have the authority to control all substantial decisions of the trust or (2) has a valid election in effect under applicable U.S. Treasury Regulations to be treated as a U.S. person. |
Distributions
Distributions, if any, made on our Class A common stock to a Non-U.S. Holder to the extent made out of our current or accumulated earnings and profits (as determined under U.S. federal income tax principles) generally will constitute dividends for U.S. tax purposes and will be subject to withholding tax at a 30% rate or such lower rate as may be specified by an applicable income tax treaty, subject to the discussions below regarding effectively connected income, backup withholding, and foreign accounts. To obtain a reduced rate of withholding under a treaty, a Non-U.S. Holder generally will be required to provide us with a properly executed IRS Form W-8BEN (in the case of individuals) or IRS Form W-8BEN-E (in the case of entities), or other appropriate form, certifying the Non-U.S. Holders entitlement to benefits under that treaty. This certification must be provided to us and/or our paying agent prior to the payment of dividends and must be updated periodically. In the case of a Non-U.S. Holder that is an entity, Treasury Regulations and the relevant tax treaty provide rules to determine whether, for purposes of determining the applicability of a tax treaty, dividends will be treated as paid to the entity or to those holding an interest in that entity. If a Non-U.S. Holder holds stock through a financial institution or other agent acting on the holders behalf, the holder will be required to provide appropriate documentation to such agent. The holders agent will then be required to provide certification to us and/or our paying agent, either directly or through other intermediaries. If a Non-U.S. Holder is eligible for a reduced rate of U.S. federal withholding tax under an income tax treaty and such Non-U.S. Holder does not timely file the required certification, such Non-U.S. Holder may be able to obtain a refund or credit of any excess amounts withheld by timely filing an appropriate claim for a refund with the IRS.
We generally are not required to withhold tax on dividends paid to a Non-U.S. Holder that are effectively connected with the Non-U.S. Holders conduct of a trade or business within the United States (and, if required by an applicable income tax treaty, are attributable to a permanent establishment or fixed base that such holder maintains in the United States) if a properly executed IRS Form W-8ECI, stating that the dividends are so connected, is furnished to us (or, if stock is held through a financial institution or other agent, to such agent). In general, such effectively connected dividends will be subject to U.S. federal income tax, on a net income basis at the regular rates applicable to U.S. Holders. A corporate Non-U.S. Holder receiving effectively connected dividends may also be subject to an additional branch profits tax, which is imposed, under certain circumstances, at a rate of 30% (or such lower rate as may be specified by an applicable treaty) on the corporate Non-U.S. Holders effectively connected earnings and profits, subject to certain adjustments. Non-U.S. Holders should consult their tax advisors regarding any applicable income tax treaties that may provide for different rules.
To the extent distributions on our Class A common stock, if any, exceed our current and accumulated earnings and profits, they will first reduce the Non-U.S. Holders adjusted basis in our Class A common stock, but not below zero, and then will be treated as gain to the extent of any excess amount distributed, and taxed in the same manner as gain realized from a sale or other disposition of Class A common stock as described in the next section.
Gain on Disposition of Our Class A Common Stock
Subject to the discussions below regarding backup withholding and foreign accounts, a Non-U.S. Holder generally will not be subject to U.S. federal income tax with respect to gain realized on a sale or other taxable disposition of our Class A common stock unless (a) the gain is effectively connected with a trade or business of such holder in the United States (and, if required by an applicable income tax treaty, is attributable to a permanent establishment or fixed base that such holder maintains in the United States), (b) the Non-U.S. Holder is a nonresident alien individual and is present in the United States for 183 or more days in the taxable year of the disposition and certain other conditions are met, or (c) we are or have been a United States real property holding
187
Table of Contents
corporation within the meaning of Code Section 897(c)(2) at any time within the shorter of the five-year period preceding such disposition or such holders holding period in our Class A common stock. In general, we would be a United States real property holding corporation if our interests in U.S. real property comprise (by fair market value) at least half of our worldwide real property interests and our other assets used or held for use in a trade or business. We believe that we are not, and do not anticipate becoming, a United States real property holding corporation. Even if we are treated as a United States real property holding corporation, gain realized by a Non-U.S. Holder on a disposition of our Class A common stock will not be subject to U.S. federal income tax so long as (1) the Non-U.S. Holder owned, directly, indirectly, and constructively, no more than 5% of our Class A common stock at all times within the shorter of (i) the five-year period preceding the disposition or (ii) the holders holding period and (2) our Class A common stock is regularly traded on an established securities market, as defined in applicable Treasury Regulations. There can be no assurance that our Class A common stock will qualify as regularly traded on an established securities market. If a Non-U.S. Holders gain on disposition of our Class A common stock is taxable because we are a United States real property holding corporation and such Non-U.S. Holders ownership of our Class A common stock exceeds 5%, such Non-U.S. Holder will be taxed on such disposition generally in the manner as gain that is effectively connected with the conduct of a U.S. trade or business (subject to the provisions under an applicable income tax treaty), except that the branch profits tax generally will not apply to a corporate Non-U.S. Holder.
Non-U.S. Holders described in (a) above will be required to pay tax on the net gain derived from the sale at regular U.S. federal income tax rates applicable to U.S. Holders, and corporate Non-U.S. Holders described in (a) above may be subject to the additional branch profits tax on such gain at a 30% rate or such lower rate as may be specified by an applicable income tax treaty. Gain described in (b) above will be subject to U.S. federal income tax at a flat 30% rate or such lower rate as may be specified by an applicable income tax treaty, which gain may be offset by certain U.S.-source capital losses (even though a Non-U.S. Holder is not considered a resident of the United States), provided that the Non-U.S. Holder has timely filed U.S. federal income tax returns with respect to such losses.
Information Reporting Requirements and Backup Withholding
Generally, we must report information to the IRS with respect to any dividends we pay on our Class A common stock (even if the payments are exempt from withholding), including the amount of any such dividends, the name and address of the recipient, and the amount, if any, of tax withheld. A similar report is sent to the holder to whom any such dividends are paid. Pursuant to tax treaties or certain other agreements, the IRS may make its reports available to tax authorities in the recipients country of residence.
Dividends paid by us (or our paying agents) to a Non-U.S. Holder may also be subject to U.S. backup withholding. U.S. backup withholding generally will not apply to a Non-U.S. Holder who provides a properly executed IRS Form W-8BEN, IRS Form W-8BEN-E, or IRS Form W-ECI, or otherwise establishes an exemption. Notwithstanding the foregoing, backup withholding may apply if the payor has actual knowledge, or reason to know, that the holder is a U.S. person who is not an exempt recipient.
U.S. information reporting and backup withholding requirements generally will apply to the proceeds of a disposition of our Class A common stock effected by or through a U.S. office of any broker, U.S. or foreign, except that information reporting and such requirements may be avoided if the holder provides a properly executed IRS Form W-8BEN or IRS Form W-8BEN-E or otherwise meets documentary evidence requirements for establishing non-U.S. person status or otherwise establishes an exemption. Generally, U.S. information reporting and backup withholding requirements will not apply to a payment of disposition proceeds to a Non-U.S. Holder where the transaction is effected outside the United States through a non-U.S. office of a non-U.S. broker. Information reporting and backup withholding requirements may, however, apply to a payment of disposition proceeds if the broker has actual knowledge, or reason to know, that the holder is, in fact, a U.S. person. For information reporting purposes, certain brokers with substantial U.S. ownership or operations will generally be treated in a manner similar to U.S. brokers.
188
Table of Contents
Backup withholding is not an additional tax. Any amounts withheld under the backup withholding rules may be credited against the tax liability of persons subject to backup withholding, provided that the required information is timely furnished to the IRS.
Foreign Accounts
Sections 1471 through 1474 of the Code (commonly referred to as FATCA) impose a U.S. federal withholding tax of 30% on certain payments to a foreign financial institution (as specifically defined by applicable rules) unless such institution enters into an agreement with the U.S. government to withhold on certain payments and to collect and provide to the U.S. tax authorities substantial information regarding U.S. account holders of such institution (which includes certain equity holders of such institution, as well as certain account holders that are foreign entities with U.S. owners). FATCA also generally imposes a federal withholding tax of 30% on certain payments to a non-financial foreign entity unless such entity provides the withholding agent with either a certification that it does not have any substantial direct or indirect U.S. owners or provides information regarding substantial direct and indirect U.S. owners of the entity. An intergovernmental agreement between the United States and an applicable foreign country may modify those requirements. The withholding tax described above will not apply if the foreign financial institution or non-financial foreign entity otherwise qualifies for an exemption from the rules.
FATCA withholding currently applies to payments of dividends, if any, on our Class A common stock and, subject to the proposed Treasury Regulations described in this paragraph, generally also would apply to payments of gross proceeds from the sale or other disposition of our Class A common stock. The U.S. Treasury Department released proposed regulations which, if finalized in their present form, would eliminate the federal withholding tax of 30% applicable to the gross proceeds of a disposition of our Class A common stock. In its preamble to such proposed regulations, the U.S. Treasury Department stated that taxpayers may generally rely on the proposed regulations until final regulations are issued. Non-U.S. holders are encouraged to consult with their own tax advisors regarding the possible implications of FATCA on their investment in our Class A common stock.
EACH PROSPECTIVE INVESTOR SHOULD CONSULT ITS OWN TAX ADVISOR REGARDING THE TAX CONSEQUENCES OF PURCHASING, HOLDING, AND DISPOSING OF OUR CLASS A COMMON STOCK, INCLUDING THE CONSEQUENCES OF ANY RECENT OR PROPOSED CHANGE IN APPLICABLE LAW FROM ALL FEDERAL, STATE, ESTATE, AND GIFT TAX PERSPECTIVES.
189
Table of Contents
Under the terms and subject to the conditions in an underwriting agreement dated the date of this prospectus, the underwriters named below, for whom Morgan Stanley & Co. LLC and J.P. Morgan Securities LLC are acting as representatives, have severally agreed to purchase, and we and the selling stockholders have agreed to sell to them, severally, the number of shares indicated below:
| Underwriter |
Number of Shares To Be Purchased | |||||
| Morgan Stanley & Co. LLC |
||||||
| J.P. Morgan Securities LLC |
||||||
| BofA Securities, Inc. |
||||||
| Credit Suisse Securities (USA) LLC |
||||||
| Barclays Capital Inc. |
||||||
| Wells Fargo Securities, LLC. |
||||||
| SMBC Nikko Securities America, Inc. |
||||||
| BMO Capital Markets Corp. |
||||||
| Mizuho Securities USA LLC |
||||||
| KeyBanc Capital Markets Inc. |
||||||
| TD Securities (USA) LLC. |
||||||
| Truist Securities, Inc. |
||||||
| Cowen and Company, LLC. |
||||||
| Evercore Group L.L.C. |
||||||
| Macquarie Capital (USA) Inc. |
||||||
| Nomura Securities International, Inc. |
||||||
| RBC Capital Markets, LLC |
||||||
| Canaccord Genuity LLC. |
||||||
| D. A. Davidson & Co. |
||||||
| Oppenheimer & Co. Inc. |
||||||
| Needham & Company, LLC |
||||||
|
|
||||||
| Total: |
23,890,777 | |||||
|
|
||||||
The underwriters and the representatives are collectively referred to as the underwriters and the representatives, respectively. The underwriters are offering the shares of Class A common stock subject to their acceptance of the shares from us and subject to prior sale. The underwriting agreement provides that the obligations of the several underwriters to pay for and accept delivery of the shares of Class A common stock offered by this prospectus are subject to the approval of certain legal matters by their counsel and to certain other conditions. The underwriters are obligated to take and pay for all of the shares of Class A common stock offered by this prospectus if any such shares are taken. However, the underwriters are not required to take or pay for the shares covered by the underwriters over-allotment option described below.
The underwriters initially propose to offer part of the shares of Class A common stock directly to the public at the offering price listed on the cover page of this prospectus and part to certain dealers. After the initial offering of the shares of Class A common stock, the offering price and other selling terms may from time to time be varied by the representatives.
We have granted to the underwriters an option, exercisable for 30 days from the date of this prospectus, to purchase up to additional shares of Class A common stock at the public offering price listed on the cover page of this prospectus, less underwriting discounts and commissions. The underwriters may exercise this option solely for the purpose of covering over-allotments, if any, made in connection with the offering of the shares of Class A common stock offered by this prospectus. To the extent the option is exercised, each underwriter will become obligated, subject to certain conditions, to purchase about the same percentage of the additional shares of Class A common stock as the number listed next to the underwriters name in the preceding table bears to the total number of shares of Class A common stock listed next to the names of all underwriters in the preceding table.
190
Table of Contents
At our request, Morgan Stanley & Co. LLC, or the DSP Underwriter, has reserved up to 2.0% of the shares of Class A common stock offered by this prospectus for sale at the initial public offering price to certain individuals identified by our officers and directors who express an interest in purchasing Class A common stock in this offering. The sales will be made at our direction by the DSP Underwriter and its affiliates through a directed share program. The number of shares available for sale to the general public in this offering will be reduced to the extent that such participants purchase the reserved shares. Any reserved shares not so purchased will be offered by the underwriters to the general public on the same terms as the other shares offered by this prospectus. We have agreed to indemnify the DSP Underwriter and its affiliates against certain liabilities and expenses, including liabilities under the Securities Act, in connection with the sale of the shares reserved for the directed share program.
The following table shows the per share and total public offering price, underwriting discounts and commissions, and proceeds before expenses to us and the selling stockholders. These amounts are shown assuming both no exercise and full exercise of the underwriters option to purchase up to an additional 3,583,616 shares of Class A common stock.
| Total | ||||||
| Per Share | No Exercise | Full Exercise | ||||
| Public offering price |
$ | $ | $ | |||
| Underwriting discounts and commissions to be paid by: |
||||||
| Us |
$ | $ | $ | |||
| The selling stockholders |
$ | $ | $ | |||
| Proceeds, before expenses, to us |
$ | $ | $ | |||
| Proceeds, before expenses, to selling stockholders |
$ | $ | $ | |||
The estimated offering expenses payable by us, exclusive of the underwriting discounts and commissions, are approximately $7.0 million. We have agreed to reimburse the underwriters for expense relating to clearance of this offering with the Financial Industry Regulatory Authority up to $40,000. The underwriters have agreed to reimburse us for certain expenses incurred in connection with this offering upon closing of this offering.
The underwriters have informed us that they do not intend sales to discretionary accounts to exceed 5% of the total number of shares of Class A common stock offered by them.
We have applied to have our Class A common stock approved for listing on the New York Stock Exchange under the symbol PATH.
We, all of our directors and executive officers, the selling stockholders, and holders of substantially all of our outstanding common stock and stock awards are subject to lock-up agreements or agreements with market stand-off provisions pursuant to which they have agreed that, without the prior written consent of Morgan Stanley & Co. LLC and J.P. Morgan Securities LLC on behalf of the underwriters, we and they will not, and will not publicly disclose an intention to, during the period ending immediately prior to the opening of trading on the NYSE on the second full trading day following the release of our regular earnings announcement for our second fiscal quarter following the completion of this offering (such period, the restricted period):
| | offer, pledge, sell, contract to sell, sell any option or contract to purchase, purchase any option or contract to sell, grant any option, right or warrant to purchase, lend or otherwise transfer or dispose of, directly or indirectly, any shares of common stock or any securities convertible into or exercisable or exchangeable for shares of common stock; |
| | file any registration statement with the SEC relating to the offering of any shares of common stock or any securities convertible into or exercisable or exchangeable for common stock; or |
191
Table of Contents
| | enter into any swap or other arrangement that transfers to another, in whole or in part, any of the economic consequences of ownership of the common stock |
whether any such transaction described above is to be settled by delivery of common stock or such other securities, in cash or otherwise.
Notwithstanding the foregoing, immediately prior to the opening of trading on the second full trading day following the release of our regular earnings announcement for our first fiscal quarter following the completion of this offering, such restricted period will terminate (1) with respect to any selling stockholder that, collectively with its affiliates, indicated an interest in selling at least 1% but less than 5% of such holders and/or its affiliates common stock and options to purchase shares of common stock in this offering, 5% of the eligible securities held by such holder and/or its affiliated entities subject to a lock-up agreement or agreement with market stand-off provisions, as the case may be; and (2) with respect to (a) any selling stockholder that, collectively with its affiliates, indicated an interest in selling at least 5% of such holders and/or its affiliates common stock and options to purchase shares of common stock in this offering, (b) any of our directors or executive officers, (c) our employees and former employees, and (d) any other equity holder of the company that was neither offered, nor an affiliate of a person that was offered, the right to sell its securities in this offering, 30% of the eligible securities held by such holder and/or its affiliated entities subject to a lock-up agreement or agreement with market stand-off provisions, as the case may be. In addition, we and each such person have agreed that, without the prior written consent of Morgan Stanley & Co. LLC and J.P. Morgan Securities LLC on behalf of the underwriters, we or such other person will not, during the restricted period, make any demand for, or exercise any right with respect to, the registration of any shares of common stock or any security convertible into or exercisable or exchangeable for common stock.
The restrictions described in the immediately preceding paragraph are subject to specified exceptions, including the following:
(A) transactions relating to shares of common stock acquired in this offering or in open market transactions after the completion of this offering, provided that no filing under the Exchange Act reporting a reduction in beneficial ownership of shares would be required or voluntarily made;
(B) transfers of shares of common stock or any security convertible into or exercisable or exchangeable for common stock (1) as a bona fide gift, (2) to an immediate family member or to any trust for the direct or indirect benefit of the lock-up party or an immediate family member of the lock-up party, (3) to any entity controlled or managed, or under common control or management by, the lock-up party, or (4) by will, other testamentary document or intestate succession to the legal representative, heir, beneficiary or an immediate family member of the lock-up party;
(C) transfers or distributions of shares of common stock or any security convertible into or exercisable or exchangeable for common stock by a lock-up party that is a corporation, partnership, limited liability company, trust or other business entity (1) to current or former general or limited partners, managers, members, stockholders or holders of similar equity interests in the lock-up party or (2) to the estates of any of the foregoing;
(D) the transfer of shares of common stock or any securities convertible into or exercisable or exchangeable for common stock to satisfy any tax, including estimated tax, remittance, or other payment obligations of the lock-up party arising in connection with a vesting event of our securities, upon the settlement of restricted stock units or the payment due for the exercise of options (including a transfer to the Company for the net or cashless exercise of options) or other rights to purchase securities of the Company, in all such cases pursuant to equity awards granted under a stock incentive plan or other equity award plan described in this prospectus; provided, that any remaining shares of common stock received upon such vesting, settlement, or exercise shall be subject to the lock-up agreement;
192
Table of Contents
(E) sales of shares of Class A common stock pursuant to the terms of the Underwriting Agreement;
(F) the establishment of a trading plan pursuant to Rule 10b5-1 under the Exchange Act for the transfer of shares of common stock, provided that such plan does not provide for the transfer of common stock during the restricted period (other than any shares that are no longer subject to the restrictions under the lock-up agreement due to the early lock-up expiration as provided above);
(G) the transfer of shares of common stock or any security convertible into or exercisable or exchangeable for common stock that occurs by operation of law pursuant to a qualified domestic order or in connection with a divorce settlement or other court order;
(H) the conversion of shares of our convertible preferred stock or Class B common stock into shares of Class A common stock in connection with this offering, provided that, in each case, such shares remain subject to the terms of the lock-up agreement; or
(I) the transfer of shares of common stock or any security convertible into or exercisable or exchangeable for common stock pursuant to a bona fide third-party tender offer, merger, consolidation or other similar transaction that is approved by our board of directors, made to all holders of common stock involving a change of control, provided that, in the event that the tender offer, merger, consolidation or other such transaction is not completed, the common stock owned by the lock-up party will remain subject to terms of the lock-up agreement,
provided that:
| | in the case of any transfer or distribution pursuant to clauses (B), (C) and (G) above, each donee, trustee, distributee or transferee shall sign and deliver a lock-up agreement, |
| | in the case of any transfer or distribution pursuant to clauses (B) and (C) above, (1) no filing under the Exchange Act reporting a reduction in beneficial ownership of shares of common stock would be required or be voluntarily made and (2) such transfer or distribution would not involve a disposition for value, and |
| | in the case of any transfer or distribution pursuant to clauses (D) and (F) through (H) above, any filing required by Section 16 of the Exchange Act shall clearly indicate in the footnotes thereto that the such transfer or distribution is being made pursuant to the circumstances described in the applicable clause. |
Morgan Stanley & Co. LLC and J.P. Morgan Securities LLC, in their sole discretion, may release the common stock and other securities subject to the lock-up agreements described above in whole or in part at any time.
In order to facilitate the offering of the Class A common stock, the underwriters may engage in transactions that stabilize, maintain or otherwise affect the price of the Class A common stock. Specifically, the underwriters may sell more shares than they are obligated to purchase under the underwriting agreement, creating a short position. A short sale is covered if the short position is no greater than the number of shares available for purchase by the underwriters under the over-allotment option. The underwriters can close out a covered short sale by exercising the over-allotment option or purchasing shares in the open market. In determining the source of shares to close out a covered short sale, the underwriters will consider, among other things, the open market price of shares compared to the price available under the over-allotment option. The underwriters may also sell shares in excess of the over-allotment option, creating a naked short position. The underwriters must close out any naked short position by purchasing shares in the open market. A naked short position is more likely to be created if the underwriters are concerned that there may be downward pressure on the price of the Class A common stock in the open market after pricing that could adversely affect investors who purchase in this offering. As an additional means of facilitating this offering, the underwriters may bid for, and purchase, shares of Class A common stock in the open market to stabilize the price of the Class A common stock. These activities may raise or maintain the market price of the Class A common stock above independent market levels or prevent or retard a decline in the market price of the Class A common stock. The underwriters are not required to engage in these activities and may end any of these activities at any time.
193
Table of Contents
The underwriters may offer and sell the Class A common stock through certain of their affiliates or other registered broker-dealers or selling agents.
We, the selling stockholders and the underwriters have agreed to indemnify each other against certain liabilities, including liabilities under the Securities Act.
A prospectus in electronic format may be made available on websites maintained by one or more underwriters, or selling group members, if any, participating in this offering. The representatives may agree to allocate a number of shares of Class A common stock to underwriters for sale to their online brokerage account holders. Internet distributions will be allocated by the representatives to underwriters that may make Internet distributions on the same basis as other allocations.
The underwriters and their respective affiliates are full service financial institutions engaged in various activities, which may include securities trading, commercial, and investment banking, financial advisory, investment management, investment research, principal investment, hedging, financing, and brokerage activities. Certain of the underwriters and their respective affiliates have, from time to time, performed, and may in the future perform, various financial advisory and investment banking services for us, for which they received or will receive customary fees and expenses. Certain of the underwriters and their respective affiliates have in the past been, are currently, and may in the future be, customers in arms length transactions.
In addition, in the ordinary course of their various business activities, the underwriters and their respective affiliates may make or hold a broad array of investments and actively trade debt and equity securities (or related derivative securities) and financial instruments (including bank loans) for their own account and for the accounts of their customers and may at any time hold long and short positions in such securities and instruments. Such investment and securities activities may involve our securities and instruments. The underwriters and their respective affiliates may also make investment recommendations or publish or express independent research views in respect of such securities or instruments and may at any time hold, or recommend to clients that they acquire, long or short positions in such securities and instruments.
Pricing of the Offering
Prior to this offering, there has been no public market for our Class A common stock. The initial public offering price was determined by negotiations between us and the representatives. Among the factors considered in determining the initial public offering price were our future prospects and those of our industry in general, our sales, earnings and certain other financial and operating information in recent periods, and the price-earnings ratios, price-sales ratios, market prices of securities, and certain financial and operating information of companies engaged in activities similar to ours.
Selling Restrictions
European Economic Area
In relation to each Member State of the European Economic Area, each a Member State, no securities have been offered or will be offered pursuant to the offering to the public in that Member State prior to the publication of a prospectus in relation to the securities which has been approved by the competent authority in that Member State or, where appropriate, approved in another Member State and notified to the competent authority in that Member State, all in accordance with the Prospectus Regulation, except that offers of securities may be made to the public in that Member State at any time under the following exemptions under the Prospectus Regulation:
| (a) | to any legal entity which is a qualified investor as defined in the Prospectus Regulation; |
(b) to fewer than 150 natural or legal persons (other than qualified investors as defined in the Prospectus Regulation), subject to obtaining the prior consent of the representatives; or
| (c) | in any other circumstances falling within Article 1(4) of the Prospectus Regulation, |
194
Table of Contents
provided that no such offer of shares shall require us or any of our representatives to publish a prospectus pursuant to Article 3 of the Prospectus Regulation or supplement a prospectus pursuant to Article 23 of the Prospectus Regulation and each person who initially acquires any shares or to whom any offer is made will be deemed to have represented, acknowledged and agreed to and with each of the representatives and us that it is a qualified investor as defined in the Prospectus Regulation.
In the case of any shares being offered to a financial intermediary as that term is used in Article 5 of the Prospectus Regulation, each such financial intermediary will be deemed to have represented, acknowledged, and agreed that the shares acquired by it in the offer have not been acquired on a nondiscretionary basis on behalf of, nor have they been acquired with a view to their offer or resale to, persons in circumstances which may give rise to an offer of any shares to the public other than their offer or resale in a Member State to qualified investors as so defined or in circumstances in which the prior consent of the representatives has been obtained to each such proposed offer or resale.
For the purposes of this provision, the expression an offer of shares to the public in relation to any shares in any Member State means the communication in any form and by means of sufficient information on the terms of the offer and the shares to be offered so as to enable an investor to decide to purchase shares, the expression Prospectus Regulation means Regulation (EU) 2017/1129 (as amended).
United Kingdom
In relation to the United Kingdom, no securities have been offered or will be offered pursuant to this offering to the public in the United Kingdom prior to the publication of a prospectus in relation to the securities that either (i) has been approved by the Financial Conduct Authority, or (ii) is to be treated as if it had been approved by the Financial Conduct Authority in accordance with the transitional provision in Regulation 74 of the Prospectus (Amendment etc.) (EU Exit) Regulations 2019, except that offers of securities may be made to the public in the United Kingdom at any time under the following exemptions under the UK Prospectus Regulation:
(a) to any legal entity which is a qualified investor as defined in Article 2 of the UK Prospectus Regulation;
(b) to fewer than 150 natural or legal persons (other than qualified investors as defined in Article 2 of the UK Prospectus Regulation), subject to obtaining the prior consent of the Representative for any such offer; or
(c) in any other circumstances falling within section 86 of the Financial Services and Markets Act 2000, as amended, or the FSMA,
provided that no such offer of shares shall require the issuer or any underwriter to publish a prospectus pursuant to section 85 of the FSMA or supplement a prospectus pursuant to Article 23 of the UK Prospectus Regulation.
For the purposes of this provision, the expression an offer of shares to the public in relation to any shares in the United Kingdom means the communication in any form and by any means of sufficient information on the terms of the offer and any shares to be offered so as to enable an investor to decide to purchase or subscribe for any shares, and the expression UK Prospectus Regulation means Regulation (EU) 2017/1129 as it forms part of domestic law by virtue of the European Union (Withdrawal) Act 2018.
Each underwriter has represented and agreed that:
(a) it has only communicated or caused to be communicated and will only communicate or cause to be communicated an invitation or inducement to engage in investment activity (within the meaning of Section 21 of the Financial Services and Markets Act 2000, or FSMA, received by it in connection with the issue or sale of the shares of our Class A common stock in circumstances in which Section 21(1) of the FSMA does not apply to us; and
195
Table of Contents
(b) it has complied and will comply with all applicable provisions of the FSMA with respect to anything done by it in relation to the shares of our Class A common stock in, from or otherwise involving the United Kingdom.
Canada
The shares of Class A common stock may be sold only to purchasers purchasing, or deemed to be purchasing, as principal that are accredited investors, as defined in National Instrument 45-106 Prospectus Exemptions or subsection 73.3(1) of the Securities Act (Ontario), and are permitted clients, as defined in National Instrument 31-103 Registration Requirements, Exemptions and Ongoing Registrant Obligations. Any resale of the shares of Class A common stock must be made in accordance with an exemption from, or in a transaction not subject to, the prospectus requirements of applicable securities laws.
Securities legislation in certain provinces or territories of Canada may provide a purchaser with remedies for rescission or damages if this prospectus (including any amendment thereto) contains a misrepresentation, provided that the remedies for rescission or damages are exercised by the purchaser within the time limit prescribed by the securities legislation of the purchasers province or territory. The purchaser should refer to any applicable provisions of the securities legislation of the purchasers province or territory for particulars of these rights or consult with a legal advisor.
Pursuant to section 3A.3 (or, in the case of securities issued or guaranteed by the government of a non-Canadian jurisdiction, section 3A.4) of National Instrument 33-105 Underwriting Conflicts (NI 33-105), the underwriters are not required to comply with the disclosure requirements of NI 33-105 regarding underwriter conflicts of interest in connection with this offering.
Japan
No registration pursuant to Article 4, paragraph 1 of the Financial Instruments and Exchange Law of Japan (Law No. 25 of 1948, as amended), or the FIEL, has been made or will be made with respect to the solicitation of the application for the acquisition of the shares of Class A common stock.
Accordingly, the shares of Class A common stock have not been, directly or indirectly, offered or sold and will not be, directly or indirectly, offered or sold in Japan or to, or for the benefit of, any resident of Japan (which term as used herein means any person resident in Japan, including any corporation or other entity organized under the laws of Japan) or to others for re-offering or re-sale, directly or indirectly, in Japan or to, or for the benefit of, any resident of Japan except pursuant to an exemption from the registration requirements, and otherwise in compliance with, the FIEL and the other applicable laws and regulations of Japan.
For Qualified Institutional Investors (QII)
Please note that the solicitation for newly-issued or secondary securities (each as described in Paragraph 2, Article 4 of the FIEL) in relation to the shares of Class A common stock constitutes either a QII only private placement or a QII only secondary distribution (each as described in Paragraph 1, Article 23-13 of the FIEL). Disclosure regarding any such solicitation, as is otherwise prescribed in Paragraph 1, Article 4 of the FIEL, has not been made in relation to the shares of Class A common stock. The shares of Class A common stock may only be transferred to QIIs.
For Non-QII Investors
Please note that the solicitation for newly-issued or secondary securities (each as described in Paragraph 2, Article 4 of the FIEL) in relation to the shares of Class A common stock constitutes either a small number private placement or a small number private secondary distribution (each as is described in Paragraph 4, Article 23-13 of the FIEL). Disclosure regarding any such solicitation, as is otherwise prescribed in Paragraph 1, Article 4 of the FIEL, has not been made in relation to the shares of Class A common stock. The shares of Class A common stock may only be transferred en bloc without subdivision to a single investor.
196
Table of Contents
Hong Kong
Shares of our Class A common stock may not be offered or sold in Hong Kong by means of any document other than (i) in circumstances which do not constitute an offer to the public within the meaning of the Companies (Winding Up and Miscellaneous Provisions) Ordinance (Cap. 32 of the Laws of Hong Kong) (Companies (Winding Up and Miscellaneous Provisions) Ordinance) or which do not constitute an invitation to the public within the meaning of the Securities and Futures Ordinance (Cap. 571 of the Laws of Hong Kong) (Securities and Futures Ordinance), or (ii) to professional investors as defined in the Securities and Futures Ordinance and any rules made thereunder, or (iii) in other circumstances which do not result in the document being a prospectus as defined in the Companies (Winding Up and Miscellaneous Provisions) Ordinance, and no advertisement, invitation or document relating to shares of our Class A common stock may be issued or may be in the possession of any person for the purpose of issue (in each case whether in Hong Kong or elsewhere), which is directed at, or the contents of which are likely to be accessed or read by, the public in Hong Kong (except if permitted to do so under the securities laws of Hong Kong) other than with respect to shares of our Class A common stock which are or are intended to be disposed of only to persons outside Hong Kong or only to professional investors in Hong Kong as defined in the Securities and Futures Ordinance and any rules made thereunder.
Singapore
This prospectus has not been registered as a prospectus with the Monetary Authority of Singapore. Accordingly, this prospectus and any other document or material in connection with the offer or sale, or invitation for subscription or purchase, of shares of our Class A common stock may not be circulated or distributed, nor may the shares of our Class A common stock be offered or sold, or be made the subject of an invitation for subscription or purchase, whether directly or indirectly, to persons in Singapore other than (i) to an institutional investor (as defined under Section 4A of the Securities and Futures Act, Chapter 289 of Singapore (the SFA)) under Section 274 of the SFA, (ii) to a relevant person (as defined in Section 275(2) of the SFA) pursuant to Section 275(1) of the SFA, or any person pursuant to Section 275(1A) of the SFA, and in accordance with the conditions specified in Section 275 of the SFA or (iii) otherwise pursuant to, and in accordance with the conditions of, any other applicable provision of the SFA, in each case subject to conditions set forth in the SFA.
Where shares of our Class A common stock are subscribed or purchased under Section 275 of the SFA by a relevant person which is a corporation (which is not an accredited investor (as defined in Section 4A of the SFA)) the sole business of which is to hold investments and the entire share capital of which is owned by one or more individuals, each of whom is an accredited investor, the securities (as defined in Section 239(1) of the SFA) of that corporation shall not be transferable for six months after that corporation has acquired shares of our Class A common stock under Section 275 of the SFA except: (1) to an institutional investor under Section 274 of the SFA or to a relevant person (as defined in Section 275(2) of the SFA), (2) where such transfer arises from an offer in that corporations securities pursuant to Section 275(1A) of the SFA, (3) where no consideration is or will be given for the transfer, (4) where the transfer is by operation of law, (5) as specified in Section 276(7) of the SFA, or (6) as specified in Regulation 32 of the Securities and Futures (Offers of Investments) (Shares and Debentures) Regulations 2005 of Singapore (Regulation 32).
Where shares of our Class A common stock are subscribed or purchased under Section 275 of the SFA by a relevant person which is a trust (where the trustee is not an accredited investor (as defined in Section 4A of the SFA)) whose sole purpose is to hold investments and each beneficiary of the trust is an accredited investor, the beneficiaries rights and interest (howsoever described) in that trust shall not be transferable for 6 months after that trust has acquired shares of our Class A common stock under Section 275 of the SFA except: (1) to an institutional investor under Section 274 of the SFA or to a relevant person (as defined in Section 275(2) of the SFA), (2) where such transfer arises from an offer that is made on terms that such rights or interest are acquired at a consideration of not less than S$200,000 (or its equivalent in a foreign currency) for each transaction (whether such amount is to be paid for in cash or by exchange of securities or other assets), (3) where no
197
Table of Contents
consideration is or will be given for the transfer, (4) where the transfer is by operation of law, (5) as specified in Section 276(7) of the SFA, or (6) as specified in Regulation 32.
Solely for purposes of the notification requirements under Section 309B(1)(c) of the Securities and Futures Act, Chapter 289 of Singapore, the shares of our Class A common stock are prescribed capital markets products (as defined in the Securities and Futures (Capital Markets Products) Regulations 2018) and Excluded Investment Products (as defined in MAS Notice SFA 04-N12: Notice on the Sale of Investment Products and MAS Notice FAA-N16: Notice on Recommendations on Investment Products).
198
Table of Contents
The validity of the shares of Class A common stock being offered by this prospectus will be passed upon for us by Cooley LLP, New York, New York. Certain legal matters in connection with this offering will be passed upon for the underwriters by Davis Polk & Wardwell LLP, New York, New York.
The audited financial statements included in this prospectus and elsewhere in the registration statement have been so included in reliance upon the report of Grant Thornton LLP, independent registered public accountants, upon the authority of said firm as experts in accounting and auditing.
WHERE YOU CAN FIND ADDITIONAL INFORMATION
We have filed with the SEC a registration statement on Form S-1 under the Securities Act with respect to the shares of Class A common stock offered by this prospectus. This prospectus, which constitutes a part of the registration statement, does not contain all the information set forth in the registration statement, some of which is contained in exhibits to the registration statement as permitted by the rules and regulations of the SEC. For further information with respect to us and our Class A common stock, we refer you to the registration statement, including the exhibits filed as a part of the registration statement. Statements contained in this prospectus concerning the contents of any contract or any other document are not necessarily complete. If a contract or document has been filed as an exhibit to the registration statement, please see the copy of the contract or document that has been filed. Each statement in this prospectus relating to a contract or document filed as an exhibit is qualified in all respects by the filed exhibit. The SEC maintains an internet website that contains reports and other information about issuers, like us, that file electronically with the SEC. The address of that website is www.sec.gov.
On the closing of this offering, we will be subject to the information reporting requirements of the Exchange Act, and we will file reports, proxy statements, and other information with the SEC. These reports, proxy statements, and other information will be available at www.sec.gov.
We also maintain a website at www.uipath.com. Information contained in, or accessible through, our website is not a part of this prospectus, and the inclusion of our website address in this prospectus is only as an inactive textual reference.
199
Table of Contents
Table of Contents
REPORT OF INDEPENDENT REGISTERED PUBLIC ACCOUNTING FIRM
Board of Directors and Stockholders
UiPath, Inc.
Opinion on the financial statements
We have audited the accompanying consolidated balance sheets of UiPath, Inc. (a Delaware corporation) and subsidiaries (the Company) as of January 31, 2021 and 2020, the related consolidated statements of operations, comprehensive loss, convertible preferred stock and stockholders deficit, and cash flows for each of the two years in the period ended January 31, 2021, and the related notes (collectively referred to as the financial statements). In our opinion, the financial statements present fairly, in all material respects, the financial position of the Company as of January 31, 2021 and 2020, and the results of its operations and its cash flows for each of the two years in the period ended January 31, 2021, in conformity with accounting principles generally accepted in the United States of America.
Basis for opinion
These financial statements are the responsibility of the Companys management. Our responsibility is to express an opinion on the Companys financial statements based on our audits. We are a public accounting firm registered with the Public Company Accounting Oversight Board (United States) (PCAOB) and are required to be independent with respect to the Company in accordance with U.S. federal securities laws and the applicable rules and regulations of the Securities and Exchange Commission and the PCAOB.
We conducted our audits in accordance with the standards of the PCAOB. Those standards require that we plan and perform the audit to obtain reasonable assurance about whether the financial statements are free of material misstatement, whether due to error or fraud. The Company is not required to have, nor were we engaged to perform, an audit of its internal control over financial reporting. As part of our audits we are required to obtain an understanding of internal control over financial reporting but not for the purpose of expressing an opinion on the effectiveness of the Companys internal control over financial reporting. Accordingly, we express no such opinion.
Our audits included performing procedures to assess the risks of material misstatement of the financial statements, whether due to error or fraud, and performing procedures that respond to those risks. Such procedures included examining, on a test basis, evidence regarding the amounts and disclosures in the financial statements. Our audits also included evaluating the accounting principles used and significant estimates made by management, as well as evaluating the overall presentation of the financial statements. We believe that our audits provide a reasonable basis for our opinion.
/s/ GRANT THORNTON LLP
We have served as the Companys auditor since 2018.
New York, New York
March 25, 2021
F-2
Table of Contents
Consolidated Balance Sheets
January 31, 2020 and 2021
All amounts in USD thousands except share and per share data
| As of January 31, | ||||||||
| 2020 | 2021 | |||||||
| ASSETS |
||||||||
| Current assets: |
||||||||
| Cash and cash equivalents |
$ | 232,386 | $ | 357,690 | ||||
| Restricted cash, current |
1,745 | 7,000 | ||||||
| Marketable securities |
| 102,828 | ||||||
| Accounts receivable, net |
93,008 | 172,286 | ||||||
| Contract assets, current |
12,855 | 34,221 | ||||||
| Deferred contract acquisition costs, current |
19,361 | 10,653 | ||||||
| Prepaid expenses and other current assets |
41,625 | 49,752 | ||||||
|
|
|
|
|
|||||
| Total current assets |
400,980 | 734,430 | ||||||
|
|
|
|
|
|||||
| Restricted cash, non-current |
| 6,500 | ||||||
| Contract assets, non-current |
122 | 2,085 | ||||||
| Deferred contract acquisition costs, non-current |
17,893 | 32,553 | ||||||
| Property and equipment, net |
20,846 | 14,822 | ||||||
| Operating lease right-of-use assets |
22,737 | 17,260 | ||||||
| Intangible assets, net |
11,776 | 10,191 | ||||||
| Goodwill |
25,311 | 28,059 | ||||||
| Deferred tax asset non-current |
| 8,118 | ||||||
| Other assets, non-current |
8,503 | 12,443 | ||||||
|
|
|
|
|
|||||
| Total assets |
$ | 508,168 | $ | 866,461 | ||||
|
|
|
|
|
|||||
| LIABILITIES, CONVERTIBLE PREFERRED STOCK, AND STOCKHOLDERS DEFICIT |
||||||||
| Current liabilities: |
||||||||
| Accounts payable |
$ | 4,608 | $ | 6,682 | ||||
| Accrued expenses and other current liabilities |
32,315 | 36,660 | ||||||
| Accrued compensation and benefits |
58,478 | 110,736 | ||||||
| Deferred payments related to business acquisitions |
18,591 | | ||||||
| Deferred revenues, current |
124,627 | 211,078 | ||||||
|
|
|
|
|
|||||
| Total current liabilities |
238,619 | 365,156 | ||||||
| Deferred revenues, non-current |
40,941 | 61,325 | ||||||
| Operating lease liabilities, non-current |
20,391 | 14,152 | ||||||
| Accrued sales commissions, non-current |
8,967 | | ||||||
| Other liabilities, non-current |
2,372 | 7,564 | ||||||
|
|
|
|
|
|||||
| Total liabilities |
311,290 | 448,197 | ||||||
|
|
|
|
|
|||||
| Commitments and contingencies (Note 11) |
||||||||
| Convertible preferred stock, $0.00001 par value per share, 282,107,559 and 297,973,353 shares authorized as of January 31, 2020 and 2021, respectively; 282,107,559 and 294,257,205 shares issued and outstanding as of January 31, 2020 and 2021, respectively; aggregate liquidation preference of $998,033 and $1,223,936 as of January 31, 2020 and 2021, respectively |
996,389 | 1,221,968 | ||||||
| Stockholders deficit: |
||||||||
| Class A common stock, $0.00001 par value per share, 565,200,000 and 581,000,000 shares authorized as of January 31, 2020 and 2021, respectively; 41,882,853 and 75,176,582 shares issued and outstanding as of January 31, 2020 and 2021, respectively; |
| 1 | ||||||
| Class B common stock, $0.00001 par value per share, 120,913,572 and 115,741,494 shares authorized as of January 31, 2020 and 2021, respectively; 115,741,494 and 110,653,498 shares issued and outstanding as of January 31, 2020 and 2021, respectively; |
1 | 1 | ||||||
| Additional paid-in capital |
72,229 | 179,175 | ||||||
| Accumulated other comprehensive income (loss) |
6,226 | (12,521 | ) | |||||
| Accumulated deficit |
(877,967 | ) | (970,360 | ) | ||||
|
|
|
|
|
|||||
| Total stockholders deficit |
(799,511 | ) | (803,704 | ) | ||||
|
|
|
|
|
|||||
| Total liabilities, convertible preferred stock, and stockholders deficit |
$ | 508,168 | $ | 866,461 | ||||
|
|
|
|
|
|||||
The accompanying notes are an integral part of these consolidated financial statements.
F-3
Table of Contents
Consolidated Statements of Operations
For the years ended January 31, 2020 and 2021
All amounts in USD thousands except share and per share data
| Year Ended January 31, | ||||||||
| 2020 | 2021 | |||||||
| Revenue: |
||||||||
| Licenses |
$ | 201,648 | $ | 346,035 | ||||
| Maintenance and support |
119,612 | 232,542 | ||||||
| Services and other |
14,896 | 29,066 | ||||||
|
|
|
|
|
|||||
| Total revenue |
336,156 | 607,643 | ||||||
|
|
|
|
|
|||||
| Cost of revenue: |
||||||||
| Licenses |
3,760 | 7,054 | ||||||
| Maintenance and support |
16,503 | 24,215 | ||||||
| Services and other |
39,142 | 34,588 | ||||||
|
|
|
|
|
|||||
| Total cost of revenue |
59,405 | 65,857 | ||||||
|
|
|
|
|
|||||
| Gross profit |
276,751 | 541,786 | ||||||
|
|
|
|
|
|||||
| Operating expenses: |
||||||||
| Sales and marketing |
483,344 | 380,154 | ||||||
| Research and development |
131,066 | 109,920 | ||||||
| General and administrative |
179,624 | 162,035 | ||||||
|
|
|
|
|
|||||
| Total operating expenses |
794,034 | 652,109 | ||||||
|
|
|
|
|
|||||
| Operating loss |
(517,283 | ) | (110,323 | ) | ||||
| Interest income |
6,741 | 1,152 | ||||||
| Other (expense) income, net |
(6,597 | ) | 14,513 | |||||
|
|
|
|
|
|||||
| Loss before income taxes |
(517,139 | ) | (94,658 | ) | ||||
| Provision for (benefit from) income taxes |
2,794 | (2,265 | ) | |||||
|
|
|
|
|
|||||
| Net loss |
$ | (519,933 | ) | $ | (92,393 | ) | ||
|
|
|
|
|
|||||
| Net loss per share attributable to common stockholders, basic and diluted |
$ | (3.41 | ) | $ | (0.55 | ) | ||
|
|
|
|
|
|||||
| Weighted-average shares used in computing net loss per share attributable to common stockholders, basic and diluted |
152,382,428 | 168,255,480 | ||||||
|
|
|
|
|
|||||
The accompanying notes are an integral part of these consolidated financial statements.
F-4
Table of Contents
UIPATH, INC.
Consolidated Statements of Comprehensive Loss
For the years ended January 31, 2020 and 2021
All amounts in USD thousands
| Year Ended January 31, | ||||||||
| 2020 | 2021 | |||||||
| Net loss |
$ | (519,933 | ) | $ | (92,393 | ) | ||
| Other comprehensive income (loss), net of tax: |
||||||||
| Unrealized loss on available-for-sale marketable securities, net |
| (17 | ) | |||||
| Foreign currency translation adjustments |
5,174 | (18,730 | ) | |||||
|
|
|
|
|
|||||
| Other comprehensive income (loss) |
5,174 | (18,747 | ) | |||||
|
|
|
|
|
|||||
| Comprehensive loss |
$ | (514,759 | ) | $ | (111,140 | ) | ||
|
|
|
|
|
|||||
The accompanying notes are an integral part of these consolidated financial statements.
F-5
Table of Contents
UIPATH, INC.
Consolidated Statements of Convertible Preferred Stock and Stockholders Deficit
For the years ended January 31, 2020 and 2021
All amounts in USD thousands except share data
| Convertible Preferred Stock | Common Stock (Class A) |
Common Stock (Class B) |
Additional Paid-in Capital |
Accumulated Other Comprehensive Income (loss) |
Accumulated Deficit |
Total Stockholders Deficit |
||||||||||||||||||||||||||||||||||||||
| Shares | Amount |
|
Shares | Amount | Shares | Amount | Amount | Amount | Amount | Amount | ||||||||||||||||||||||||||||||||||
| Balance as of January 31, 2019 | 237,616,473 | $ | 413,380 | 27,467,685 | $ | | 120,913,572 | $ | 1 | $ | 22,620 | $ | 1,052 | $ | (321,616 | ) | $ | (297,943 | ) | |||||||||||||||||||||||||
| Issuance of convertible preferred stock, net of issuance costs of $591 | 44,491,086 | 583,009 | | | | | | | | | ||||||||||||||||||||||||||||||||||
| Issuance of common stock upon exercise of stock options and vesting of restricted stock units | | | 19,065,540 | | | | 3,774 | | | 3,774 | ||||||||||||||||||||||||||||||||||
| Repurchase and retirement of common stock in connection with convertible preferred stock financing | | | (4,650,372 | ) | | (5,172,078 | ) | | (28,541 | ) | | (36,418 | ) | (64,959 | ) | |||||||||||||||||||||||||||||
| Compensation expense related to repurchase and retirement of common stock | | | | | | | 48,260 | | | 48,260 | ||||||||||||||||||||||||||||||||||
| Stock-based compensation expense | | | | | | | 26,116 | | | 26,116 | ||||||||||||||||||||||||||||||||||
| Other comprehensive income, net of tax | | | | | | | | 5,174 | | 5,174 | ||||||||||||||||||||||||||||||||||
| Net loss | | | | | | | | | (519,933 | ) | (519,933 | ) | ||||||||||||||||||||||||||||||||
|
|
|
|
|
|
|
|
|
|
|
|
|
|
|
|
|
|
|
|
|
|||||||||||||||||||||||||
| Balance as of January 31, 2020 | 282,107,559 | 996,389 | 41,882,853 | | 115,741,494 | 1 | 72,229 | 6,226 | (877,967 | ) | (799,511 | ) | ||||||||||||||||||||||||||||||||
| Issuance of convertible preferred stock, net of issuance costs of $324 | 12,149,646 | 225,579 | | | | | | | | | ||||||||||||||||||||||||||||||||||
| Issuance of common stock upon exercise of stock options and restricted stock awards | | | 28,195,647 | 1 | | | 20,518 | | | 20,519 | ||||||||||||||||||||||||||||||||||
| Issuance of common stock upon vesting of restricted stock awards | | | 10,086 | | | | 373 | | | 373 | ||||||||||||||||||||||||||||||||||
| Compensation expense related to common stock secondary transactions | | | 5,087,996 | | (5,087,996 | ) | | 4,983 | | | 4,983 | |||||||||||||||||||||||||||||||||
| Stock-based compensation expense | | | | | | | 81,072 | | | 81,072 | ||||||||||||||||||||||||||||||||||
| Other comprehensive income, net of tax | | | | | | | | (18,747 | ) | | (18,747 | ) | ||||||||||||||||||||||||||||||||
| Net loss | | | | | | | | | (92,393 | ) | (92,393 | ) | ||||||||||||||||||||||||||||||||
|
|
|
|
|
|
|
|
|
|
|
|
|
|
|
|
|
|
|
|
|
|||||||||||||||||||||||||
| Balance as of January 31, 2021 | 294,257,205 | $ | 1,221,968 | 75,176,582 | $ | 1 | 110,653,498 | $ | 1 | $ | 179,175 | $ | (12,521 | ) | $ | (970,360 | ) | $ | (803,704 | ) | ||||||||||||||||||||||||
|
|
|
|
|
|
|
|
|
|
|
|
|
|
|
|
|
|
|
|
|
|||||||||||||||||||||||||
The accompanying notes are an integral part of these consolidated financial statements.
F-6
Table of Contents
Consolidated Statements of Cash Flows
For the years ended January 31, 2020 and 2021
All amounts in USD thousands
| Year Ended January 31, | ||||||||
| 2020 | 2021 | |||||||
| Cash flows from operating activities |
||||||||
| Net loss |
$ | (519,933 | ) | $ | (92,393 | ) | ||
| Adjustments to reconcile net loss to net cash (used in) provided by operating activities: |
||||||||
| Depreciation and amortization |
8,666 | 12,335 | ||||||
| Amortization of deferred contract acquisition costs |
30,450 | 40,997 | ||||||
| Reversal of deferred contract acquisition cost and accrued sales commissions, net |
(9,229 | ) | ||||||
| Net amortization of premium on marketable securities |
| 263 | ||||||
| Amortization of deferred loan cost |
| 66 | ||||||
| Impairment charges on assets |
1,026 | | ||||||
| Stock-based compensation expense |
137,862 | 86,167 | ||||||
| Non-cash operating lease cost |
7,019 | 7,266 | ||||||
| Provision for bad debt |
928 | 953 | ||||||
| Deferred income taxes |
(1,324 | ) | (7,587 | ) | ||||
| Changes in operating assets and liabilities: |
||||||||
| Accounts receivable |
(52,146 | ) | (76,907 | ) | ||||
| Contract assets |
(5,083 | ) | (21,964 | ) | ||||
| Deferred contract acquisition costs |
(61,037 | ) | (51,058 | ) | ||||
| Prepaid expenses and other assets |
(20,625 | ) | (8,564 | ) | ||||
| Accounts payable |
(14,557 | ) | 1,893 | |||||
| Accrued expenses and other liabilities |
18,763 | 6,122 | ||||||
| Accrued compensation and benefits |
17,735 | 49,924 | ||||||
| Operating lease liabilities, net |
(5,064 | ) | (8,080 | ) | ||||
| Deferred revenue |
97,884 | 98,973 | ||||||
|
|
|
|
|
|||||
| Net cash (used in) provided by operating activities |
(359,436 | ) | 29,177 | |||||
|
|
|
|
|
|||||
| Cash flows from investing activities: |
||||||||
| Purchases of marketable securities |
| (103,108 | ) | |||||
| Purchases of property and equipment |
(15,748 | ) | (1,953 | ) | ||||
| Payments related to business acquisitions; net of cash acquired |
(18,525 | ) | (19,690 | ) | ||||
| Capitalized software development costs |
(5,233 | ) | (1,240 | ) | ||||
|
|
|
|
|
|||||
| Net cash used in investing activities |
(39,506 | ) | (125,991 | ) | ||||
|
|
|
|
|
|||||
| Cash flows from financing activities: |
||||||||
| Proceeds from issuance of convertible preferred stock |
583,600 | 225,903 | ||||||
| Issuance costs related to convertible preferred stock |
(591 | ) | (324 | ) | ||||
| Proceeds from exercise of stock options |
3,599 | 26,379 | ||||||
| Repurchase and retirement of common stock |
(128,843 | ) | | |||||
| Proceeds from credit agreement |
78,587 | |||||||
| Repayment of credit agreement |
(78,587 | ) | ||||||
| Payment of deferred loan cost related to senior secured credit facility |
(808 | ) | ||||||
| Payments of deferred offering costs |
| (732 | ) | |||||
|
|
|
|
|
|||||
| Net cash provided by financing activities |
457,765 | 250,418 | ||||||
|
|
|
|
|
|||||
| Effect of exchange rate changes |
3,190 | (16,545 | ) | |||||
|
|
|
|
|
|||||
| Net increase in cash, cash equivalents and restricted cash |
62,013 | 137,059 | ||||||
| Cash, cash equivalents, and restricted cash at beginning of period |
172,118 | 234,131 | ||||||
|
|
|
|
|
|||||
| Cash, cash equivalents, and restricted cash at end of period |
$ | 234,131 | $ | 371,190 | ||||
|
|
|
|
|
|||||
| Supplemental disclosures of cash flow information: |
||||||||
| Cash paid for interest |
$ | 96 | $ | 1,708 | ||||
| Cash paid for income taxes |
$ | 3,525 | $ | 4,509 | ||||
| Supplemental disclosures of non-cash investing and financing activity: |
||||||||
| Stock-based compensation capitalized for software development |
$ | 398 | $ | 261 | ||||
| Deferred payments related to business acquisitions |
$ | 18,591 | $ | | ||||
| Cashless exercise of options |
$ | 175 | $ | | ||||
| Reduction in accrued expenses and other liabilities for vesting of early exercised stock options |
$ | | $ | 1,762 | ||||
| Deferred offering costs, accrued but not paid |
$ | | $ | 762 | ||||
The accompanying notes are an integral part of these consolidated financial statements.
F-7
Table of Contents
Notes to Consolidated Financial Statements
For the years ended January 31, 2020 and 2021
All amounts in USD thousands except share, per share data, and percentages
1. Description of Business
UiPath, Inc. (the Company, we, us, or our) was incorporated in Delaware in June 2015 and is headquartered in New York. We offer an end-to-end automation platform which provides a range of robotic process automation (RPA) solutions via a suite of interrelated software offerings (the RPA Software), including:
| | UiPath Studio (Studio) Studio is an easy to use, drag-and-drop development platform designed for RPA developers looking to build complex process automations with built-in governance capabilities. Studio features robust debugging tools, application programming interface (API) automation, wizards to automate desktop or web applications, the ability to leverage custom code, and a simple way to integrate machine learning models into production workflows. |
| | UiPath Robots Emulates human behavior to execute the processes built in Studio. Robots can work unattended (run without human supervision in any environment, virtual or not) or attended (a human triggers the process). |
| | UiPath Orchestrator (Orchestrator) Orchestrator tracks and logs Robot activity, along with what people do in tandem to maintain strict compliance and governance through dashboards and visualization tools. Orchestrator enables seamless integration with Marketplace, which is UiPaths database of vetted, pre-built, and reusable automation activities and components, software, and third-party products, giving the opportunity to leverage our global RPA community and deploy automations across cloud, on-premises, and hybrid environments. |
We provide our offerings by selling a software license to customers which allows customers to use the RPA Software on their own hardware (i.e., term and perpetual licenses) or in cloud. Additionally, we may offer maintenance and support, training, and implementation services to our customers to facilitate their adoption of the RPA Software.
We have legal presence in 29 countries, with our principal operations in the United States, Romania, and Japan.
2. Summary of Significant Accounting Policies
Basis of Presentation
The consolidated financial statements have been prepared in accordance with accounting principles generally accepted in the United States of America (U.S. GAAP) and include the financial statements of UiPath, Inc. and its wholly owned subsidiaries in which we hold a controlling financial interest or are the primary beneficiary. Intercompany transactions and accounts have been eliminated in consolidation.
Fiscal Year
Our fiscal year ends on January 31. References to fiscal years 2020 and 2021, refer to the fiscal years ended January 31, 2020 and 2021, respectively. We changed the end of our fiscal year from December 31 to January 31, effective for our fiscal year 2019.
F-8
Table of Contents
UIPATH, INC.
Notes to Consolidated Financial Statements
For the years ended January 31, 2020 and 2021
All amounts in USD thousands except share, per share data, and percentages
Stock Split
On July 9, 2020, we effected a three-for-one stock split of our outstanding common stock, convertible preferred stock, stock options, and restricted stock units (RSUs) without any change in the par value per share. As a result, all information related to shares outstanding of common stock, convertible preferred stock, stock options, RSUs, restricted stock awards (RSAs), share prices, and net loss per share, presented in our consolidated financial statements and the accompanying notes have been adjusted to give retrospective presentation for the stock split.
Liquidity
During the fiscal year ended January 31, 2021, we generated cash flows from operations of $29,177 and incurred a net loss of $92,393. Historically, our liquidity needs have been met by capital equity raises. During the fiscal year ended January 31, 2021, we raised $225,903 from the issuance of Series E convertible preferred stock. We believe that based on our operating plan for fiscal years 2022 and 2023 which forecasts increased revenue, while managing expenses, the existing cash and cash equivalents and marketable securities at January 31, 2021, cash generated from sales to our customers and, if necessary, our available borrowing capacity under our revolving loan credit agreement, together with funds raised in February 2021 of $750,000 from the sale and issuance of Series F convertible preferred stock, as further discussed in Note 17, Subsequent Events, will be sufficient to fund anticipated cash requirements for twelve months subsequent to the issuance of the consolidated financial statements. Should our cash flows used exceed our available cash, we may be required to reduce expected costs and/or seek additional financing or raise additional capital from new or existing investors. However, no assurances can be provided that additional funding or alternative financing will be available at terms acceptable to us or at all.
Use of Estimates
The preparation of consolidated financial statements in conformity with U.S. GAAP requires management to make estimates and assumptions that affect the amounts of assets and liabilities at the date of the consolidated financial statements and amounts of revenue and expenses reported during the period. We evaluate estimates based on historical and anticipated results, trends, and various other assumptions. Such estimates include, but are not limited to, revenue recognition, the estimated expected benefit period for deferred contract acquisition costs, allowance for doubtful accounts, the fair value of financial assets and liabilities, including accounting and fair value of derivatives, the fair value of acquired assets and liabilities, the useful lives of long-lived assets, capitalized software development costs, acquired intangible assets, the carrying value of operating lease right-of-use (ROU) assets, the incremental borrowing rate for operating leases, stock-based compensation, fair value of common stock, contingencies, and valuation allowance for deferred income taxes. Actual results could differ from these estimates and assumptions.
In March 2020, the World Health Organization declared the spread of a novel strain of coronavirus (COVID-19) to become a Public Health Emergency of International Concern. This contagious disease outbreak, which has continued to spread, and any related adverse public health developments, has adversely affected workforces, customers, economies, and financial markets globally, potentially leading to an economic downturn. It has also disrupted the normal operations of many businesses, including ours. This outbreak could decrease technology spending, adversely affect demand for our product and harm our business and results of operations. As of the date of issuance of these consolidated financial statements, although COVID-19 has not had a significant impact on our operating results, the extent to which COVID-19 may impact the future financial condition or results of operations is still uncertain. We are not aware of any specific event or circumstance that
F-9
Table of Contents
UIPATH, INC.
Notes to Consolidated Financial Statements
For the years ended January 31, 2020 and 2021
All amounts in USD thousands except share, per share data, and percentages
would require an update on estimates, judgments or adjustments to the carrying value of assets or liabilities. These estimates may change, as new events occur and additional information is obtained, and will be recognized in the consolidated financial statements as soon as they become known.
Foreign Currency
The functional currency of our non-U.S. subsidiaries is the local currency. Asset and liability balances denominated in non-U.S. dollar currencies are translated into U.S. dollars using period-end exchange rates, while revenue and expenses are translated using the average monthly exchange rates. Differences are included in stockholders deficit as a component of accumulated other comprehensive income (loss). Financial assets and liabilities denominated in currencies other than the functional currency are recorded at the exchange rate at the time of the transaction and subsequent gains and losses related to changes in the foreign currency are included in other (expense) income, net in the consolidated statements of operations. For fiscal years 2020 and 2021, we recognized transaction losses of $6,501 and transaction gains of $18,425, respectively.
Concentration of Risks
Financial instruments that potentially subject us to significant concentrations of credit risk consist principally of cash and cash equivalents, marketable securities and accounts receivable. We maintain our cash balance at financial institutions that management believes are high-credit, quality financial institutions, where deposits, at times, exceed the Federal Deposit Insurance Corporation (FDIC) limits. We have not experienced any losses on cash and cash equivalents to date. As of January 31, 2020 and 2021, 97% and 92% of our cash, cash equivalents, and restricted cash were concentrated in the United States, EU countries, and Japan, respectively.
We extend differing levels of credit to customers, do not require collateral deposits, and when necessary maintain reserves for potential credit losses based upon the expected collectability of accounts receivable. We manage credit risk related to our customers by performing periodic evaluations of credit worthiness and applying other credit risk monitoring procedures.
Significant customers are those which represent 10% or more of our total revenue for the period or accounts receivable at the balance sheet date. For fiscal years 2020 or 2021, no customer accounted for 10% or more of our total revenue.
As of January 31, 2020 and 2021, no customer accounted for 10% or more of our accounts receivable.
Cash, Cash Equivalents, and Restricted Cash
Cash includes cash held in checking and savings accounts with financial institutions.
We consider all highly liquid investments with maturity dates of three months or less when purchased to be cash equivalents. Restricted cash represents cash on deposit for forward agreements and cash collateral for credit cards.
F-10
Table of Contents
UIPATH, INC.
Notes to Consolidated Financial Statements
For the years ended January 31, 2020 and 2021
All amounts in USD thousands except share, per share data, and percentages
The following table provides a reconciliation of cash, cash equivalents, and restricted cash reported within the consolidated balance sheets that sum to the total of the same such amounts shown in the consolidated statements of cash flows:
| As of January 31, | ||||||||
| 2020 | 2021 | |||||||
| Cash and cash equivalents |
$ | 232,386 | $ | 357,690 | ||||
| Restricted cash, current |
1,745 | 7,000 | ||||||
| Restricted cash, non-current |
| 6,500 | ||||||
|
|
|
|
|
|||||
| Total cash, cash equivalents, and restricted cash |
$ | 234,131 | $ | 371,190 | ||||
|
|
|
|
|
|||||
Marketable Securities
Our marketable securities consist of corporate bonds and commercial paper with maturity dates of more than three months from the date of purchase. We determine the appropriate classification of our marketable securities at the time of purchase and reevaluate such designation at each balance sheet date. We have classified and accounted for our marketable securities as available-for-sale securities as we may sell these securities at any time for use in our current operations or for other purposes, even prior to maturity. As a result, we classify our marketable securities as current assets in the consolidated balance sheets.
Available-for-sale securities are recorded at fair value each reporting period. Premiums and discounts are amortized or accreted over the life of the related available-for-sale security as an adjustment to yield. Interest income is recognized when earned. Unrealized gains and losses on these marketable securities are reported as a separate component of accumulated other comprehensive income (loss) on the consolidated balance sheets until realized. Realized gains and losses are determined based on the specific identification method and are reported in other (expense) income, net in the consolidated statements of operations. We periodically evaluate our marketable securities to assess whether those with unrealized loss positions are other than temporarily impaired. We consider various factors in determining whether to recognize an impairment charge. If we determine that the decline in an investments fair value is other-than-temporary, the difference is recognized as an impairment loss in the consolidated statements of operations. As of January 31, 2021, we have not recorded any other-than-temporary-impairment charges in our consolidated statements of operations.
Fair Value of Financial Instruments
We utilize valuation techniques that maximize the use of observable inputs and minimize the use of unobservable inputs to the extent possible. We determine fair value based on assumptions that market participants would use in pricing an asset or liability in the principal or most advantageous market. When considering market participant assumptions in fair value measurements, the following fair value hierarchy distinguishes between observable and unobservable inputs, which are categorized in one of the following levels:
| Level 1 |
Quoted prices in active markets for identical assets or liabilities at the measurement date. |
|
| Level 2 |
Inputs other than Level 1 that are observable, either directly or indirectly, such as quoted prices for similar assets or liabilities; quoted prices in markets that are not active near the measurement date; or other inputs that are observable or can be corroborated by observable market data for substantially the full term of the assets or liabilities. |
|
| Level 3 |
Unobservable inputs that are supported by little or no market activity and that are significant to the fair value of the assets or liabilities. |
|
F-11
Table of Contents
UIPATH, INC.
Notes to Consolidated Financial Statements
For the years ended January 31, 2020 and 2021
All amounts in USD thousands except share, per share data, and percentages
Financial instruments consist of cash equivalents, marketable securities, accounts receivable, derivative financial instruments, and accounts payable. Marketable securities and derivative liabilities are stated at fair value. Cash equivalents, accounts receivable and accounts payable are stated at their carrying value, which approximates fair value due to the short time to the expected receipt or payment date.
Accounts Receivable, Net
Accounts receivable consist of amounts billed and currently due from customers, which are subject to collection risk. Our accounts receivable is reduced by an allowance for doubtful accounts. This allowance is for estimated losses resulting from the inability of our customers to make required payments. It is an estimate and is regularly evaluated for adequacy by taking into consideration a combination of factors such as past collection experience, credit quality of the customer, age of the receivable balance and current economic conditions. These factors are reviewed to determine whether a provision for doubtful accounts should be recorded to reduce the receivable balance to the amount believed to be collectible. We write off accounts receivable when they are determined to be uncollectable. We have not experienced significant credit losses from accounts receivable. The allowance for doubtful accounts was $1,814 and $2,879 as of January 31, 2020 and 2021, respectively.
Derivative Financial Instruments
We use derivative financial instruments, such as foreign currency forward contracts, to manage foreign currency exposures. We account for our derivative instruments as either assets or liabilities and carry them at fair value. These foreign currency contracts are not designated and do not qualify as hedging instruments, as defined by Accounting Standards Codification (ASC) Topic 815, Derivative and Hedging.
As of January 31, 2021, derivative instruments totaling $571 are recorded in accrued expenses and other current liabilities in the consolidated balance sheets. We record changes in the fair value of these derivatives as a component of other (expense) income, net in the consolidated statements of operations. The notional principal of foreign currency forward contracts outstanding was $138,580 as of January 31, 2021. Losses associated with foreign currency forward contracts for the fiscal year ended January 31, 2021 were $4,477. There were no derivative financial instruments as of January 31, 2020.
Property and Equipment, Net
Property and equipment are stated at historical cost, less accumulated depreciation and amortization. Depreciation of property and equipment is calculated using the straight-line method over the estimated useful lives of the assets. Useful lives by asset category are as follows:
| Computer and equipment |
1 to 2 years |
|
| Furniture and fixtures |
2 to 9 years |
|
| Leasehold improvements |
Shorter of remaining lease term or estimated useful life (1 to 7 years) |
Maintenance and repairs that do not enhance or extend the assets useful life are expensed as incurred. Major replacements, improvements and additions are capitalized. Upon the sale or retirement of property and equipment, the cost and the related accumulated depreciation or amortization are removed from the consolidated financial statements, with any resulting gain or loss included in the consolidated statements of operations.
F-12
Table of Contents
UIPATH, INC.
Notes to Consolidated Financial Statements
For the years ended January 31, 2020 and 2021
All amounts in USD thousands except share, per share data, and percentages
Internal-Use Software
We capitalize internal software implementation costs incurred to develop or obtain internal-use software. These capitalized costs exclude training costs, project management costs, and data migration costs. Costs incurred to implement a cloud computing arrangement that is a service contract are capitalized in our consolidated financial statements in the same manner as other service costs and assets related to service contracts. Capitalized implementation costs are amortized using the straight-line method over the terms of the associated hosting arrangements and are recorded under operating expenses in the same line item in the consolidated statements of operations as the expense for fees for the associated hosting arrangement. Capitalized implementation costs were $1,319 and $2,606 as of January 31, 2020 and 2021, respectively, and are recorded in other assets, non-current in the consolidated balance sheets. Amortization expense was $144 and $374 for fiscal years 2020 and 2021, respectively.
Software Development Costs
We account for costs incurred to develop software to be licensed in accordance with ASC 985-20 (ASC 985-20), Costs of Software to be Sold, Leased or Marketed. ASC 985-20 requires all costs incurred to establish technological feasibility to be expensed as they are incurred. Technological feasibility is established when the working model is complete. Costs incurred subsequent to establishing technological feasibility are capitalized until the product is available for general release to customers, at which point they are amortized on a product by product basis. Capitalized costs are included in other assets, non-current on the consolidated balance sheets. These costs are amortized over the estimated useful life of the software, which is five years, on a straight-line basis, and are included in cost of licenses revenue in the consolidated statements of operations. Management evaluates the useful life of these assets on an annual basis and tests for impairment whenever events or changes in circumstances occur that could impact the recoverability of these assets. Capitalized software development costs were $2,676 and $2,878 as of January 31, 2020 and 2021, respectively, and amortization expense was $207 and $513 for fiscal years 2020 and 2021, respectively.
Costs incurred in the development phase of cloud offerings are capitalized pursuant to ASC 350-40, Internal Use Software, and amortized over the products estimated useful life, which is five years and are included in cost of licenses revenue in the consolidated statements of operations. Capitalized costs include salaries, benefits, and stock-based compensation charges for employees that are directly involved in developing our cloud-based products. These capitalized costs are included in other assets, non-current on the consolidated balance sheets. Capitalized software development costs were $2,955 and $4,434 as of January 31, 2020 and 2021, respectively, and amortization expenses were zero and $453 for fiscal years 2020 and 2021, respectively.
Leases
We determine if an arrangement contains a lease at inception based on whether there is an identified asset and whether we control the use of the identified asset throughout the period of use. We classify leases as either financing or operating leases. We do not have any financing leases. Operating lease ROU assets represent our right to use an underlying asset for the lease term and operating lease liabilities represent our obligation to make lease payments arising from the lease. Operating lease liabilities are recognized at the lease commencement date based on the present value of future lease payments over the lease term.
The present value of lease payments is discounted based on the more readily determinable of (i) the rate implicit in the lease or (ii) our incremental borrowing rate. Because our operating leases generally do not provide
F-13
Table of Contents
UIPATH, INC.
Notes to Consolidated Financial Statements
For the years ended January 31, 2020 and 2021
All amounts in USD thousands except share, per share data, and percentages
an implicit rate, we estimate our incremental borrowing rate based on the information available at lease commencement date for collateralized borrowings with a similar term, an amount equal to the lease payments and in a similar economic environment where the leased asset is located. The collateralized borrowings were based on our credit rating corroborated with market credit metrics like debt level and interest coverage.
Our operating lease ROU assets are measured based on the corresponding operating lease liability adjusted for (i) payments made to the lessor at or before the commencement date, (ii) initial direct costs incurred, and (iii) tenant incentives under the lease. Options to renew or terminate the lease are recognized as part of our operating lease ROU assets and operating lease liabilities when it is reasonably certain the options will be exercised.
We do not allocate consideration between lease and non-lease components, such as maintenance costs, as we have elected to not separate lease and non-lease components for any leases within our existing classes of assets. Operating lease expense for fixed lease payments is recognized on a straight-line basis over the lease term. Variable lease payments for real estate taxes, insurance, maintenance, and utilities, which are generally based on our pro rata share of the total property, are not included in the measurement of the operating lease ROU assets or operating lease liabilities and are expensed as incurred.
Business Acquisitions
We apply the acquisition method of accounting for business combinations. Under this method of accounting, all assets acquired and liabilities assumed are recorded at their respective fair values at the date of the acquisition. Determining the fair value of assets acquired and liabilities assumed requires managements judgment and often involves the use of significant estimates and assumptions, including assumptions with respect to future cash inflows and outflows, discount rates, intangibles, and other asset lives, among other items. Fair value is defined as the price that would be received to sell an asset or paid to transfer a liability in an orderly transaction between market participants at the measurement date. Market participants are assumed to be buyers and sellers in the principal, most advantageous market for the asset or liability. Additionally, fair value measurements for an asset assume the highest and best use of that asset by market participants. Any excess of the purchase price over the fair value of the net assets acquired is recognized as goodwill.
During the measurement period, which may be up to one year from the acquisition date, we may record adjustments to the fair value of these tangible and intangible assets acquired and liabilities assumed, with the corresponding offset to goodwill. In addition, uncertain tax positions and tax-related valuation allowances are initially recorded in connection with a business acquisition as of the acquisition date. Upon the conclusion of the measurement period or final determination of the fair value of assets acquired or liabilities assumed, whichever comes first, any subsequent adjustments are recorded in our consolidated statements of operations. Acquisition costs, such as legal and consulting fees, are expensed as incurred.
Goodwill and Intangible Assets
Goodwill represents the excess of the purchase price in a business acquisition over the fair value of the net assets acquired. Goodwill is tested for impairment at the reporting unit level at least annually in November, or between annual tests, when events or changes in circumstances indicate the carrying amount may not be recoverable, and written down when impaired. Goodwill is tested for impairment by comparing the fair value of the reporting unit with its carrying value. We have determined that we have one reporting unit. We adopted Accounting Standards Update (ASU) No. 2017-04, Intangibles Goodwill and Other (Topic 350):
F-14
Table of Contents
UIPATH, INC.
Notes to Consolidated Financial Statements
For the years ended January 31, 2020 and 2021
All amounts in USD thousands except share, per share data, and percentages
Simplifying the Test for Goodwill Impairment, which simplifies the subsequent measurement of goodwill by removing the second step of the two-step impairment test, effective February 1, 2019, and applied the new guidance when evaluating goodwill for impairment during fiscal years 2020 and 2021. The amendment requires an entity to perform its annual or interim goodwill impairment test by comparing the fair value of a reporting unit with its carrying amount. If the carrying amount of the reporting unit exceeds the estimated fair value, an impairment charge is recorded to reduce the carrying value to the estimated fair value. There were no impairment charges to goodwill during fiscal years 2020 and 2021.
Acquired intangible assets consist of identifiable intangible assets, primarily software technology and customer relationships, resulting from our business acquisitions. Intangible assets are recorded at fair value on the date of acquisition and are amortized over their estimated useful lives.
Impairment of Long-Lived Assets
We evaluate our long-lived assets for indicators of possible impairment when events or changes in circumstances indicate the carrying amount of an asset or asset group may not be recoverable. We measure the recoverability of these assets by comparing the carrying amount of such assets or asset group to the future undiscounted cash flow we expect the assets or asset group to generate. If we consider any of these assets to be impaired, the impairment to be recognized equals the amount by which the carrying value of the assets exceeds its fair value. An asset is considered impaired if the carrying amount exceeds the undiscounted future net cash flows that the asset is expected to generate. During fiscal year 2020, we concluded that, as a result of our restructuring plan, the carrying values of our Houston office, including operating lease ROU assets, leasehold improvements, and furniture and fixtures exceeded their estimated fair values. As a result, we recorded an impairment loss of $1,026, consisting of $444 from operating lease ROU assets and $582 from property and equipment as of January 31, 2020. This impairment loss was recorded in general and administrative expense in the consolidated statements of operations. See Note 11, Commitments and Contingencies Workforce Restructuring, for further details on our workforce restructuring. During the fiscal year ended January 31, 2021, the lease agreement was terminated and the remaining operating lease ROU asset, leasehold improvements and their related impairments have been written-off. There were no events or changes in circumstances that indicated our long-lived assets were impaired for fiscal year 2021.
Deferred Offering Costs
Deferred offering costs consist primarily of accounting, legal, and other fees related to our proposed initial public offering (IPO). Upon consummation of the IPO, the deferred offering costs will be offset against the proceeds from the offering. In the event the offering is aborted, deferred offering costs will be expensed. We capitalized $1,494 of deferred offering costs within other assets, noncurrent in the consolidated balance sheet as of January 31, 2021. No offering costs were capitalized as of January 31, 2020.
Revenue Recognition
We derive our revenue from the sale of our software licenses for use of our proprietary software, maintenance and support for our licenses, right to access certain products that are hosted by us (i.e., software as a service (SaaS)), and professional services. We recognize revenue pursuant to ASC 606, Revenue from Contracts with Customers (ASC 606). In accordance with ASC 606, revenue is recognized when a customer obtains control of promised goods or services are delivered. The amount of revenue recognized reflects the
F-15
Table of Contents
UIPATH, INC.
Notes to Consolidated Financial Statements
For the years ended January 31, 2020 and 2021
All amounts in USD thousands except share, per share data, and percentages
consideration that we expect to receive in exchange for these goods or services. To achieve the core principle of this standard, we applied the following five steps:
| 1. | Identification of the contract, or contracts, with the customer; |
| 2. | Identification of the performance obligations in the contract; |
| 3. | Determination of the transaction price; |
| 4. | Allocation of the transaction price to the performance obligations in the contract; and |
| 5. | Recognition of the revenue when, or as, a performance obligation is satisfied. |
Each of our significant performance obligations and our application of ASC 606 to our revenue arrangements are discussed in further detail below.
Licenses
We sell term licenses which provide customers the right to use software for a specified period of time and perpetual licenses which provide customers the right to use software for an indefinite period of time. For each respective type of license, revenue is recognized at the point-in-time when the customer is able to use and benefit from the software, which is generally upon delivery to the customer or upon the commencement of the renewal term. For licenses revenue, we generally invoice when the license(s) are provided.
Maintenance and Support
Maintenance and support are provided for both term and perpetual license arrangements and consists of technical support and the provision of unspecified updates and upgrades on a when-and-if-available basis. Maintenance for perpetual licenses is renewable, generally on an annual basis, at the option of the customer. Maintenance represents stand-ready obligations for which revenue is recognized ratably over the term of the arrangement. For maintenance and support services, we generally invoice for maintenance and support when the associated license(s) are provided.
Hybrid and Cloud-Based Arrangements
In fiscal year 2021, we started offering hybrid and cloud solutions. Hybrid solutions are comprised of three performance obligations, license, maintenance and support, and right to access certain products that are hosted by us, SaaS. Revenue from license and maintenance and support are accounted for pursuant to the paragraphs above. The performance obligation under the cloud component of the hybrid solution and SaaS arrangements is a stand-ready obligation to provide access to our products. Revenues from the cloud component of the hybrid solution and SaaS arrangements are recognized on a ratable basis over the contractual period of the arrangement beginning when or as control of the promised good or services is transferred to the customer. The revenues related to the cloud component of the hybrid arrangement together with the revenues related to the cloud-based arrangements are presented as Revenues, maintenance and support in our results of operations, as such revenue was not material to total revenue for the fiscal year ended January 31, 2021.
Services and Other
Revenue from services and other consists of fees associated with process automation, customer education and training services. A substantial majority of the professional service contracts are recognized on a time and materials basis and the related revenue is recognized as the service hours are rendered. For non-recurring professional services, we invoice as the work is incurred or in advance.
F-16
Table of Contents
UIPATH, INC.
Notes to Consolidated Financial Statements
For the years ended January 31, 2020 and 2021
All amounts in USD thousands except share, per share data, and percentages
Material Rights
Contracts with customers may include material rights which are also performance obligations. Material rights primarily arise when the contract gives the customer the right to renew or receive products or services at greater discounted prices in the future. The revenue associated with material rights is recognized at the earlier of the time of exercise or expiration of the customers rights.
Contracts with Multiple Performance Obligations
Most contracts with customers contain multiple performance obligations that are distinct and are accounted for separately. The transaction price is allocated to the separate performance obligations on a relative stand-alone selling price (SSP) basis. We determine SSP for all performance obligations using observable inputs and external market data, such as standalone sales, historical contract pricing, and industry pricing data available to the public. SSP is consistent with our overall pricing objectives, taking into consideration the type of licenses, maintenance and support services, and professional services purchased by the customer. SSP also reflects the amount we would charge for that performance obligation if it were sold separately in a standalone sale, and the price we would sell to similar customers in similar circumstances.
Other Policies and Judgments
Payment terms and conditions vary by contract type, although terms generally include a requirement of payment within 30 to 60 days of the invoice date. In certain arrangements, we receive payment from a customer either before or after the performance obligation has been satisfied; however, our contracts do not contain a significant financing component. The primary purpose of our invoicing terms is to provide customers with simplified and predictable ways of purchasing our products and services, not to receive financing from our customers or to provide customers with financing. We applied the practical expedient in ASC 606 and did not evaluate payment terms of one year or less for the existence of a significant financing component. Revenue is recorded net of sales tax. We generally do not offer right of refund in our contracts.
Contract Balances
Contract assets consist of unbilled accounts receivable, which occur when a right to consideration for our performance under the customer contract occurs before invoicing the customer. Accounts receivable are recorded when the customer has been billed and the right to consideration is unconditional. The amount of unbilled accounts receivable is included within contract assets, current and non-current on the consolidated balance sheets.
Contract liabilities consist of deferred revenue. Revenue is deferred when we invoice in advance of performance under a contract. The current portion of the deferred revenue balance is recognized as revenue during the 12-month period after the balance sheet date. The non-current portion of the deferred revenue balance is recognized as revenue following the 12-month period after the balance sheet date. Of the $70,705 and $165,568 of deferred revenue as of January 31, 2019 and January 31, 2020, respectively, we recognized $55,321 and $124,627 as revenue during the fiscal years 2020 and 2021, respectively.
Deferred Contract Acquisition Costs
We defer sales commissions that are incremental to the acquisition of customer contracts. These costs are recorded as deferred contract acquisition costs on the consolidated balance sheets. We determine whether costs
F-17
Table of Contents
UIPATH, INC.
Notes to Consolidated Financial Statements
For the years ended January 31, 2020 and 2021
All amounts in USD thousands except share, per share data, and percentages
should be deferred, based on their sales compensation plans, if the sales commissions are incremental, and would not have occurred absent the customer contract.
During fiscal years 2020 and 2021, sales commissions for renewal of a subscription contract are commensurate with the sales commissions paid for the acquisition of the initial subscription contract because the minimal to no difference in sales commission rates between new and renewal contracts. Sales commissions paid upon the initial acquisition of a contract are amortized over the contract term, while sales commissions paid related to renewal contracts are amortized over the renewal term. We have applied the practical expedient in ASC 340-40, Other Assets and Deferred Costs to expense costs as incurred for costs to obtain a contract with a customer when the amortization period would have been one year or less.
At the end of fiscal year 2021, we approved a new sales incentive plan for fiscal year 2022, under which, sales commissions for renewal of a subscription contract are not commensurate with the commissions paid on initial contract. Under the new sales incentive plan, we defer incremental commissions related to initial contracts and amortize such costs over the expected period of benefit, which we determined to be five years. We determined the period of benefit by taking into consideration the length of our customer contracts, the technology lifecycle, and other factors. This change is accounted for as a change in accounting estimate. The impact of such change is $9,229, resulting from the reversal of accrued sales commission of $14,655 partially offset by the reversal of deferred contract acquisition cost of $5,426.
Amortization is recognized consistently with the pattern of revenue recognition of the respective performance obligation to which the contract costs relate to. Amortization of deferred contract acquisition costs is included in sales and marketing expense in the consolidated statements of operations.
We periodically review deferred contract acquisition costs to determine whether events or changes in circumstances have occurred that could impact the period of benefit. There were no impairment losses recorded for fiscal years 2020 and 2021.
Cost of Revenue
Licenses
Cost of licenses revenue consists of all direct costs to deliver our licenses to our customers, amortization of software development costs, direct costs related to third party software resales, and amortization of acquired developed technology.
Maintenance and Support
Cost of maintenance and support revenue primarily consists of personnel-related expenses of our customer support and technical support personnel, including salaries and bonuses, stock-based compensation expense and employee benefit costs. Cost of maintenance and support revenue also includes third-party consulting services, hosting costs related to our hybrid and cloud-based arrangements, amortization of software development costs related to cloud products, and allocated overhead. Overhead is allocated to cost of maintenance and support revenue based on applicable headcount. We recognize these expenses as they are incurred.
F-18
Table of Contents
UIPATH, INC.
Notes to Consolidated Financial Statements
For the years ended January 31, 2020 and 2021
All amounts in USD thousands except share, per share data, and percentages
Services and Other
Cost of services and other revenue primarily consists of personnel-related expenses of our professional service personnel, including salaries and bonuses, stock-based compensation expense, and employee benefit costs. Cost of services and other revenue also includes third-party consulting services and allocated overhead. Overhead is allocated to cost of services and other revenue based on applicable headcount. We recognize these expenses as they are incurred.
Sales and Marketing
Sales and marketing expenses consist primarily of personnel-related expenses associated with our sales and marketing personnel and related sales support teams, including salaries and bonuses, stock-based compensation expense, and employee benefit costs, sales and partner commissions, marketing events, advertising costs, travel, trade shows, other marketing materials, and allocated overhead. Advertising expenses were $36,403 and $21,327 for fiscal years 2020 and 2021, respectively.
Research and Development
Research and development expenditures are recognized as an expense when incurred. Research and development expenses consist primarily of personnel-related expenses, including salaries and bonuses, stock-based compensation expense, and employee benefits costs for our research and development employees.
General and Administrative
General and administrative expenses consist primarily of personnel-related expenses, including salaries and bonuses, stock-based compensation expense, and employee benefits costs associated with our finance, legal, human resources, compliance, and other administrative personnel, as well as accounting and legal professional services fees, other corporate-related expenses, and allocated overhead.
Stock-Based Compensation
We recognize stock-based compensation expense in accordance with the provisions of ASC 718, Compensation - Stock Compensation (ASC 718). ASC 718 requires the measurement and recognition of compensation expense for all stock-based awards made to employees, directors and non-employees based on the grant date fair value of the awards. The fair value of each stock option is estimated on the date of grant using the Black-Scholes option pricing model (OPM). The fair value of an award is recognized as an expense over the requisite service period on a straight-line basis. Stock-based compensation expense is included in cost of revenue and operating expenses within our consolidated statements of operations based on the expense classification of the individual earning the award.
The determination of the grant date fair value of stock-based awards is affected by the estimated fair value of our common stock as well as other highly subjective assumptions, including, but not limited to, the expected term of the stock-based awards, expected stock price volatility, risk-free interest rates, and expected dividends, which are estimated as follows:
| | Fair value per share of our common stock. Because there is no public market for our common stock, the board of directors, with the assistance of a third-party valuation specialist, determined the common |
F-19
Table of Contents
UIPATH, INC.
Notes to Consolidated Financial Statements
For the years ended January 31, 2020 and 2021
All amounts in USD thousands except share, per share data, and percentages
| stock fair value at the time of the grant of stock options based on generally acceptable valuation methodologies for the stock of a privately held company using a hybrid method that considered both OPM and the probability weighted expected return method (PWERM). |
| | Expected term. The expected term represents the period that options are expected to be outstanding. We determine the expected term using the simplified method. The simplified method deems the term to be the average of the time-to-vesting and the contractual life of the options. |
| | Expected volatility. As a public market for our common stock does not exist, there is no trading history of the common stock. We estimated the expected volatility based on the implied volatility of similar publicly held entities, referred to as guideline companies, over a look-back period equivalent to the expected term of the awards. In evaluating the similarity of guideline companies, we considered factors such as industry, stage of life cycle, size, and financial leverage. |
| | Risk-free interest rate. The risk-free interest rate used to value stock-based awards is based on the U.S. Treasury yield in effect at the time of grant for a period consistent with the expected term of the award. |
| | Estimated dividend yield. The expected dividend was assumed to be zero as we have never declared or paid any cash dividends and do not currently intend to declare dividends in the foreseeable future. |
The assumptions used in calculating the fair value of stock-based awards represent our best estimates, but these estimates involve inherent uncertainties and the application of judgment. As a result, if factors change or if we use different assumptions, stock-based compensation expense could be materially different in the future. Forfeitures are accounted for as they occur.
We have granted to employees RSUs which vest on the satisfaction of both a service-based and a performance-based vesting condition. The RSUs have a service-based vesting condition satisfied over a four-year period. The performance-based vesting condition will be satisfied upon the occurrence of a qualifying liquidation event which is defined as the earlier to occur of (i) an IPO or (ii) a sale event. Awards which contain both service-based and performance-based vesting conditions are recognized using the accelerated attribution method once the performance condition is probable of occurring. As the performance-based vesting condition is not deemed probable until occurrence, no stock-based compensation expense has been recorded to date. RSAs are grants of shares of our common stock that vest in accordance with terms and conditions established by our board of directors. The fair value of RSAs are estimated on the date of grant using based on fair value of the common stock. Stock-based compensation expense is recognized over the vesting term on a straight-line basis, which reflects the service period.
Income Taxes
We apply the provisions of ASC 740, Income Taxes (ASC 740). Under ASC 740, we account for our income taxes using the asset and liability method whereby deferred tax assets and liabilities are determined based on temporary differences between the bases used for financial reporting and income tax reporting purposes. Deferred income taxes are provided based on the enacted tax rates and laws that will be in effect at the time such temporary differences are expected to reverse. A valuation allowance is provided for deferred tax assets if it is more likely than not that we will not realize those tax assets through future operations.
We also utilize the guidance in ASC 740 to account for uncertain tax positions. ASC 740 contains a two-step approach to recognizing and measuring uncertain tax positions. The first step is to evaluate the tax position
F-20
Table of Contents
UIPATH, INC.
Notes to Consolidated Financial Statements
For the years ended January 31, 2020 and 2021
All amounts in USD thousands except share, per share data, and percentages
for recognition by determining if the weight of available evidence indicates it is more likely than not that the position will be sustained on audit, including resolution of related appeals or litigation processes, if any. The second step is to measure the tax benefit as the largest amount which is more likely than not of being realized and effectively settled. We consider many factors when evaluating and estimating its tax positions and tax benefits, which may require periodic adjustments, and which may not accurately reflect actual outcomes.
Our policy is to recognize interest and penalties related to uncertain tax positions as a component of income tax expense or benefit in the consolidated statements of operation. We had no reserves or accruals for uncertain tax position as of January 31, 2021 and, hence, we did not recognize such items in fiscal years 2020 and 2021.
Net Loss Per Share Attributable to Common Stockholders
We compute net loss per share using the two-class method required for participating securities. The two-class method requires income available to common stockholders for the period to be allocated between common stock and participating securities based upon their respective rights to receive dividends as if all income for the period had been distributed. We consider our convertible preferred stock and unvested common stock, which includes early exercised stock options and restricted stock awards, to be participating securities as holders of such securities have non-forfeitable dividend rights in the event of our declaration of a dividend for shares of common stock. These participating securities do not contractually require the holders of such shares to participate in our losses. As such, net loss for the periods presented was not allocated to our participating securities.
Basic and diluted net loss per share is calculated by dividing net loss attributable to common stockholders by the weighted average number of shares of common stock outstanding. Net loss is allocated based on the weighted-average shares outstanding for each class of common stock. As we have net losses for the periods presented, all potentially dilutive common stock, which are comprised of convertible preferred stock, stock options, RSUs, RSAs and early exercised options are anti-dilutive. Diluted net loss per share is calculated by giving effect to all potentially dilutive securities outstanding for the period using the treasury stock method or the if-converted method based on the nature of such securities. Diluted net loss per share is the same as basic net loss per share in periods when the effects of potentially dilutive shares of common stock are anti-dilutive.
Comprehensive Loss
Comprehensive loss consists of net loss and other comprehensive income (loss). Other comprehensive income (loss) reflects gains and losses that are recorded as a component of stockholders deficit and are excluded from net loss. Other comprehensive income (loss) consists of foreign currency translation adjustments related to consolidation of foreign entities and unrealized gains (losses) on marketable securities classified as available-for-sale.
Segments
We operate in one operating segment. Operating segments are defined as components of an enterprise for which separate financial information is evaluated regularly by the chief operating decision maker (CODM), in deciding how to allocate resources and assess performance. Our CODM, who is our chief executive officer (CEO), allocates resources and assesses performance based upon discrete financial information at the consolidated level.
F-21
Table of Contents
UIPATH, INC.
Notes to Consolidated Financial Statements
For the years ended January 31, 2020 and 2021
All amounts in USD thousands except share, per share data, and percentages
Revenue by geographical region can be found in the revenue recognition disclosures in Note 3, Revenue Recognition. The following table presents our property and equipment, net of depreciation and amortization, by geographic region:
| As of January 31, | ||||||||
| 2020 | 2021 | |||||||
| United States |
$ | 10,348 | $ | 7,744 | ||||
| Romania |
6,750 | 5,070 | ||||||
| Rest of world |
3,748 | 2,008 | ||||||
|
|
|
|
|
|||||
| Total property and equipment, net |
$ | 20,846 | $ | 14,822 | ||||
|
|
|
|
|
|||||
Recently Adopted Accounting Pronouncements
As an emerging growth company, the Jumpstart Our Business Startups Act (JOBS Act) allows us to delay adoption of new or revised accounting pronouncements applicable to public companies until such pronouncements are made applicable to private companies. We have elected to use this extended transition period under the JOBS Act. The adoption dates discussed below reflect this election.
In February 2016, the Financial Accounting Standards Board (FASB) issued ASU No. 2016-02, Leases (Topic 842) (ASC 842), and subsequently associated ASUs related to Topic 842, which requires organizations that lease assets to recognize on the balance sheets the assets and liabilities for the rights and obligations created by those leases. The new guidance requires that a lessee recognize assets and liabilities for leases, and recognition, presentation and measurement in the financial statements will depend on its classification as a finance or operating lease. In addition, the new guidance requires disclosures to help investors and other financial statement users better understand the amount, timing and uncertainty of cash flows arising from leases.
We early adopted this guidance as of February 1, 2019, which allows for a modified retrospective transition approach, applying the new standard to all leases existing at the date of initial adoption. An entity may choose to use either (1) its effective date or (2) the beginning of the earliest comparative period presented in the financial statements as its date of initial application. We have elected to apply the transition requirements as of February 1, 2018, the beginning of the earliest comparative period presented. This approach allows for a cumulative effect adjustment recognized at the beginning of the earliest comparative period presented and the comparative periods disclosed are presented as if ASC 842 had always been applied. Upon adoption, we recognized operating lease ROU assets of $3,879 and operating lease liabilities of $4,024 with no impact to accumulated deficit as of February 1, 2018.
As part of the transition, we elected the following practical expedients:
| 1. | Not to reassess whether any expired or existing contracts are or contain leases; |
| 2. | Not to reassess the lease classification for any expired or existing leases; |
| 3. | Not to reassess initial direct costs for any existing leases; |
| 4. | The practical expedient whereby the lease and non-lease components will not be separated for all classes of assets; |
| 5. | Not to record ROU assets and corresponding lease liabilities with a lease term of 12 months or less for all classes of assets; and |
| 6. | Not to apply hindsight in determining the lease term. |
F-22
Table of Contents
UIPATH, INC.
Notes to Consolidated Financial Statements
For the years ended January 31, 2020 and 2021
All amounts in USD thousands except share, per share data, and percentages
See Note 8, Operating Leases, for further details on our operating leases.
In January 2017, the FASB issued ASU No. 2017-04, Intangibles - Goodwill and Other (ASC 350): Simplifying the Test for Goodwill Impairment, which simplifies the measurement of goodwill by eliminating step 2 from the goodwill impairment test. Entities should recognize an impairment charge for the amount by which the carrying amount exceeds the reporting units fair value. We early adopted this guidance effective as of February 1, 2019 and applied the guidance when evaluating goodwill for impairment during fiscal year 2020. The guidance did not have a material impact on our consolidated financial statements.
In August 2018, the FASB issued ASU No. 2018-13, Fair Value Measurement (Topic 820): Disclosure FrameworkChanges to the Disclosure Requirements for Fair Value Measurement, which removes certain disclosure requirements related to the fair value hierarchy, modifies existing disclosure requirements related to measurement uncertainty and adds new disclosure requirements. The new disclosure requirements include disclosing the changes in unrealized gains and losses for the period included in other comprehensive income for recurring Level 3 fair value measurements held at the end of the reporting period and the range and weighted average of significant unobservable inputs used to develop Level 3 fair value measurements. We adopted ASU 2018-13 as of February 1, 2020. The guidance did not have a material impact on our consolidated financial statements.
In August 2018, the FASB issued ASU No. 2018-15, Intangibles - Goodwill and Other-Internal-Use Software (Subtopic 350-40): Customers Accounting for Implementation Costs Incurred in a Cloud Computing Arrangement That is a Service Contract, which aligns the requirements for capitalizing implementation costs incurred in a hosting arrangement that is a service contract with the requirements for capitalizing implementation costs incurred to develop or obtain internal-use software. The new standard requires capitalized costs to be amortized on a straight-line basis generally over the term of the arrangement, and the financial statement presentation for these capitalized costs would be the same as that of the fees related to the hosting arrangements. We early adopted this guidance on a prospective basis effective as of February 1, 2019. The guidance did not have a material impact on our consolidated financial statements.
Recently Issued Accounting Pronouncements
In June 2016, the FASB issued ASU No. 2016-13, Financial Instruments - Credit Losses (Topic 326): Measurement of Credit Losses on Financial Instruments to amend the current accounting guidance which requires the measurement of all expected losses to be based on historical experience, current conditions and reasonable and supportable forecasts. For trade receivables, contract assets, and other financial instruments, we will be required to use a forward-looking expected loss model that reflects probable losses rather than the incurred loss model for recognizing credit losses. The ASU will be effective for us beginning February 1, 2023. Early adoption is permitted. We are currently evaluating the impact of this pronouncement on our consolidated financial statements.
In December 2019, the FASB issued ASU No. 2019-12, Income Taxes (Topic 740): Simplifying the Accounting for Income Taxes, which is intended to simplify various aspects related to accounting for income taxes. The ASU simplifies the accounting for income taxes by removing certain exceptions associated with (i) intraperiod tax allocations, (ii) recognition of deferred tax liability for equity method investments of foreign subsidiaries, and (iii) the calculation of income taxes in an interim period when in a loss position within the framework of ASC 740 and clarifies and amends existing guidance to improve consistent application. The ASU will be effective for us beginning February 1, 2022, and interim periods in fiscal years beginning February 1,
F-23
Table of Contents
UIPATH, INC.
Notes to Consolidated Financial Statements
For the years ended January 31, 2020 and 2021
All amounts in USD thousands except share, per share data, and percentages
2023. We are currently evaluating the impact of this pronouncement on our consolidated financial statements. We do not expect the adoption of this ASU to have a material effect on our consolidated financial statements.
In August 2020, the FASB issued ASU No. 2020-06, DebtDebt with Conversion and Other Options (Subtopic 470-20) and HedgingContracts in Entitys Own Equity (Subtopic 815-40). The standard simplifies accounting for convertible instruments by removing major separation models required under current U.S. GAAP. The ASU removes certain settlement conditions that are required for equity contracts to qualify for the derivative scope exception and it revises the guidance in ASC 260, Earnings Per Share, to require entities to calculate diluted earnings per share for convertible instruments by using the if-converted method. The ASU will be effective for us beginning after February 1, 2022, including interim periods within those fiscal years. We are currently evaluating the impact of this pronouncement on our consolidated financial statements. We do not expect the adoption of this ASU to have a material effect on our consolidated financial statements.
3. Revenue Recognition
Disaggregation of Revenue
The following table summarizes revenue by geographical region:
| Year Ended January 31, | ||||||||||||||||
| 2020 | 2021 | |||||||||||||||
| Amount | Percentage of Revenue |
Amount | Percentage of Revenue |
|||||||||||||
| Americas(1) |
$ | 125,360 | 37 | % | $ | 260,016 | 43 | % | ||||||||
| Europe, Middle East, and Africa |
113,887 | 34 | 187,072 | 31 | ||||||||||||
| Asia-Pacific(1) |
96,909 | 29 | 160,555 | 26 | ||||||||||||
|
|
|
|
|
|
|
|
|
|||||||||
| Total revenue |
$ | 336,156 | 100 | % | $ | 607,643 | 100 | % | ||||||||
|
|
|
|
|
|
|
|
|
|||||||||
| (1) | Revenue from the United States and Japan represented 34% and 17%, 39% and 14% of our total revenue for fiscal years 2020 and 2021, respectively. |
F-24
Table of Contents
UIPATH, INC.
Notes to Consolidated Financial Statements
For the years ended January 31, 2020 and 2021
All amounts in USD thousands except share, per share data, and percentages
Contract Balances
Significant changes in the contract assets and the deferred revenue balances were as follows:
| Year Ended January 31, | ||||||||
| Contract Assets |
2020 | 2021 | ||||||
| Beginning balance |
$ | 6,574 | $ | 12,977 | ||||
| Additions through acquisitions |
2,054 | - | ||||||
| Contract assets recognized during the year |
8,533 | 33,734 | ||||||
| Amounts transferred to accounts receivable from unbilled accounts receivable presented at the beginning of the year |
(3,449 | ) | (11,398 | ) | ||||
| Translation adjustments |
(735 | ) | 993 | |||||
|
|
|
|
|
|||||
| Ending balance |
$ | 12,977 | $ | 36,306 | ||||
|
|
|
|
|
|||||
| Contract assets, current |
$ | 12,855 | $ | 34,221 | ||||
| Contract assets, non-current |
122 | 2,085 | ||||||
|
|
|
|
|
|||||
| Total contract assets |
$ | 12,977 | $ | 36,306 | ||||
|
|
|
|
|
|||||
| Year Ended January 31, | ||||||||
| Deferred Revenue |
2020 | 2021 | ||||||
| Beginning balance |
$ | 70,705 | $ | 165,568 | ||||
| Additions to deferred revenue during the year |
419,604 | 670,797 | ||||||
| Revenue recognized during the year |
(323,179 | ) | (571,337 | ) | ||||
| Translation adjustments |
(1,562 | ) | 7,375 | |||||
|
|
|
|
|
|||||
| Ending balance |
$ | 165,568 | $ | 272,403 | ||||
|
|
|
|
|
|||||
| Deferred revenue, current |
$ | 124,627 | $ | 211,078 | ||||
| Deferred revenue, non-current |
40,941 | 61,325 | ||||||
|
|
|
|
|
|||||
| Total deferred revenue |
$ | 165,568 | $ | 272,403 | ||||
|
|
|
|
|
|||||
Remaining Performance Obligation
Our remaining performance obligations are comprised of license and services revenue not yet delivered. As of January 31, 2021, the aggregate amount of the transaction price allocated to remaining performance obligations was $414,039, which consists of both billed consideration in the amount of $272,403 and unbilled consideration in the amount of $141,636 that we expect to recognize as revenue. We expect to recognize 65% of our remaining performance obligations as revenue in fiscal year 2022, and the remainder thereafter.
F-25
Table of Contents
UIPATH, INC.
Notes to Consolidated Financial Statements
For the years ended January 31, 2020 and 2021
All amounts in USD thousands except share, per share data, and percentages
Deferred Contract Acquisition Costs
The following table represents a rollforward of deferred contract acquisition costs:
| Year Ended January 31, | ||||||||
| 2020 | 2021 | |||||||
| Beginning balance |
$ | 6,948 | $ | 37,254 | ||||
| Additions to deferred contract acquisition costs |
60,756 | 51,058 | ||||||
| Amortization of deferred contract acquisition costs |
(30,450 | ) | (40,997 | ) | ||||
| Reversal of deferred contract acquisition costs due to change in sales incentive plan |
(5,426 | ) | ||||||
| Translation adjustments |
| 1,317 | ||||||
|
|
|
|
|
|||||
| Ending balance |
$ | 37,254 | $ | 43,206 | ||||
|
|
|
|
|
|||||
| Deferred contract acquisition costs, current |
$ | 19,361 | $ | 10,653 | ||||
| Deferred contract acquisition costs, non-current |
17,893 | 32,553 | ||||||
|
|
|
|
|
|||||
| Total deferred contract acquisition costs |
$ | 37,254 | $ | 43,206 | ||||
|
|
|
|
|
|||||
4. Marketable Securities
The following is a summary of our marketable securities as of January 31, 2021:
| As of January 31, 2021 | ||||||||||||||||
| Amortized Cost |
Gross Unrealized Gains |
Gross Unrealized Losses |
Estimated Fair Value |
|||||||||||||
| Commercial paper |
$ | 23,171 | $ | | $ | | $ | 23,171 | ||||||||
| Corporate bonds |
79,674 | 7 | (24 | ) | 79,657 | |||||||||||
|
|
|
|
|
|
|
|
|
|||||||||
| Total marketable securities |
$ | 102,845 | $ | 7 | $ | (24 | ) | $ | 102,828 | |||||||
|
|
|
|
|
|
|
|
|
|||||||||
As of January 31, 2021, the contractual maturities of our marketable securities were all less than one year. Based on the available evidence, we concluded that the gross unrealized losses on the marketable securities as of January 31, 2021 are temporary in nature. To determine whether a decline in value is other-than temporary, we evaluate, among other factors: the duration and extent to which the fair value has been less than the carrying value and our intent and ability to retain the marketable securities for a period of time sufficient to allow for any anticipated recovery in fair value. There were no marketable securities as of January 31, 2020.
F-26
Table of Contents
UIPATH, INC.
Notes to Consolidated Financial Statements
For the years ended January 31, 2020 and 2021
All amounts in USD thousands except share, per share data, and percentages
5. Fair Value Measurement
The following tables present the fair value hierarchy of our financial assets and liabilities measured at fair value on a recurring basis as of January 31, 2020 and 2021:
| As of January 31, 2020 | ||||||||||||||||
| Level 1 | Level 2 | Level 3 | Total | |||||||||||||
| Financial Assets: |
||||||||||||||||
| Money market accounts |
$ | 137,677 | $ | | $ | | $ | 137,677 | ||||||||
|
|
|
|
|
|
|
|
|
|||||||||
| Total cash equivalents |
137,677 | | | 137,677 | ||||||||||||
|
|
|
|
|
|
|
|
|
|||||||||
| Total |
$ | 137,677 | $ | | $ | | $ | 137,677 | ||||||||
|
|
|
|
|
|
|
|
|
|||||||||
| As of January 31, 2021 | ||||||||||||||||
| Level 1 | Level 2 | Level 3 | Total | |||||||||||||
| Financial Assets: |
||||||||||||||||
| Money market accounts |
$ | 198,523 | $ | | $ | | $ | 198,523 | ||||||||
| Commercial paper |
| 19,999 | | 19,999 | ||||||||||||
| Corporate bonds |
| 1,477 | | 1,477 | ||||||||||||
|
|
|
|
|
|
|
|
|
|||||||||
| Total cash equivalents |
198,523 | 21,476 | | 219,999 | ||||||||||||
|
|
|
|
|
|
|
|
|
|||||||||
| Commercial paper |
$ | | $ | 23,171 | $ | | $ | 23,171 | ||||||||
| Corporate bonds |
| 79,657 | | 79,657 | ||||||||||||
|
|
|
|
|
|
|
|
|
|||||||||
| Total marketable securities |
| 102,828 | | 102,828 | ||||||||||||
|
|
|
|
|
|
|
|
|
|||||||||
| Total |
$ | 198,523 | $ | 124,304 | $ | | $ | 322,827 | ||||||||
|
|
|
|
|
|
|
|
|
|||||||||
| Financial Liabilities: |
||||||||||||||||
| Foreign currency derivative liabilities included in accrued expense and other current liabilities |
$ | | $ | 571 | $ | | $ | 571 | ||||||||
|
|
|
|
|
|
|
|
|
|||||||||
| Total |
$ | | $ | 571 | $ | | $ | 571 | ||||||||
|
|
|
|
|
|
|
|
|
|||||||||
Our cash equivalents are classified within Level 1 of the fair value hierarchy because they are valued based on quoted market prices in active markets. We classify commercial paper, corporate bonds, and derivative financial instruments within Level 2 because they are valued using inputs other than quoted prices which are directly or indirectly observable in the market, including readily-available pricing sources for the identical underlying security which may not be actively traded. Our derivative financial instruments consist principally of foreign currency forward contracts and are carried at fair value based on significant observable inputs. As such, they are classified within Level 2 of the fair value hierarchy. There were no financial instruments in the Level 3 category as of January 31, 2020 and January 31, 2021.
6. Business Acquisitions
We made two acquisitions in fiscal year 2020 which were accounted for as business acquisitions. The financial results of the acquired companies are included in our consolidated financial statements from their respective acquisition dates, and the results from each of these companies were not individually material to our consolidated financial statements. As a result, pro forma results of operations for these acquisitions have not been
F-27
Table of Contents
UIPATH, INC.
Notes to Consolidated Financial Statements
For the years ended January 31, 2020 and 2021
All amounts in USD thousands except share, per share data, and percentages
presented. In the aggregate, the total purchase price for these acquisitions was $37,188 in cash. We recorded $12,375 of identifiable intangible assets, based on their estimated fair values, and $25,086 of goodwill.
StepShot
On May 22, 2019, we acquired StepShot OÜ, a leading provider of process documentation software, for $1,000 in cash and $1,000 in deferred consideration which was paid in May 2020. We expect this acquisition to accelerate customers automation journeys by enabling them to quickly and easily record, document, and share processes as well as automate key steps in robot creation. We recorded goodwill of $1,100, none of which is deductible for tax purposes, and the acquisition costs incurred in connection with the acquisition were immaterial.
ProcessGold
On October 3, 2019, we acquired 100% of the share capital of ProcessGold AG, a leading process mining vendor based in the Netherlands. The total consideration was $35,188 and consisted of $17,976 in cash paid at closing and $17,212 to be paid within a year. Such amount was held back as security for potential claims under warranties and specific indemnities. In October 2020, the final payment, adjusted for currency movements, of $18,690 was made. Through this acquisition, we expect to offer customers a solution that brings together both process mining and RPA capabilities.
The following table summarizes the allocation of the purchase price at fair value:
| Fair Value Amount | ||||
| Intangible assets |
$ | 11,475 | ||
| Goodwill |
23,986 | |||
| Net assets acquired |
2,286 | |||
| Net liabilities assumed |
(2,559 | ) | ||
|
|
|
|||
| Total fair value of net assets acquired |
$ | 35,188 | ||
|
|
|
|||
Goodwill was primarily attributed to the assembled workforce and expanded market opportunities. The fair values assigned to tangible assets acquired and liabilities assumed are based on managements estimates and assumptions.
The following table sets forth the components of identifiable intangible assets acquired, which are Level 3 fair value measurements, and their estimated useful lives as of the date of acquisition:
| Fair Value | Useful Life (Years) | |||||||
| Developed technology |
$ | 10,910 | 5 | |||||
| Trade names and trademarks |
66 | 3 | ||||||
| Customer relationships |
499 | 5 | ||||||
|
|
|
|||||||
| Total identifiable intangible assets |
$ | 11,475 | ||||||
|
|
|
|||||||
Developed technology represents the estimated fair value of ProcessGolds process mining technologies. Customer relationships represent the estimated fair values of the underlying relationships with ProcessGold customers. Transaction costs associated with the acquisition were $550 and are recorded in general and administrative expense in the consolidated statements of operations for fiscal year 2020.
F-28
Table of Contents
UIPATH, INC.
Notes to Consolidated Financial Statements
For the years ended January 31, 2020 and 2021
All amounts in USD thousands except share, per share data, and percentages
7. Intangible Assets and Goodwill
Intangible Assets, Net
Intangible assets, net consisted of the following as of January 31, 2020:
| Intangible Assets, Gross |
Accumulated Amortization |
Intangible Assets, Net |
Weighted-Average Remaining Useful Life (Years) |
|||||||||||||
| Developed technology |
$ | 11,906 | $ | (669 | ) | $ | 11,237 | 4.7 | ||||||||
| Trade names and trademarks |
66 | (6 | ) | 60 | 2.8 | |||||||||||
| Customer relationships |
504 | (25 | ) | 479 | 4.8 | |||||||||||
|
|
|
|
|
|
|
|||||||||||
| Total |
$ | 12,476 | $ | (700 | ) | $ | 11,776 | |||||||||
|
|
|
|
|
|
|
|||||||||||
Intangible assets, net consisted of the following as of January 31, 2021:
| Intangible Assets, Gross |
Accumulated Amortization |
Intangible Assets, Net |
Weighted-Average Remaining Useful Life (Years) |
|||||||||||||
| Developed technology |
$ | 13,083 | $ | (3,350 | ) | $ | 9,733 | 3.7 | ||||||||
| Trade names and trademarks |
66 | (24 | ) | 42 | 1.8 | |||||||||||
| Customer relationships |
527 | (111 | ) | 416 | 3.8 | |||||||||||
|
|
|
|
|
|
|
|||||||||||
| Total |
$ | 13,676 | $ | (3,485 | ) | $ | 10,191 | |||||||||
|
|
|
|
|
|
|
|||||||||||
We record amortization expense associated with developed technology in cost of licenses revenue, trade names and trademarks in sales and marketing expense, and customer relationships in sales and marketing expense in the consolidated statements of operations. Amortization expense of intangible assets were $700 and $2,608 for fiscal years 2020 and 2021, respectively.
The expected future amortization expenses related to intangible assets as of January 31, 2021 were as follows:
| Year Ended January 31, |
Amount | |||
| 2022 |
$ | 2,738 | ||
| 2023 |
2,732 | |||
| 2024 |
2,714 | |||
| 2025 |
2,007 | |||
|
|
|
|||
| Total |
$ | 10,191 | ||
|
|
|
|||
F-29
Table of Contents
UIPATH, INC.
Notes to Consolidated Financial Statements
For the years ended January 31, 2020 and 2021
All amounts in USD thousands except share, per share data, and percentages
Goodwill
The changes in the carrying amounts of goodwill, which is not deductible for tax purposes, were as follows:
| Carrying Amount | ||||
| Balance as of January 31, 2019 |
$ | | ||
| Additions from acquisition |
25,086 | |||
| Effect of foreign currency translation |
225 | |||
|
|
|
|||
| Balance as of January 31, 2020 |
$ | 25,311 | ||
| Effect of foreign currency translation |
2,748 | |||
|
|
|
|||
| Balance as of January 31, 2021 |
$ | 28,059 | ||
|
|
|
|||
8. Operating Leases
Our operating leases consist of real estate and vehicles. Our operating leases have remaining lease terms of one to eight years. For purposes of calculating operating lease liabilities, lease terms may be deemed to include options to extend the lease when it is reasonably certain that we will exercise those options. Our operating lease arrangements do not contain any material restrictive covenants or residual value guarantees.
The components of lease cost for operating leases was as follows for the periods presented:
| Year Ended January 31, | ||||||||
| 2020 | 2021 | |||||||
| Operating lease cost |
$ | 7,019 | $ | 7,266 | ||||
| Short-term lease cost |
12,706 | 8,853 | ||||||
| Variable lease cost |
1,163 | 735 | ||||||
|
|
|
|
|
|||||
| Total lease cost |
$ | 20,888 | $ | 16,854 | ||||
|
|
|
|
|
|||||
The following is supplemental balance sheets information:
| As of January 31, | ||||||||
| 2020 | 2021 | |||||||
| Reported as: |
||||||||
| Assets: |
||||||||
| Operating lease ROU assets |
$ | 22,737 | $ | 17,260 | ||||
|
|
|
|
|
|||||
| Liabilities: |
||||||||
| Accrued expenses and other current liabilities |
$ | 5,860 | $ | 5,924 | ||||
| Operating lease liabilities, non-current |
20,391 | 14,152 | ||||||
|
|
|
|
|
|||||
| Total operating lease liabilities |
$ | 26,251 | $ | 20,076 | ||||
|
|
|
|
|
|||||
F-30
Table of Contents
UIPATH, INC.
Notes to Consolidated Financial Statements
For the years ended January 31, 2020 and 2021
All amounts in USD thousands except share, per share data, and percentages
Supplemental cash flow information related to operating leases was as follows for the periods presented:
| Year Ended January 31, | ||||||||
| 2020 | 2021 | |||||||
| Cash paid for amounts included in the measurement of operating lease liabilities |
$ | 5,183 | $ | 7,741 | ||||
|
|
|
|
|
|||||
| Operating lease ROU assets obtained in exchange for new operating lease liabilities |
$ | 9,932 | $ | 126 | ||||
|
|
|
|
|
|||||
The following table represents the weighted-average remaining lease term and discount rate for the periods presented:
| Year Ended January 31, | ||||||||
| 2020 | 2021 | |||||||
| Weighted average remaining lease term (years) |
4.5 | 3.8 | ||||||
|
|
|
|
|
|||||
| Weighted average discount rate |
7.0 | % | 8.1 | % | ||||
|
|
|
|
|
|||||
Future undiscounted lease payments for our operating lease liabilities as of January 31, 2021 were as follows:
| Amount | ||||
| Year Ended January 31, |
||||
| 2022 |
$ | 7,280 | ||
| 2023 |
6,891 | |||
| 2024 |
4,704 | |||
| 2025 |
1,724 | |||
| 2026 |
753 | |||
| Thereafter |
2,007 | |||
|
|
|
|||
| Total operating lease payments |
23,359 | |||
| Less: imputed interest |
(3,283 | ) | ||
|
|
|
|||
| Total operating lease liabilities |
$ | 20,076 | ||
|
|
|
|||
9. Consolidated Balance Sheet Components
Prepaid Expenses and Other Current Assets
Prepaid expenses and other current assets consist of the following:
| As of January 31, | ||||||||
| 2020 | 2021 | |||||||
| Prepaid expenses |
$ | 18,337 | $ | 21,302 | ||||
| Value-added taxes receivable |
8,106 | 7,178 | ||||||
| Other receivables |
4,345 | 4,002 | ||||||
| Supplier advances |
10,837 | 17,270 | ||||||
|
|
|
|
|
|||||
| Prepaid expenses and other current assets |
$ | 41,625 | $ | 49,752 | ||||
|
|
|
|
|
|||||
F-31
Table of Contents
UIPATH, INC.
Notes to Consolidated Financial Statements
For the years ended January 31, 2020 and 2021
All amounts in USD thousands except share, per share data, and percentages
Property and Equipment, Net
Property and equipment consist of the following:
| As of January 31, | ||||||||
| 2020 | 2021 | |||||||
| Computers and equipment |
$ | 14,348 | $ | 16,408 | ||||
| Leasehold improvements |
10,621 | 10,711 | ||||||
| Furniture and fixtures |
5,602 | 5,590 | ||||||
| Other |
718 | 177 | ||||||
|
|
|
|
|
|||||
| Property and equipment, gross |
31,289 | 32,886 | ||||||
| Less: accumulated depreciation and amortization |
(10,443 | ) | (18,064 | ) | ||||
|
|
|
|
|
|||||
| Property and equipment, net |
$ | 20,846 | $ | 14,822 | ||||
|
|
|
|
|
|||||
Depreciation and amortization expense was $7,615 and $8,387 for fiscal years 2020 and 2021, respectively.
Accrued Expenses and Other Current Liabilities
Accrued expenses and other current liabilities consist of the following:
| As of January 31, | ||||||||
| 2020 | 2021 | |||||||
| Accrued expenses |
$ | 8,570 | $ | 11,955 | ||||
| Payroll taxes payable |
4,846 | 2,035 | ||||||
| Income tax payable |
2,693 | 4,022 | ||||||
| Value-added taxes payable |
4,034 | 8,945 | ||||||
| Accrued restructuring costs |
642 | | ||||||
| Operating lease liabilities, current |
5,860 | 5,924 | ||||||
| Other |
5,670 | 3,779 | ||||||
|
|
|
|
|
|||||
| Accrued expenses and other current liabilities |
$ | 32,315 | $ | 36,660 | ||||
|
|
|
|
|
|||||
10. Credit Agreement
On August 13, 2019, we entered into a two-year $50,000 senior secured revolving credit agreement (the Credit Agreement) with HSBC Ventures USA Inc. It was subsequently amended and restated on January 14, 2020 to include Silicon Valley Bank as a lender, and to increase the available credit limit to $100,000. Commercial terms and maturity remained unchanged with the original Credit Agreement. We could use borrowings to finance working capital needs and for general corporate purposes. The Credit Agreement contained customary covenants, including, but not limited to, those relating to additional indebtedness, liens, asset divestitures, and affiliate transactions. We were also required to comply with one financial covenant that consisted of an adjusted quick ratio of 1.5.
On October 30, 2020, we entered into a Senior Secured Credit Facility (Credit Facility) with HSBC Ventures USA Inc., Silicon Valley Bank, Sumitomo Mitsui Banking Corporation, and Mizuho Bank, LTD. The Credit Facility replaced the Credit Agreement presented above and the substantive changes from the original Credit Agreement include a credit limit of $200,000, an extension of maturity to October 30, 2023 and the
F-32
Table of Contents
UIPATH, INC.
Notes to Consolidated Financial Statements
For the years ended January 31, 2020 and 2021
All amounts in USD thousands except share, per share data, and percentages
removal of certain financial covenants. The Credit Facility contains certain customary covenants, including, but not limited to, those relating to additional indebtedness, liens, asset divestitures, and affiliate transactions. We may use the proceeds of future borrowings under the Credit Facility for refinancing other indebtedness, working capital, capital expenditures and other general corporate purposes, including permitted business acquisitions. Our obligations under the Credit Facility are secured by substantially all of our assets, except for our intellectual property.
As of January 31, 2021, we were in compliance with the financial covenant and we had no drawn indebtedness under the Credit Agreement.
11. Commitments and Contingencies
Letters of Credit
We had a total of $22,562 letters of credit outstanding in favor of certain landlords for office space, credit line facilities, and retained amounts in relation to the business acquisitions in fiscal year 2020 as of January 31, 2020 and $4,142 letters of credit outstanding in favor of certain landlords for office space, credit line facilities as of January 31, 2021. These letters of credit renew annually and expire on various dates through fiscal year 2022.
Indemnification
In the ordinary course of business, we may provide indemnification of varying scope and terms to customers, vendors, investors, directors, and officers with respect to certain matters, including, but not limited to, losses arising out of our breach of such agreements, services to be provided by us, or from intellectual property infringement claims made by third parties.
These indemnification provisions may survive termination of the underlying agreement and the maximum potential amount of future payments we could be required to make under these indemnification provisions may not be subject to maximum loss clauses. The maximum potential amount of future payments we could be required to make under these indemnification provisions is indeterminable. As of January 31, 2020 and 2021, we have not accrued a liability for these indemnification arrangements because the likelihood of incurring a payment obligation, if any, in connection with these indemnification arrangements was remote.
F-33
Table of Contents
UIPATH, INC.
Notes to Consolidated Financial Statements
For the years ended January 31, 2020 and 2021
All amounts in USD thousands except share, per share data, and percentages
Workforce Restructuring
On October 24, 2019, we announced a restructuring plan focused on reducing our global workforce. We implemented this restructuring plan through the end of fiscal year 2020 and incurred one-time employee and non-employee termination benefits of $9,942 relating to workforce reductions. The workforce reductions were from all functional areas of our operations. The following table shows the total amount incurred and the liability, which is recorded in accrued expenses and other liabilities in the consolidated balance sheets, related to the restructuring as of January 31, 2020 and 2021:
| One-Time Employee Termination Benefits |
||||
| Accrued restructuring costs as of January 31, 2019 |
$ | | ||
| Restructuring charges incurred during the period |
9,942 | |||
| Amount paid during the period |
9,300 | |||
|
|
|
|||
| Accrued restructuring costs as of January 31, 2020 |
$ | 642 | ||
| Amount paid during the period |
642 | |||
|
|
|
|||
| Accrued restructuring costs as of January 31, 2021 |
$ | | ||
|
|
|
|||
The following table shows the restructuring charges incurred during fiscal year 2020:
| Year Ended January 31, 2020 |
||||
| Cost of maintenance and support revenue |
$ | 514 | ||
| Cost of services and other revenue |
396 | |||
| Sales and marketing |
6,568 | |||
| Research and development |
511 | |||
| General and administrative |
1,953 | |||
|
|
|
|||
| Total |
$ | 9,942 | ||
|
|
|
|||
In addition, we concluded that, as a result of our restructuring plan, the carrying amount of our Houston office, including operating lease ROU assets, leasehold improvements, and furniture and fixtures exceeded its estimated fair value. We recorded an impairment loss of $1,026 which was recorded in general and administrative expense in the consolidated statements of operations for fiscal year 2020. The restructuring plan was completed as of January 31, 2020.
Defined Contribution Plans
We sponsor defined contribution plans for qualifying employees, including a 401(k) plan in the United States to which we make matching contributions (the 401(k) Plan). We have contracted with a third-party provider to act as a custodian and trustee, and to process and maintain the records of participant data. Substantially all the expenses incurred for administering the 401(k) Plan are paid by us. The 401(k) Plan covers substantially all employees who meet minimum age and service requirements and allows participants to defer a portion of their annual compensation on a pre-tax basis. We make matching contributions of 50% of the participating employee contributions to the plan up to 6% of the employees eligible compensation. Our total matching contributions for the 401(k) Plan during fiscal years 2020 and 2021 were $5,493 and $5,076, respectively.
F-34
Table of Contents
UIPATH, INC.
Notes to Consolidated Financial Statements
For the years ended January 31, 2020 and 2021
All amounts in USD thousands except share, per share data, and percentages
Litigation
From time to time, we may be involved in lawsuits, claims, investigations, and proceedings, consisting of intellectual property, commercial, employment, and other matters, which arise in the ordinary course of business. In accordance with ASC 450, Contingencies, we make a provision for a liability when it is both probable that a liability has been incurred and the amount of the loss can be reasonably estimated.
We are not presently a party to any litigation the outcome of which, we believe, if determined adversely to us, would individually or taken together have a material adverse effect on our business, operating results, cash flows or financial condition. We have determined that the existence of a material loss is neither probable nor reasonably possible.
Warranty
We warrant to customers that our platform will operate substantially in accordance with its specifications. Historically, no significant costs have been incurred related to product warranties and the probability of incurring such costs in the future is deemed remote. As such, no accruals for product warranty costs have been made.
Other Commitments
Certain executives employment agreements contain provisions providing for severance upon termination.
During fiscal years 2020 and 2021, we granted cash bonuses to certain employees. Due to the growth in the fair value of our common stock combined with the timing between when certain employees began employment with us and the date that their stock options were granted, the actual exercise price of the grants made to certain employees was higher than what was in effect at the time of their hire. In order to compensate the individuals for the increased exercise price, we have granted long-term incentive awards consisting of cash payments equal to the difference between the exercise price in effect at the hire date of these employees and the actual granted exercise price multiplied by the number of shares of common stock subject to the stock options granted. Long-term incentive award payments are made in four equal, annual installments, subject to continued employment. In the event an employee terminates prior to the final payment date, payments will be adjusted pro-rata based on the employees service period. The vesting schedule of the long-term incentive awards mirror the vesting schedule of the stock options that were granted in connection with each individuals employment. The first installment was paid in fiscal year 2020 of $4,650 and the second installment was paid in fiscal year 2021 of $4,700, and each was recorded in the same line item in the consolidated statements of operations associated with other compensation expenses incurred with respect to each employee who received a bonus. We have accrued $1,985 and $890 under accrued expenses and other current liabilities in the consolidated balance sheets and have additional commitments to these employees of $8,117 and $3,417 as of January 31, 2020 and 2021, respectively.
F-35
Table of Contents
UIPATH, INC.
Notes to Consolidated Financial Statements
For the years ended January 31, 2020 and 2021
All amounts in USD thousands except share, per share data, and percentages
Non-Cancelable Purchase Obligations
In the normal course of business, we enter into non-cancelable purchase commitments with various parties for mainly hosting services, as well as software products and services. As of January 31, 2021, we had outstanding non-cancelable purchase obligations with a term of 12-months or longer as follows:
| Year Ended January 31, |
Amount | |||
| 2022 |
$ | 9,542 | ||
| 2023 |
9,840 | |||
| 2024 |
5,466 | |||
| 2025 |
430 | |||
|
|
|
|||
| Total |
$ | 25,278 | ||
|
|
|
|||
12. Capitalization
Convertible Preferred Stock
In April 2019, we issued to certain investors 33,525,105 shares of Series D-1 convertible preferred stock and 9,822,450 shares of Series D-2 convertible preferred stock, both at a purchase price of $13.12 per share, for an aggregate purchase price of $568,600. Issuance costs were $557.
In July 2019, we issued an additional 979,119 shares of Series D-1 convertible preferred stock and 164,412 shares of Series D-2 convertible preferred stock, both at a purchase price of $13.12 per share, for an aggregate purchase price of approximately $15,000. Issuance costs were $34.
In July 2020, we issued to certain investors 12,149,646 shares of Series E convertible preferred stock at a purchase price of $18.59 per share, for an aggregate purchase price of $225,903. Issuance costs were $324.
Convertible preferred stock consisted of the following as of January 31, 2020:
| Series of Convertible Preferred Stock |
Shares Authorized |
Shares Issued and Outstanding |
Original Issue Price per Share |
Carrying Value Net of Issuance Costs |
Aggregate Liquidation Preference |
|||||||||||||||
| A-1 |
96,825,090 | 96,825,090 | $ | 0.31 | $ | 29,523 | $ | 29,633 | ||||||||||||
| A-2 |
48,000,000 | 48,000,000 | 0.03 | 1,600 | 1,600 | |||||||||||||||
| B-1 |
43,734,270 | 43,734,270 | 2.70 | 117,592 | 118,000 | |||||||||||||||
| B-2 |
12,972,030 | 12,972,030 | 2.70 | 34,880 | 35,000 | |||||||||||||||
| C-1 |
19,625,772 | 19,625,772 | 6.38 | 124,969 | 125,200 | |||||||||||||||
| C-2 |
16,459,311 | 16,459,311 | 6.38 | 104,816 | 105,000 | |||||||||||||||
| D-1 |
34,504,224 | 34,504,224 | 13.12 | 452,140 | 452,600 | |||||||||||||||
| D-2 |
9,986,862 | 9,986,862 | $ | 13.12 | 130,869 | 131,000 | ||||||||||||||
|
|
|
|
|
|
|
|
|
|||||||||||||
| Total |
282,107,559 | 282,107,559 | $ | 996,389 | $ | 998,033 | ||||||||||||||
|
|
|
|
|
|
|
|
|
|||||||||||||
F-36
Table of Contents
UIPATH, INC.
Notes to Consolidated Financial Statements
For the years ended January 31, 2020 and 2021
All amounts in USD thousands except share, per share data, and percentages
Convertible preferred stock consisted of the following as of January 31, 2021:
| Series of Convertible Preferred Stock |
Shares Authorized |
Shares Issued and Outstanding |
Original Issue Price per Share |
Carrying Value Net of Issuance Costs |
Aggregate Liquidation Preference |
|||||||||||||||
| A-1 |
96,825,090 | 96,825,090 | $ | 0.31 | $ | 29,523 | $ | 29,633 | ||||||||||||
| A-2 |
48,000,000 | 48,000,000 | 0.03 | 1,600 | 1,600 | |||||||||||||||
| B-1 |
43,734,270 | 43,734,270 | 2.70 | 117,592 | 118,000 | |||||||||||||||
| B-2 |
12,972,030 | 12,972,030 | 2.70 | 34,880 | 35,000 | |||||||||||||||
| C-1 |
19,625,772 | 19,625,772 | 6.38 | 124,969 | 125,200 | |||||||||||||||
| C-2 |
16,459,311 | 16,459,311 | 6.38 | 104,816 | 105,000 | |||||||||||||||
| D-1 |
34,504,224 | 34,504,224 | 13.12 | 452,140 | 452,600 | |||||||||||||||
| D-2 |
9,986,862 | 9,986,862 | 13.12 | 130,869 | 131,000 | |||||||||||||||
| E |
15,865,794 | 12,149,646 | $ | 18.59 | 225,579 | 225,903 | ||||||||||||||
|
|
|
|
|
|
|
|
|
|||||||||||||
| Total |
297,973,353 | 294,257,205 | $ | 1,221,968 | $ | 1,223,936 | ||||||||||||||
|
|
|
|
|
|
|
|
|
|||||||||||||
The principle rights, privileges, and preferences of the Series A-1, Series A-2, Series B-1, Series B-2, Series C-1, Series C-2, Series D-1, Series D-2, and Series E convertible preferred stock are as follows:
Dividends
Holders of Series A-1, A-2, B-1, C-1, D-1, and E convertible preferred stock (collectively referred to as Senior Convertible Preferred Stock) are entitled to receive a dividend on each outstanding share of Series A-1 convertible preferred stock in an amount equal to $0.02448 per annum per share, on each outstanding share of Series A-2 convertible preferred stock in an amount equal to $0.00266 per annum per share, on each outstanding share of Series B-1 convertible preferred stock in an amount equal to $0.21584 per annum per share, on each outstanding share of Series C-1 convertible preferred stock in an amount equal to $0.51034 per annum per share, on each outstanding share of Series D-1 convertible preferred stock in an amount equal to $1.04936 per annum per share, and on each outstanding share of Series E convertible preferred stock in an amount equal to $1.48745 per annum per share, when and if declared by our board of directors, prior and in preference to the payment of dividends or distributions (other than stock dividends payable in common shares or securities/rights convertible into common shares of us) on the shares of common stock, Series B-2, C-2 and D-2 convertible preferred stock (Junior Convertible Preferred Stock). Any such dividends would be noncumulative. After payment of any such dividends to the holders of Senior Convertible Preferred Stock, holders of Junior Convertible Preferred Stock are entitled to receive, a dividend on each outstanding share of Series B-2 convertible preferred stock in an amount equal to $0.21584 per annum per share, on each outstanding share of Series C-2 convertible preferred stock in an amount equal to $0.51034 per annum per share, on each outstanding share of Series D-2 convertible preferred stock in an amount equal to $1.04936 per annum per share, when and if declared by the board of directors, prior and in preference to the payment of any dividend or distribution on the shares of common stock. Any such dividends would likewise be noncumulative. After payment of any such dividends to the holders of convertible preferred stock, as contemplated above, any additional dividends or distributions would be distributed among all holders of common stock and convertible preferred stock on an as-converted basis.
The convertible preferred stock dividend preference may be waived by the consent or approval of the holders of at least 70% of the shares of convertible preferred stock then outstanding (Preferred Majority). No dividends have been declared by the board of directors from inception through January 31, 2021.
F-37
Table of Contents
UIPATH, INC.
Notes to Consolidated Financial Statements
For the years ended January 31, 2020 and 2021
All amounts in USD thousands except share, per share data, and percentages
Voting
The holder of each share of convertible preferred stock is entitled to the number of votes equal to the number of shares of convertible preferred stock held by such holder as of the record date for determining stockholders entitled to vote. Except as provided by law and with respect to the election of directors by the separate class vote of the holders of common stock, the holders of convertible preferred stock are entitled to vote on an as-converted basis, together with the holders of common stock as a single class, on any matter on which the holders of common stock have the right to vote. As of January 31, 2021, each share of Class B common stock was entitled to approximately 5.98 votes per share. The resulting voting power of all shares of Class B common stock, 661,707,918 total votes, represented approximately sixty four percent (64%) of our voting power as of such date. As of January 31, 2021, the holders of the shares of Series A-1 and A-2 convertible preferred stock were entitled to elect two directors, the holders of the shares of Series B-1 and B-2 convertible preferred stock were entitled to elect one director, the holders of the shares of common stock were entitled to elect two directors, and the holders of the shares of common stock and convertible preferred stock, voting together as a single class, were entitled to elect the remaining number of directors.
Redemption
Our Restated Certificate of Incorporation does not contain any date-specific redemption rights for holders of convertible preferred stock. However, certain redemption provisions do apply following certain Deemed Liquidation Events, which are considered contingent redemption provisions that are not solely within our control. Accordingly, the convertible preferred stock has been presented outside of permanent equity in the mezzanine section of the consolidated balance sheets.
Liquidation
A liquidation event is a voluntary or involuntary liquidation, dissolution, or winding-up of the Company. Deemed liquidation events (Deemed Liquidation Events) include change in control transactions, or the sale, lease, exclusive license, or other disposition of all or substantially all of our assets. In the event of a Deemed Liquidation Event, first, the holders of the Senior Convertible Preferred Stock (as defined in our Restated Certificate of Incorporation) are entitled to receive, on a pari passu basis and prior and in preference to any distribution of the proceeds or assets of us to the holders of Junior Convertible Preferred Stock (as defined in our Restated Certificate of Incorporation) and common stock, an amount per share equal to the sum of the original issue price of each such series of Senior Convertible Preferred Stock (as stated in the table above) and any declared but unpaid dividends on such shares. If the proceeds distributed amongst the holders of the Senior Convertible Preferred Stock are insufficient to permit full payment of the previously mentioned liquidation preferences, then the entire proceeds legally available for distribution are to be distributed ratably amongst the holders of such shares of Senior Convertible Preferred Stock in proportion to the full preferential amount that each such holder is otherwise entitled to receive.
Second, preferential payout will be made to the holders of the Junior Convertible Preferred Stock, on a pari passu basis and prior and in preference to any distribution of the proceeds or assets of us to the holders of common stock, in an amount per share equal to the sum of the original issue price of each such series of Junior Convertible Preferred Stock (as stated in the table above) and any declared but unpaid dividends on such shares. If the proceeds distributed amongst the holders of Junior Convertible Preferred Stock, after payment in full of the preferential payments made to the holders of Senior Convertible Preferred Stock discussed above, are insufficient
F-38
Table of Contents
UIPATH, INC.
Notes to Consolidated Financial Statements
For the years ended January 31, 2020 and 2021
All amounts in USD thousands except share, per share data, and percentages
to permit full payment of the previously mentioned liquidation preference of the Junior Convertible Preferred Stock, then the entire remaining proceeds legally available for distribution are to be distributed ratably amongst the holders of the Junior Convertible Preferred Stock in proportion to the full preferential amount that each such holder is otherwise entitled to receive.
Finally, if proceeds remain after the convertible preferred stockholders have received their preferential payments as mentioned above, all remaining proceeds are distributed to the holders of common stock pro rata based on the number of shares of common stock held by such holders. However, if a holder of any series of convertible preferred stock would receive a larger amount of proceeds from a Deemed Liquidation Event on an as-converted to Class A common stock basis than the aforementioned liquidation preference, then such holders shares of any such series of convertible preferred stock shall be deemed to be converted to Class A common stock immediately prior to such Deemed Liquidation Event without any action of such holder, in lieu of receiving the smaller liquidation preference amount.
Conversion
Each share of convertible preferred stock is convertible at the option of the holder without payment of additional consideration at any time into Class A common stock at a rate determined by dividing the original issue price applicable to a series of convertible preferred stock by the conversion price applicable to such series of convertible preferred stock (the Conversion Rate). The initial conversion price per share for each series of convertible preferred stock is equal to the original issue price for such series (i.e., 1:1 conversion).
Each share of convertible preferred stock will automatically convert into shares of Class A common stock at the then applicable Conversion Rate upon the earlier to occur of (a) our sale of Class A common stock in an IPO, the price of which is at least equal to the original issue price per share for the Series D convertible preferred stock, and that results in at least $75 million of proceeds in the aggregate (net of underwriting discounts and commissions) (a Qualified Public Offering), (b) the date specified by vote or written consent of the Preferred Majority, or (c) on the business day immediately prior to the first trading day with respect to our initial listing of Class A common stock for trading on the Nasdaq Stock Market, the New York Stock Exchange or another exchange or marketplace approved by our board of directors.
If the mandatory conversion is effected under clause b above pursuant to a Deemed Liquidation Event in which the per share proceeds payable to the holders of each share of (a) Series C-1 convertible preferred stock or Series C-2 convertible preferred stock (together, Series C convertible preferred stock), (b) Series D-1 convertible preferred stock or Series D-2 convertible preferred stock (together, Series D convertible preferred stock), or (c) Series E convertible preferred stock, in either case, by reason of their ownership thereof and on an as-converted basis would be less than the original issue price per share for the Series C convertible preferred stock, Series D convertible preferred stock or Series E convertible preferred stock, as applicable, such shares of Series C convertible preferred stock, Series D convertible preferred stock or Series E convertible preferred stock, as applicable, shall not so convert to Class A common stock without the vote or written consent of the holders of at least 50% of the then outstanding shares of Series C convertible preferred stock voting as a separate series, the holders of at least a majority of the then outstanding shares of Series D convertible preferred stock voting as a separate series, or the holders of at least a majority of the then outstanding shares of Series E convertible preferred stock voting as a separate series, as applicable.
If the mandatory conversion is effected under clause b above pursuant to an IPO that does not constitute a Qualified Public Offering (a Pending IPO) and the per share offering price set forth in the final prospectus for
F-39
Table of Contents
UIPATH, INC.
Notes to Consolidated Financial Statements
For the years ended January 31, 2020 and 2021
All amounts in USD thousands except share, per share data, and percentages
such Pending IPO is less than the conversion price then applicable to the Series D convertible preferred stock, then the shares of Series D convertible preferred stock shall convert to Class A common stock based on the applicable Conversion Rate that would take into account any conversion price adjustment resulting from such IPO pursuant to our certificate of incorporation.
In addition, if the mandatory conversion is effected under clause a above in connection with a Qualified Public Offering in which the public offering price per share is less than the conversion price then applicable to the Series E convertible preferred stock, or under clause b above in connection with a Pending IPO in which the per share offering price set forth in the final prospectus for such Pending IPO is less than the conversion price then applicable to the Series E convertible preferred stock, then the shares of Series E convertible preferred stock shall convert to Class A common stock based on the applicable Conversion Rate that would take into account any conversion price adjustment resulting from such IPO pursuant to our certificate of incorporation.
Common Stock
As of January 31, 2020, our authorized capital stock consisted of 686,113,572 shares of common stock, of which 565,200,000 shares were designated as Class A common stock and 120,913,572 shares were designated as Class B common stock. As of January 31, 2021, our authorized capital stock consisted of 696,741,494 shares of common stock, of which 581,000,000 shares were designated as Class A common stock and 115,741,494 shares were designated as Class B common stock. Each share of a Class B common stock is automatically converted into one share of a Class A common stock if the total number of outstanding shares of Class B common stock represents less than 13% of the total number of outstanding shares of common stock, on a fully-diluted basis, and any shares of Class B common stock that are transferred to any person or entity which is outside the control of the current holders of Class B common stock are also converted into Class A common stock on a 1-for-1 basis.
Holders of common stock are entitled to receive dividends whenever funds are legally available and when declared by the board of directors, subject to the priority rights of holders of all series of convertible preferred stock outstanding.
Our Class A common stock reserved for future issuance consisted of the following:
| As of January 31, | ||||||||
| 2020 | 2021 | |||||||
| Convertible preferred stock |
282,107,559 | 297,973,353 | ||||||
| Shares available for grant under 2018 Stock Plan |
24,397,380 | 12,120,485 | ||||||
| Stock options and RSUs issued and outstanding under 2015 and 2018 Stock Plans |
73,694,319 | 57,765,481 | ||||||
| Shares subject to repurchase from RSAs |
| 110,947 | ||||||
| Class B common stock |
115,741,494 | 110,653,498 | ||||||
|
|
|
|
|
|||||
| Total Class A common stock reserved for future issuance |
495,940,752 | 478,623,764 | ||||||
|
|
|
|
|
|||||
Repurchases of Common Stock
In April 2019, in connection with the closing of the sale of the Series D convertible preferred stock, we repurchased from certain employees 4,650,372 shares of our Class A common stock and 5,172,078 shares of our
F-40
Table of Contents
UIPATH, INC.
Notes to Consolidated Financial Statements
For the years ended January 31, 2020 and 2021
All amounts in USD thousands except share, per share data, and percentages
Class B common stock, all at the original Series D convertible preferred stock issuance price, for an aggregate of $128,843. This repurchase was financed by the aforementioned sale of Series D convertible preferred stock. At the close of the transaction, we recorded $63,884 as stock-based compensation expense related to the excess of the selling price per share paid to our employees over the then-assessed fair market value of the common stock. The shares of common stock that we repurchased were retired immediately thereafter.
Tender Offer Transactions
In June 2019, certain investors made a tender offer to purchase shares of Class A common stock from certain of our employees. A total of 3,058,281 shares of Class A common stock were sold in this tender offer by participants at the original Series D convertible preferred stock issuance price, for aggregate gross proceeds to the participants of $40,116. In addition, following the Series D convertible preferred stock financing, certain of our employees sold an aggregate of 6,686,442 shares of Class A common stock to certain investors at the original Series D convertible preferred stock issuance price for an aggregate purchase price of $87,645. We recognized compensation expense of $48,260 in connection with these transactions, related to the excess of the selling price per share paid to the applicable employees over the then-assessed fair market value of the purchased shares.
Secondary Transactions
During fiscal year 2021, certain of our employees sold shares of our Class A and Class B common stock to new and existing investors totaling $197,498 in the aggregate. These arrangements consisted of the sale of an aggregate of 5,617,524 shares at a per share price between $10.00 to $55.00. We recognized $4,983 in compensation expense as a result of these transactions related to the excess of the selling price per share paid to the applicable employees over the then-assessed fair market value of the purchased shares. 4,847,996 shares of Class B common stock were sold in such secondary transactions, and each such share was converted into one share of our Class A common stock at closing.
13. Equity Awards
2015 Stock Plan
In June 2015, we adopted our 2015 Stock Plan (the 2015 Plan). The 2015 Plan was terminated in June 2018 in connection with the adoption of our 2018 Stock Plan (the 2018 Plan). Accordingly, no shares are available for future issuances under the 2015 Plan following the adoption of the 2018 Plan. The 2015 Plan continues to govern outstanding equity awards granted thereunder.
2018 Stock Plan
In June 2018, we adopted the 2018 Plan, which provides for grants of stock-based awards, including RSUs, RSAs, and stock options. As of January 31, 2020 and 2021, there were 83,016,987 and 83,906,712 shares of Class A common stock authorized for issuance under the 2018 Plan, respectively, which includes shares already issued under such plan and shares reserved for issuance pursuant to outstanding stock options, RSUs, and RSAs. The total number of shares that remained available for grant under the 2018 Plan as of January 31, 2020 and 2021 was 24,397,380 and 12,120,485, respectively.
F-41
Table of Contents
UIPATH, INC.
Notes to Consolidated Financial Statements
For the years ended January 31, 2020 and 2021
All amounts in USD thousands except share, per share data, and percentages
Stock Options
Stock options generally vest over four years and expire ten years from the date of grant. Vested stock options generally expire three months after termination of employment. Stock option activity during fiscal years 2020 and 2021 consisted of the following:
| Options Outstanding | ||||||||||||||||
| Outstanding Stock Options |
Weighted-Average Exercise Price |
Weighted-Average Remaining Contractual Life (Years) |
Aggregate Intrinsic Value |
|||||||||||||
| Balance as of January 31, 2019 |
49,546,830 | $ | 0.19 | 8.5 | $ | 165,076 | ||||||||||
| Granted |
21,383,586 | $ | 3.28 | |||||||||||||
| Exercised |
(18,971,364 | ) | $ | 0.21 | $ | 92,714 | ||||||||||
| Cancelled/Forfeited/Expired |
(4,682,646 | ) | $ | 3.61 | ||||||||||||
|
|
|
|||||||||||||||
| Balance as of January 31, 2020 |
47,276,406 | $ | 1.25 | 8.2 | $ | 262,248 | ||||||||||
| Granted |
14,580,275 | $ | 4.14 | |||||||||||||
| Exercised |
(28,084,700 | ) | $ | 0.96 | $ | 839,009 | ||||||||||
| Cancelled/Forfeited/Expired |
(10,759,283 | ) | $ | 5.20 | ||||||||||||
|
|
|
|||||||||||||||
| Balance as of January 31, 2021 |
23,012,698 | $ | 1.58 | 7.9 | $ | 1,207,831 | ||||||||||
|
|
|
|||||||||||||||
| Vested and exercisable as of January 31, 2021 |
9,169,946 | $ | 0.94 | 7.3 | $ | 486,966 | ||||||||||
|
|
|
|||||||||||||||
The weighted-average grant date fair value of stock options granted during fiscal years 2020 and 2021 were $3.76 and $17.45 per share, respectively. The total grant date fair value of stock options vested during fiscal years 2020 and 2021 were $24,483 and $68,600, respectively.
During fiscal years 2020 and 2021, our compensation committee approved a modification to allow acceleration of the service-based vesting condition of certain employee stock options upon termination. These modifications resulted in accelerated vesting of 117,492 and 296,236 shares of Class A common stock subject to outstanding stock options and incremental compensation expense of $141 and $4,618 were recognized during fiscal years 2020 and 2021, respectively.
In July 2020, we repriced 4,622,577 stock options which had been issued in fiscal years 2020 and 2021 after the Series D convertible preferred stock financing closing date. In conjunction with the modification of these stock options, we recognized incremental compensation expense of approximately $1,599. Expense related to vested shares of $883 was expensed on the repricing date and the remaining amount of $716 related to unvested shares is being amortized over the remaining vesting period of such options.
Future stock-based compensation for unvested stock options granted and outstanding as of January 31, 2021, is $106,337, which is to be recognized over a weighted-average period of 2.53 years.
F-42
Table of Contents
UIPATH, INC.
Notes to Consolidated Financial Statements
For the years ended January 31, 2020 and 2021
All amounts in USD thousands except share, per share data, and percentages
The Black-Scholes assumptions used to value the employee options at the grant dates are as follows:
| Year Ended January 31, | ||||||
| 2020 | 2021 | |||||
| Expected term (years) |
5.0 6.1 | 5.0 6.1 | ||||
| Expected volatility |
40.0% 68.0% | 60.0% 61.1% | ||||
| Risk-free interest rate |
1.3% 2.9% | 0.2% 0.7% | ||||
| Expected dividend yield |
0.0% | 0.0% | ||||
Early Exercised Options
Certain stock option holders have the right to exercise unvested options, subject to a repurchase right held by us at the original exercise price, in the event of voluntary or involuntary termination of employment of the option holders, until the options are fully vested. As of January 31, 2021, there were 2,279,472 shares of unvested stock options that had been early exercised. The cash proceeds received for unvested shares of common stock recorded within accrued expenses and other current and non-current liabilities in the consolidated balance sheets were $5,861 as of January 31, 2021, which will be transferred to additional paid-in capital upon vesting. There was no early exercise as of January 31, 2020.
Restricted Stock Units
RSUs granted under the 2018 Plan generally vest upon satisfaction of both a service-based vesting condition, generally four years, and a performance-based vesting condition on or before the expiration date of such RSUs. RSUs expire seven years from date of grant. RSUs will be forfeited in case of a termination of employment or service before the satisfaction of both the service-based vesting condition and the performance-based vesting condition or, otherwise, in the case of non-satisfaction of either the service-based vesting condition or the performance-based vesting condition.
RSU activity during fiscal years 2020 and 2021 consisted of the following:
| Unvested RSUs | Weighted-Average Grant Date Fair Value Per Share |
|||||||
|
|
|
|||||||
| Unvested as of January 31, 2019 |
6,741,009 | $ | 1.30 | |||||
| Granted |
23,866,182 | $ | 6.23 | |||||
| Vested |
(94,176 | ) | $ | 1.40 | ||||
| Canceled/Forfeited |
(4,095,102 | ) | $ | 4.51 | ||||
|
|
|
|||||||
| Unvested as of January 31, 2020 |
26,417,913 | $ | 5.70 | |||||
| Granted |
10,987,554 | $ | 21.54 | |||||
| Vested |
| $ | | |||||
| Canceled/Forfeited |
(2,652,684 | ) | $ | 9.09 | ||||
|
|
|
|||||||
| Unvested as of January 31, 2021 |
34,752,783 | $ | 10.8 | |||||
|
|
|
|||||||
During fiscal year 2020, our compensation committee approved a modification to allow acceleration of all vesting conditions of certain RSUs. The modification resulted in accelerated vesting of 94,176 RSUs and incremental compensation expenses of $833 was recognized during fiscal year 2020.
Additionally, during fiscal years 2020 and 2021, 1,233,177 and 193,823 RSUs, respectively, were modified to accelerate their service-based vesting condition and allow employees to not forfeit their RSUs upon termination of the service condition they had completed. The performance-based vesting condition for these
F-43
Table of Contents
UIPATH, INC.
Notes to Consolidated Financial Statements
For the years ended January 31, 2020 and 2021
All amounts in USD thousands except share, per share data, and percentages
RSUs remains unsatisfied at January 31, 2021 and no stock-based compensation expense was recognized for the remaining RSUs as the likelihood of a liquidity event was not probable.
For fiscal years 2020 and 2021, we did not recognize any other stock-based compensation expense associated with RSUs as the likelihood of a liquidity event was not probable. As of January 31, 2021, total unrecognized compensation expense related to unvested RSUs was approximately $376,026 and will be recognized over the time-based vesting period once the liquidity event condition is probable of being achieved. If the qualifying IPO had occurred on January 31, 2021, we would have recorded $177,555 of stock-based compensation expense related to these RSUs using the accelerated attribution method.
Restricted Stock Awards
In September 2020, we issued 121,033 restricted stock awards to a member of our board of directors at a grant date fair value of $33.22 per share, totaling $4,021. Such RSAs vests monthly over four years from the grant date. The unvested shares are subject to a repurchase right held by us at the original purchase price. No RSAs were granted in fiscal year 2020. For the fiscal year ended January 31, 2021, 10,086 RSAs vested, and the related stock-based compensation expense was $373. As of January 31, 2021, 110,947 RSAs were unvested and are subject to repurchase. As of January 31, 2021, total unrecognized compensation expense related to unvested RSAs was $3,648 and will be recognized over the time-based vesting period.
Stock-based Compensation
We classified stock-based compensation expense in the consolidated statements of operations as follows, see Note 12, Capitalization for more details in regards stock-based compensation expense recognized for repurchase of common stock, tender offer and secondary transactions:
| Year Ended January 31, | ||||||||||||
| 2020 | 2021 | |||||||||||
| Cost of maintenance and support revenue |
$ | 834 | $ | 513 | ||||||||
| Cost of services and other revenue |
1,979 | 1,860 | ||||||||||
| Sales and marketing |
26,754 | 16,356 | ||||||||||
| Research and development |
45,235 | 11,435 | ||||||||||
| General and administrative |
63,060 | 56,003 | ||||||||||
|
|
|
|
|
|
|
|||||||
| Total |
$ | 137,862 | $ | 86,167 | ||||||||
|
|
|
|
|
|
|
|||||||
The capitalized stock-based compensation expenses relating to software development costs were $398 and $261 during fiscal 2020 and 2021, respectively.
F-44
Table of Contents
UIPATH, INC.
Notes to Consolidated Financial Statements
For the years ended January 31, 2020 and 2021
All amounts in USD thousands except share, per share data, and percentages
14. Income Taxes
The United States and foreign components of loss before income taxes for fiscal years 2020 and 2021 are as follows:
| Year Ended January 31, | ||||||||
| 2020 | 2021 | |||||||
| United States |
$ | (337,156) | $ | (105,589) | ||||
| Foreign |
(179,983) | 10,931 | ||||||
|
|
|
|
|
|||||
| Loss before income taxes |
$ | (517,139) | $ | (94,658) | ||||
|
|
|
|
|
|||||
The components of the provision for (benefit from) income taxes for fiscal years 2020 and 2021 are as follows:
| Year Ended January 31, | ||||||||
| 2020 | 2021 | |||||||
| Provision for (benefit from) income taxes |
||||||||
| Current expense |
||||||||
| Federal |
$ | | $ | | ||||
| State |
| 47 | ||||||
| Foreign |
4,118 | 5,275 | ||||||
|
|
|
|
|
|||||
| Total current expense |
4,118 | 5,322 | ||||||
| Deferred expense |
||||||||
| Federal |
| | ||||||
| State |
| | ||||||
| Foreign |
(1,324 | ) | (7,587 | ) | ||||
|
|
|
|
|
|||||
| Total provision for (benefit from) income taxes |
$ | 2,794 | $ | (2,265 | ) | |||
|
|
|
|
|
|||||
The following is a reconciliation of the statutory federal income tax rate to our effective tax rate for fiscal years 2020 and 2021:
| Year Ended January 31, | ||||||||
| 2020 (1) | 2021 | |||||||
| Federal statutory income tax rate |
21.0 | % | 21.0 | % | ||||
| Foreign taxes |
(1.6 | ) | 0.2 | |||||
| Non-deductible expenses |
(0.4 | ) | (1.1 | ) | ||||
| Stock-based compensation |
(4.3 | ) | (14.0 | ) | ||||
| Valuation allowance |
(15.0 | ) | (10.1 | ) | ||||
| Research and development |
1.0 | 6.7 | ||||||
| Other, net |
(1.3 | ) | (0.3 | ) | ||||
|
|
|
|
|
|||||
| Effective income tax rate |
(0.6 | )% | 2.4 | % | ||||
|
|
|
|
|
|||||
| (1) | Certain amounts have been reclassified to conform to the current year presentation. |
F-45
Table of Contents
UIPATH, INC.
Notes to Consolidated Financial Statements
For the years ended January 31, 2020 and 2021
All amounts in USD thousands except share, per share data, and percentages
Significant components of deferred income tax assets and liabilities as of January 31, 2020 and 2021 are as follows:
| As of January 31, | ||||||||
| Deferred tax assets | 2020(1) | 2021 | ||||||
| Net operating loss carryforwards |
$ | 114,157 | $ | 126,840 | ||||
| Accruals and reserves |
2,935 | 1,250 | ||||||
| Stock-based compensation |
3,871 | 6,010 | ||||||
| Deferred revenue |
631 | 9,337 | ||||||
| Research and development |
1,400 | 2,755 | ||||||
| Other |
524 | 807 | ||||||
|
|
|
|
|
|||||
| Total deferred tax assets, gross |
123,518 | 146,999 | ||||||
| Less: valuation allowance |
(120,208 | ) | (137,766 | ) | ||||
|
|
|
|
|
|||||
| Total deferred tax assets, net of valuation allowance |
3,310 | 9,233 | ||||||
|
|
|
|
|
|||||
| Deferred tax liabilities |
||||||||
| Deferred revenue |
| | ||||||
| Intangible assets |
(3,580 | ) | (2,894 | ) | ||||
| Depreciation and amortization |
(1,630 | ) | (897 | ) | ||||
| Other |
(34 | ) | (74 | ) | ||||
|
|
|
|
|
|||||
| Total deferred tax liabilities |
(5,244 | ) | (3,865 | ) | ||||
|
|
|
|
|
|||||
| Net deferred tax (liability) asset |
$ | (1,934 | ) | $ | 5,368 | |||
|
|
|
|
|
|||||
| (1) | Certain amounts have been reclassified to conform to the current year presentation. |
The deferred tax asset, net of valuation allowance, of $0 and $8,118 is included in deferred tax assets, non-current, and the deferred tax liability of $1,934 and $2,750 is included in other liabilities, non-current in the consolidated balance sheets as of January 31, 2020 and 2021, respectively.
We have evaluated the available positive and negative evidence supporting the realization of our U.S. and state gross deferred tax assets, including cumulative losses, and the amount and timing of future taxable income, and have determined it is more likely than not that these assets will not be realized. Accordingly, we recorded a full valuation allowance against U.S. federal and state deferred tax assets as of January 31, 2020 and 2021. We also recorded a full valuation allowance against Romanian and Japanese deferred tax assets as of January 31, 2020 and full valuation allowance against Romanian deferred tax assets as of January 31, 2021, respectively. In fiscal year 2021, we released the valuation allowance of $2,716 for the Japan deferred tax assets and recorded no valuation allowance against the difference in the Japanese deferred tax assets of $7,356 as of January 31, 2021, as we now believe it is more likely than not that we will realize such assets during the prescribed statutory period.
The table below details the activity of the deferred tax asset valuation allowance for fiscal years 2020 and 2021:
|
Beginning Balance |
Valuation Allowance Recorded During the Period |
Valuation Allowance (Released) During the Period |
Ending Balance |
|||||||||||||
| Year ended January 31, 2020 |
$ | 34,311 | $ | 85,897 | $ | | $ | 120,208 | ||||||||
| Year ended January 31, 2021 |
$ | 120,208 | $ | 20,274 | $ | (2,716) | $ | 137,766 | ||||||||
As of January 31, 2020 and 2021, the Company had U.S. federal net operating losses (NOLs) available to offset future taxable income of $9,348 and $9,348, respectively, which will expire beginning in 2035. As of
F-46
Table of Contents
UIPATH, INC.
Notes to Consolidated Financial Statements
For the years ended January 31, 2020 and 2021
All amounts in USD thousands except share, per share data, and percentages
January 31, 2020 and 2021, the Company had U.S. federal NOLs available to offset future taxable income of $251,133 and $278,982, respectively, which can be carried forward indefinitely. As of January 31, 2020 and 2021, the Company had state NOLs of $133,853 and $153,982, respectively, which begin expiring in 2023. As of January 31, 2020 and 2021, the Company had Romanian NOLs of $253,538 and $316,978, respectively, which begin expiring in 2022. Additionally, as of January 31, 2020 and 2021, the Company had Japanese NOLs of $19,903 and $15,879, respectively, which begin expiring in 2027.
Pursuant to Section 382 of the Internal Revenue Code, annual use of our U.S. net operating loss carryforwards may be limited in the event a cumulative change in ownership of more than 50% occurs within a three-year period. We determined that two such ownership changes have occurred. The first resulted in an annual limitation, independent of net unrealized built-in gains, of $107 for our net operating loss carryforwards as of April 24, 2017 but did not result in permanent disallowance of any net operating loss carryforwards. The second resulted in an annual limitation, independent of net unrealized built-in gains, of $29,000 for our net operating loss carryforwards as of July 9, 2020 but did not result in permanent disallowance of any net operating loss carryforwards.
We do not provide for taxes on our undistributed earnings of foreign subsidiaries that have not been previously taxed because we intend to invest such undistributed earnings indefinitely outside of the United States. Such amounts are immaterial.
As of the fiscal years ended January 31, 2020 and 2021, we have no unrecognized tax benefits for uncertain tax positions and has no accrued interest or penalties related to uncertain tax positions. We do not anticipate any material change in the total amount of unrecognized tax benefits will occur within the next twelve months.
We file income tax returns in the U.S. federal jurisdiction, various state jurisdictions, and in various international jurisdictions. Tax years 2017 and forward generally remain open for examination for federal and state tax purposes. Tax years 2015 and forward generally remain open for examination for foreign tax purposes. To the extent utilized in future years tax returns, net operating loss carryforwards at January 31, 2020 and 2021 will remain subject to examination until the respective tax year is closed.
15. Net loss per share Attributable to Common Stockholders
The following table sets forth the computation of basic and diluted net loss per share attributable to common stockholders for the periods presented:
| Year Ended January 31, | ||||||||||||||||||||||||||||
| 2020 | 2021 | |||||||||||||||||||||||||||
| Numerator: | Class A | Class B | Class A | Class B | ||||||||||||||||||||||||
|
|
|
|
|
|||||||||||||||||||||||||
| Net loss |
$ | (120,959 | ) | $ | (398,974 | ) | $ | (29,243 | ) | $ | (63,150 | ) | ||||||||||||||||
|
|
|
|
|
|||||||||||||||||||||||||
| Denominator: |
||||||||||||||||||||||||||||
| Weighted-average shares used in computing net loss per share attributable to common stockholders, basic and diluted |
35,450,648 | 116,931,780 | 53,253,374 | 115,002,106 | ||||||||||||||||||||||||
|
|
|
|
|
|||||||||||||||||||||||||
| Net loss per share attributable to common stockholders, basic and diluted |
$ | (3.41 | ) | $ | (3.41 | ) | $ | (0.55 | ) | $ | (0.55 | ) | ||||||||||||||||
|
|
|
|
|
|||||||||||||||||||||||||
F-47
Table of Contents
UIPATH, INC.
Notes to Consolidated Financial Statements
For the years ended January 31, 2020 and 2021
All amounts in USD thousands except share, per share data, and percentages
The potential shares of common stock that were excluded from the computation of diluted net loss per share attributable to common stockholders for the periods presented because including them would have been anti-dilutive are as follows:
| Year Ended January 31, | ||||||||||||||||||||||||||||
| 2020 | 2021 | |||||||||||||||||||||||||||
| Class A | Class B | Class A | Class B | |||||||||||||||||||||||||
|
|
|
|
|
|||||||||||||||||||||||||
| Convertible preferred stock |
271,733,505 | | 288,979,080 | | ||||||||||||||||||||||||
| Outstanding stock options |
52,954,068 | | 37,814,118 | | ||||||||||||||||||||||||
| Shares subject to repurchase |
| | 1,428,439 | | ||||||||||||||||||||||||
| Unvested RSUs |
20,479,369 | | 31,073,622 | | ||||||||||||||||||||||||
|
|
|
|
|
|||||||||||||||||||||||||
| Total |
345,166,942 | | 359,295,259 | | ||||||||||||||||||||||||
|
|
|
|
|
|||||||||||||||||||||||||
16. Related Party Transactions
For a description of certain related party transactions, see Note 12, Capitalization under Repurchases of Common Stock, Tender Offer Transactions, and Secondary Transactions.
On February 6, 2019 and March 6, 2019, we entered into loan agreements with our Chief Financial Officer, which provided him with the principal loan amount of $162 and $13, respectively, to facilitate his exercise of stock options under the 2018 Stock Plan. These loan agreements are nonrecourse, we deemed these transactions as a modification of the original vested stock options, and the incremental charges recognized as a result of this modification was immaterial. Each of these loans was repaid on November 3, 2020.
In August 2019, an immediate family member of our Chief Executive Officer, Co-Founder, and Chairman entered into an employment agreement with a third-party loan personnel supplier contracted by our Company to serve as a security specialist providing services to UiPath. Pursuant to this agreement, we paid approximately $178 and $215 in compensation (through the third-party supplier and issued RSUs) for the fiscal years ended January 31, 2020 and 2021, respectively.
| 17. | Subsequent Events |
We have performed an evaluation of the impact of subsequent events through March 25, 2021, the date the consolidated financial statements were available to be issued and identified the following subsequent events.
On February 1, 2021, we issued to certain investors 12,043,202 shares of Series F convertible preferred stock at a purchase price of $62.28 per share, for an aggregate purchase price of $750,000.
Subsequent to January 31, 2021, we granted stock options to purchase up to 128,385 shares of Class A common stock with a weighted-average exercise price of $0.10 per share. Based on the latest fair value per share available, we estimate we will recognize approximately $7,484 of stock-based compensation expense related to these stock options granted over the requisite service period of four years.
Subsequent to January 31, 2021, we granted 2,326,303 RSUs. Based on the latest fair value per share available, we estimate we will recognize approximately $136,038 of stock-based compensation expense related to these RSUs granted over the requisite service period of four years. Such RSUs contain both service-based and performance-based conditions to vest in the underlying common stock. The service-based condition criteria is generally met over a four-year period. The performance-based vesting condition is satisfied upon the occurrence of a qualifying liquidation event which is defined as the earlier to occur of (i) an IPO or (ii) a sale event.
F-48
Table of Contents
UIPATH, INC.
Notes to Consolidated Financial Statements
For the years ended January 31, 2020 and 2021
All amounts in USD thousands except share, per share data, and percentages
On March 18, 2021, we amended and restated our certificate of incorporation to, among other things, (i) increase the number of authorized shares of Class A common stock to 2,000,000,000 and (ii) modify the terms of permitted transfers of our Class B common stock.
On March 19, 2021, we acquired Cloud Elements Inc., the provider of an API integration platform for SaaS application providers and the digital enterprise. Pursuant to the acquisition agreement, the aggregate purchase price was $40,500, comprised of cash and shares of our Class A common stock. On the closing date, we paid $5,000 in cash and issued 542,511 shares of Class A common stock. The purchase price is subject to adjustment for certain working capital adjustments and post-closing indemnities. Pursuant to the acquisition agreement, we also agreed to grant a total of 184,663 RSUs to certain employees of Cloud Elements no later than May 18, 2021, subject to certain exceptions.
Due to the proximity of the acquisition date to our issuance of consolidated financial statements for the fiscal year ended January 31, 2021, the initial accounting for the Cloud Elements business combination is incomplete, and therefore we are unable to disclose certain information required by ASC 805, Business Combinations, including the provisional amounts recognized as of the acquisition date for each major class of assets acquired and liabilities assumed and goodwill (if any).
In March 2021, we granted an immediate family member of our Chief Executive Officer, Co-Founder, and Chairman options to purchase 7,000 shares of Class A common stock at an exercise price of $0.10 per share, with an aggregate estimated fair value of $408.
18. Subsequent Events (Unaudited)
Events Subsequent to Original Issuance of Consolidated Financial Statements
On April 10, 2021, our Board of Directors and our stockholders approved an amended and restated certificate of incorporation that will become effective immediately prior to the closing of the IPO. When effective, the authorized capital stock will consist of 2,000,000,000 shares of Class A common stock, 115,741,494 shares of Class B common stock, and 20,000,000 shares of convertible preferred stock. The Class A common stock will be entitled to one vote per share and the Class B common stock will be entitled to thirty-five votes per share. For a description of the differences of the rights of the Class A and Class B common stock, see Description of Capital StockClass A and Class B Common Stock included elsewhere in this prospectus.
On April 10, 2021, our Board of Directors and our stockholders approved the 2021 Equity Incentive Plan (the 2021 Plan). The 2021 Plan will become effective on the date of, and contingent upon the execution of, the underwriting agreement related to the IPO. No grants will be made under the 2021 Plan prior to its effectiveness. Once the 2021 Plan becomes effective, no further grants will be made under the 2018 Plan. We have reserved 118,795,563 shares of our Class A common stock to be issued under the 2021 Plan. In addition, the number of shares of our Class A common stock reserved for issuance under the 2021 Plan will automatically increase on February 1 of each year for a period of ten years, beginning on February 1, 2022 and continuing through February 1, 2031, in an amount equal to (1) 5% of the total number of shares of our common stock (both Class A and Class B) outstanding on the preceding January 31, or (2) a lesser number of shares determined by our Board of Directors no later than the February 1 increase.
On April 10, 2021, our Board of Directors and our stockholders approved the 2021 Employee Stock Purchase Plan (the 2021 ESPP). The 2021 ESPP will become effective on the date of, and contingent upon the
F-49
Table of Contents
UIPATH, INC.
Notes to Consolidated Financial Statements
For the years ended January 31, 2020 and 2021
All amounts in USD thousands except share, per share data, and percentages
execution of, the underwriting agreement related to the IPO. Following this offering, our ESPP will authorize the issuance of 10,500,000 shares of our Class A common stock under purchase rights granted to our employees or to employees of any of our designated affiliates. The number of shares of our Class A common stock reserved for issuance will automatically increase on February 1 of each year for a period of ten years, beginning on February 1, 2022 and continuing through February 1, 2031, by the lesser of (i) 1% of the total number of shares of our common stock (both Class A and Class B) outstanding on the preceding January 31; and (ii) 15,500,000 shares, except before the date of any such increase, our board of directors may determine that such increase will be less than the amount set forth in clauses (i) and (ii).
Subsequent to March 25, 2021, we granted stock options to purchase up to 18,164 shares of Class A common stock with a weighted-average exercise price of $0.10 per share. Based on the latest fair value per share available, we estimate we will recognize approximately $884 of stock-based compensation expense related to these stock options granted over the requisite service period of four years.
Subsequent to March 25, 2021, we granted 491,714 RSUs. Based on the latest fair value per share available, we estimate we will recognize approximately $23,987 of stock-based compensation expense related to these RSUs granted over the requisite service period of four years. Such RSUs contain both service-based and performance-based conditions to vest in the underlying common stock. The service-based condition criteria is generally met over a four-year period. The performance-based vesting condition is satisfied upon the occurrence of a qualifying liquidation event which is defined as the earlier to occur of (i) an IPO or (ii) a sale event.
F-50
Table of Contents

Table of Contents

Table of Contents
PART II
INFORMATION NOT REQUIRED IN PROSPECTUS
Unless otherwise indicated, all references to UiPath, the company, we, our, us, or similar terms refer to UiPath, Inc. and its subsidiaries.
Item 13. Other Expenses of Issuance and Distribution.
The following table sets forth all expenses to be paid by us, other than underwriting discounts and commissions, in connection with this offering. All amounts shown are estimates except for the SEC registration fee, the FINRA filing fee and the exchange listing fee.
| SEC registration fee |
$ | 161,863 | ||
| FINRA filing fee |
223,043 | |||
| Exchange listing fee |
150,000 | |||
| Printing and engraving expenses |
660,000 | |||
| Legal fees and expenses |
3,145,000 | |||
| Accounting fees and expenses |
2,100,000 | |||
| Transfer agent and registrar fees |
10,700 | |||
| Miscellaneous |
549,394 | |||
|
|
|
|||
| Total |
$ | 7,000,000 | ||
|
|
|
Item 14. Indemnification of Directors and Officers.
Section 145 of the Delaware General Corporation Law authorizes a court to award, or a corporations board of directors to grant, indemnity to directors and officers in terms sufficiently broad to permit such indemnification under certain circumstances for liabilities, including reimbursement for expenses incurred, arising under the Securities Act. Our amended and restated certificate of incorporation that will be in effect on the closing of this offering permits indemnification of our directors, officers, employees, and other agents to the maximum extent permitted by the Delaware General Corporation Law, and our amended and restated bylaws that will be in effect on the closing of this offering provide that we will indemnify our directors and executive officers and permit us to indemnify our other officers, employees, and other agents, in each case to the maximum extent permitted by the Delaware General Corporation Law.
We have entered into indemnification agreements with our directors and executive officers, whereby we have agreed to indemnify our directors and executive officers to the fullest extent permitted by law, including indemnification against expenses and liabilities incurred in legal proceedings to which the director or executive officer was, or is threatened to be made, a party by reason of the fact that such director or executive officer is or was a director, executive officer, employee, or agent of UiPath, Inc., provided that such director or executive officer acted in good faith and in a manner that the director or executive officer reasonably believed to be in, or not opposed to, the best interest of UiPath, Inc. At present, there is no pending litigation or proceeding involving a director or executive officer of UiPath, Inc. regarding which indemnification is sought, nor is the registrant aware of any threatened litigation that may result in claims for indemnification.
We maintain insurance policies that indemnify our directors and officers against various liabilities arising under the Securities Act and the Securities Exchange Act of 1934, as amended, that might be incurred by any director or officer in his capacity as such.
The underwriters are obligated, under certain circumstances, under the underwriting agreement to be filed as Exhibit 1.1 hereto, to indemnify us and our officers and directors against liabilities under the Securities Act.
II-1
Table of Contents
Item 15. Recent Sales of Unregistered Securities.
The following sets forth information regarding all unregistered securities sold since February 1, 2018:
| (1) | We have granted, under our 2015 Plan and our 2018 Plan, options to purchase an aggregate of 52,131,970 shares of our Class A common stock to our employees, consultants, and directors, having exercise prices ranging from $0.10 to $8.84 per share. |
| (2) | We have issued and sold to our employees, consultants, and directors an aggregate of 56,335,879 shares of our Class A common stock upon the exercise of stock options under our 2015 Plan and our 2018 Plan, at exercise prices ranging from $0.02 to $8.84 per share, for an approximate weighted-average exercise price of $0.60 per share. |
| (3) | We have granted, under our 2018 Plan, RSUs representing 44,569,746 shares of our Class A common stock to our employees, consultants, and directors, having a fair market value ranging from $3.82 to $54.11 per share. |
| (4) | In September 2020, we granted, under our 2018 Plan, RSAs representing 121,033 shares of our Class A common stock to a director, having a fair market value of $33.22 per share. |
| (5) | In March 2018, we issued and sold an aggregate of 43,734,270 shares of our Series B-1 convertible preferred stock and 12,972,030 shares of our Series B-2 convertible preferred stock, in each case at a price per share of $2.6981, for an aggregate purchase price of approximately $153.0 million in private placements to 15 accredited investors. |
| (6) | In September and November 2018, we sold 19,625,772 shares of our Series C-1 convertible preferred stock and 16,459,311 shares of our Series C-2 convertible preferred stock, in each case at a price per share of $6.37936, for an aggregate purchase price of approximately $230.2 million in private placements to 11 accredited investors. |
| (7) | In April 2019, we sold 34,504,224 shares of our Series D-1 convertible preferred stock and 9,986,862 shares of our Series D-2 convertible preferred stock, in each case at a price per share of $13.11723, for an aggregate purchase price of approximately $583.6 million in private placements to 108 accredited investors. |
| (8) | In July 2020, we sold 12,149,646 shares of our Series E convertible preferred stock at a price per share of $18.59346 for an aggregate purchase price of approximately $225.9 million in private placements to 99 accredited investors. |
| (9) | In February 2021, we sold 12,043,202 shares of our Series F convertible preferred stock at a price per share of $62.27576 for an aggregate purchase price of approximately $750.0 million in private placements to 97 accredited investors. |
| (10) | In March 2021, we issued 542,511 shares of our Class A common stock at a price per share of $62.27576, for an aggregate amount of approximately $33.8 million, to the owner of a company in consideration of our acquisition of all of the outstanding capital stock of such company. |
None of the foregoing transactions involved any underwriters, underwriting discounts or commissions, or any public offering. Unless otherwise specified above, we believe these transactions were exempt from registration under the Securities Act in reliance on Section 4(a)(2) of the Securities Act (and Regulation D or Regulation S promulgated thereunder) or Rule 701 promulgated under Section 3(b) of the Securities Act as transactions by an issuer not involving any public offering or under benefit plans and contracts relating to compensation as provided under Rule 701. The recipients of the securities in each of these transactions represented their intentions to acquire the securities for investment only and not with a view to or for sale in connection with any distribution thereof, and appropriate legends were placed on the share certificates issued in these transactions. All recipients had adequate access, through their relationships with us, to information about us. The sales of these securities were made without any general solicitation or advertising.
II-2
Table of Contents
Item 16. Exhibits and Financial Statement Schedules.
(a) Exhibits.
See the Exhibit Index on the page immediately preceding the signature page for a list of exhibits filed as part of this registration statement on Form S-1, which Exhibit Index is incorporated herein by reference.
(b) Financial Statement Schedules.
All financial statement schedules are omitted because the information required to be set forth therein is not applicable or is shown in the consolidated financial statements or the notes thereto.
Item 17. Undertakings.
Insofar as indemnification for liabilities arising under the Securities Act may be permitted to directors, officers, and controlling persons of the registrant under the foregoing provisions or otherwise, the registrant has been advised that in the opinion of the SEC such indemnification is against public policy as expressed in the Securities Act and is, therefore, unenforceable. In the event that a claim for indemnification against such liabilities (other than the payment by the registrant of expenses incurred or paid by a director, officer, or controlling person of the registrant in the successful defense of any action, suit, or proceeding) is asserted by such director, officer, or controlling person in connection with the securities being registered, the registrant will, unless in the opinion of its counsel the matter has been settled by controlling precedent, submit to a court of appropriate jurisdiction the question whether such indemnification by it is against public policy as expressed in the Securities Act and will be governed by the final adjudication of such issue.
The undersigned registrant hereby undertakes that:
(1) For purposes of determining any liability under the Securities Act, the information omitted from the form of prospectus filed as part of this registration statement in reliance on Rule 430A and contained in a form of prospectus filed by the registrant under Rule 424(b)(1) or (4) or 497(h) under the Securities Act will be deemed to be part of this registration statement as of the time it was declared effective.
(2) For the purpose of determining any liability under the Securities Act of 1933, each post-effective amendment that contains a form of prospectus will be deemed to be a new registration statement relating to the securities offered therein, and the offering of such securities at that time will be deemed to be the initial bona fide offering thereof.
II-3
Table of Contents
EXHIBIT INDEX
| | Previously filed. |
| + | Indicates management contract or compensatory plan. |
II-4
Table of Contents
SIGNATURES
Pursuant to the requirements of the Securities Act of 1933, the registrant has duly caused this Amendment No. 2 to registration statement to be signed on its behalf by the undersigned, thereunto duly authorized, in New York, New York, on April 19, 2021.
| UIPATH, INC. |
||
| By: |
/s/ Daniel Dines |
|
| Name: |
Daniel Dines |
|
| Title: |
Chief Executive Officer and Chairman |
|
Pursuant to the requirements of the Securities Act of 1933, this Amendment No. 2 to registration statement has been signed by the following persons in the capacities and on the dates indicated.
| Signature |
Title |
Date |
||
| /s/ Daniel Dines Daniel Dines |
Chief Executive Officer and Chairman (Principal Executive Officer) | April 19, 2021 | ||
| /s/ Ashim Gupta Ashim Gupta |
Chief Financial Officer (Principal Financial Officer) |
April 19, 2021 | ||
| /s/ Mihai Faur Mihai Faur |
Global Controller (Controller) |
April 19, 2021 | ||
| * Philippe Botteri |
Director | April 19, 2021 | ||
| * Carl Eschenbach |
Director | April 19, 2021 | ||
| * Michael Gordon |
Director | April 19, 2021 | ||
| * Kimberly L. Hammonds |
Director | April 19, 2021 | ||
|
* Thomas Mendoza |
Director |
April 19, 2021 |
||
| * Daniel D. Springer |
Director | April 19, 2021 | ||
| * Laela Sturdy |
Director | April 19, 2021 | ||
| * Jennifer Tejada |
Director | April 19, 2021 | ||
II-5
Table of Contents
| Signature |
Title |
Date |
||
| * Richard P. Wong |
Director | April 19, 2021 | ||
| *By: | /s/ Ashim Gupta |
|
| Attorney-in-Fact |
||
II-6