10-K: Annual report pursuant to Section 13 and 15(d)
Published on March 24, 2023
UNITED STATES
SECURITIES AND EXCHANGE COMMISSION
Washington, D.C. 20549
FORM 10-K
(Mark One)
| ANNUAL REPORT PURSUANT TO SECTION 13 OR 15(d) OF THE SECURITIES EXCHANGE ACT OF 1934 | |||||
For the fiscal year ended |
|||||
OR
| TRANSITION REPORT PURSUANT TO SECTION 13 OR 15(d) OF THE SECURITIES EXCHANGE ACT OF 1934 | |||||
| For the transition period from ________ to ________ | |||||
Commission file number 001-40348
(Exact name of registrant as specified in its charter)
Securities registered pursuant to Section 12(b) of the Act:
Securities registered pursuant to section 12(g) of the Act: None
| (State or other jurisdiction of incorporation or organization) | (I.R.S. Employer Identification No.) | |||||||
|
|
||||||||
| (Address of Principal Executive Offices) | (Zip code) | |||||||
( | ||||||||
| Registrant's telephone number, including area code | ||||||||
| Title of each class | Trading Symbol(s) | Name of each exchange on which registered | ||||||
$0.00001 per share |
||||||||
Indicate by check mark if the registrant is a well-known seasoned issuer, as defined in Rule 405 of the Securities Act. Yes ☒ No ☐
Indicate by check mark if the registrant is not required to file reports pursuant to Section 13 or Section 15(d) of the Act. Yes ☐ No ☒
Indicate by check mark whether the registrant: (1) has filed all reports required to be filed by Section 13 or 15(d) of the Securities Exchange Act of 1934 during the preceding 12 months (or for such shorter period that the registrant was required to file such reports); and (2) has been subject to such filing requirements for the past 90 days. Yes ☒ No ☐
Indicate by check mark whether the registrant has submitted electronically every Interactive Data File required to be submitted pursuant to Rule 405 of Regulation S-T (§232.405 of this chapter) during the preceding 12 months (or for such shorter period that the registrant was required to submit such files).Yes ☒ No ☐
Indicate by check mark whether the registrant is a large accelerated filer, an accelerated filer, a non-accelerated filer, a smaller reporting company, or an emerging growth company. See the definitions of “large accelerated filer,” “accelerated filer,” “smaller reporting company,” and "emerging growth company" in Rule 12b-2 of the Exchange Act:
If an emerging growth company, indicate by check mark if the registrant has elected not to use the extended transition period for complying with any new or revised financial accounting standards provided pursuant to Section 13(a) of the Exchange Act. ☐
| ☒ | Accelerated filer | ☐ | |||||||||
| Non-accelerated filer | ☐ | Smaller reporting company | |||||||||
| Emerging growth company | |||||||||||
Indicate by check mark whether the registrant has filed a report on and attestation to its management’s assessment of the effectiveness of its internal control over financial reporting under Section 404(b) of the Sarbanes-Oxley Act (15 U.S.C. 7262(b)) by the registered public accounting firm that prepared or issued its audit report. ☒
If securities are registered pursuant to Section 12(b) of the Act, indicate by check mark whether the financial statements of the registrant included in the filing reflect the correction of an error to previously issued financial statements. ☐
Indicate by check mark whether any of those error corrections are restatements that required a recovery analysis of incentive-based compensation received by any of the registrant's executive officers during the relevant recovery period pursuant to §240.10D-1(b). ☐
Indicate by check mark whether the registrant is a shell company (as defined in Rule 12b-2 of the Act). Yes ☐ No ☒
The aggregate market value of voting stock held by non-affiliates of the Registrant on July 29, 2022, based on the closing price of $18.33 for shares of the Registrant’s Class A common stock as reported by the New York Stock Exchange on July 29, 2022, was approximately $6.9 billion. Shares of Class A common stock beneficially owned by each executive officer, director, and stockholder that the registrant has concluded is an affiliate of the registrant have been excluded. This determination of affiliate status is not necessarily a conclusive determination for other purposes.
As of March 21, 2023, the registrant had 474,970,039 shares of Class A common stock and 82,452,748 shares of Class B common stock outstanding.
DOCUMENTS INCORPORATED BY REFERENCE
| TABLE OF CONTENTS | ||||||||
Item 1. Business
|
||||||||
Item 1A. Risk Factors
|
||||||||
Item 1B. Unresolved Staff Comments
|
||||||||
Item 2. Properties
|
||||||||
Item 3. Legal Proceedings
|
||||||||
Item 4. Mine Safety Disclosures
|
||||||||
Item 6. [Reserved]
|
||||||||
Item 9B. Other Information
|
||||||||
Item 11. Executive Compensation
|
||||||||
Item 15. Exhibit and Financial Statement Schedules
|
||||||||
Item 16. Form 10-K Summary
|
||||||||
1
Defined Terms
For the purposes of this Annual Report on Form 10-K, the terms "we," "us," "our," "UiPath," and "the Company," refer to UiPath, Inc. and its consolidated subsidiaries. Meanings of additional defined terms can be found below, in alphabetical order.
| Term | Definition | |||||||
| 2015 Plan | 2015 Stock Plan | |||||||
| 2018 Plan | 2018 Stock Plan | |||||||
| 2021 Plan | 2021 Stock Plan | |||||||
| 2022 Form 10-K | Annual Report on Form 10-K for the fiscal year ended January 31, 2022, filed with the SEC on April 4, 2022 | |||||||
| AI | artificial intelligence | |||||||
| API | application programming interface | |||||||
| ARR | annualized renewal run-rate | |||||||
| ASC | Accounting Standards Codification | |||||||
| ASU | Accounting Standards Update | |||||||
| BEPS | Base Erosion and Profit Shifting | |||||||
| CASL | Canada's Anti-Spam Legislation | |||||||
| CCPA | California Consumer Privacy Act of 2018 | |||||||
| CFO | Chief Financial Officer, Ashim Gupta | |||||||
| Cloud Elements | Cloud Elements, Inc. | |||||||
| Co-CEOs | Co-Chief Executive Officers, Daniel Dines and Robert Enslin | |||||||
| Conversion Rate | rate determined by dividing the original issue price applicable to a series of convertible preferred stock by the conversion price applicable to such series of convertible preferred stock | |||||||
| CPRA | California Privacy Rights Act of 2020 | |||||||
| Credit Facility | $200.0 million senior secured revolving credit with a maturity date of October 30, 2023 | |||||||
| Current Period ARR | ARR as of current period end from the cohort of all customers as of 12 months prior to the current period end | |||||||
| Dodd-Frank Act | Dodd-Frank Wall Street Reform and Consumer Protection Act of 2010 | |||||||
| DTAs | deferred tax assets | |||||||
| DTLs | deferred tax liabilities | |||||||
| EEA | European Economic Arena | |||||||
| ESG | Environmental, Social, and Governance | |||||||
| ESPP | 2021 Employee Stock Purchase Plan | |||||||
| EU | European Union | |||||||
| Exchange Act | Securities Exchange Act of 1934, as amended | |||||||
| FASB | Financial Accounting Standards Board | |||||||
| FCPA | United States Foreign Corrupt Practices Act | |||||||
| FDIC | Federal Deposit Insurance Corporation | |||||||
| Flex Offering | for certain of our products that are available both on-premise and via SaaS, a single offering that allows customers the choice of either deployment option | |||||||
| GDPR | General Data Protection Regulation | |||||||
| iBPMS | intelligent business process management suite | |||||||
| IDP | intelligent document processing | |||||||
| iPaaS | integration platform as a service | |||||||
| GAAP | generally accepted accounting principles in the United States | |||||||
| GT | Grant Thornton LLP | |||||||
2
| IPO | initial public offering | |||||||
| IRC | Internal Revenue Code of 1986, as amended | |||||||
| IRS | Internal Revenue Service | |||||||
| IT | information technology | |||||||
| JOBS Act | Jumpstart Our Business Startups Act | |||||||
| KPMG | KPMG LLP | |||||||
| LGPD | Brazil's General Data Protection Law | |||||||
| LLC | limited liability company | |||||||
| ML | machine learning | |||||||
| NLP | natural language processing | |||||||
| NOLs | net operating losses | |||||||
| OECD | Organisation of Economic Cooperation and Development | |||||||
| OCR | optical character recognition | |||||||
| PIPEDA | Personal Information Protection and Electronic Documents Act (Canada) | |||||||
| PIPL | Personal Information Protection Law (China) | |||||||
| Prior Period ARR | ARR from the cohort of all customers as of 12 months prior to relevant period end | |||||||
| Re:infer | Re:infer LTD | |||||||
| ROU | right-of-use | |||||||
| RPA | robotic process automation | |||||||
| RSAs | restricted stock awards | |||||||
| RSUs | restricted stock units | |||||||
| SaaS | software-as-a-service | |||||||
| SOX | the Sarbanes-Oxley Act of 2002 | |||||||
| SCCs | Standard Contractual Clauses | |||||||
| SEC | United States Securities and Exchange Commission | |||||||
| Securities Act | Securities Act of 1933, as amended | |||||||
| SSP | standalone selling price | |||||||
| TCJA | Tax Cuts and Jobs Act of 2017 | |||||||
| UI | user interface | |||||||
| U.K. | United Kingdom | |||||||
| U.S. | United States | |||||||
| VIE | variable interest entity | |||||||
3
SPECIAL NOTE REGARDING FORWARD-LOOKING STATEMENTS
This Annual Report on Form 10-K contains forward-looking statements within the meaning of Section 27A of the Securities Act and Section 21E of the Exchange Act about us and our industry that involve substantial risks and uncertainties. All statements other than statements of historical fact contained in this Annual Report on Form 10-K, including statements regarding our future results of operations or financial condition, business strategy, and plans and objectives of management for future operations, are forward-looking statements. In some cases, forward-looking statements can be identified because they contain words such as “anticipate,” “believe,” “contemplate,” “continue,” “could,” “estimate,” “expect,” “intend,” “may,” “plan,” “potential,” “predict,” “project,” “should,” “target,” “will,” or “would,” or the negative of these words or other similar terms or expressions. These forward-looking statements include, but are not limited to, statements concerning the following:
•our ability to acquire new customers and successfully retain existing customers;
•our ability to increase the number of users who access our platform and the number of automations built on our platform;
•our ability to effectively manage our growth and achieve or maintain profitability;
•future investments in our business, our anticipated capital expenditures, and our estimates regarding our capital requirements;
•the costs and success of our marketing efforts and our ability to evolve and enhance our brand;
•our growth strategies;
•the estimated addressable market opportunity for our platform and for automation in general;
•our reliance on key personnel and our ability to attract, integrate, and retain highly-qualified personnel and execute management transitions;
•our ability to obtain, maintain, and enforce our intellectual property rights and any costs associated therewith;
•the effect of global events, such as the Russian military operation in Ukraine, on our business, industry, and the global economy;
•our ability to compete effectively with existing competitors and new market entrants; and
•the size and growth rates of the markets in which we compete.
These forward-looking statements should not be unduly relied upon or regarded as predictions of future events. The forward-looking statements contained in this Annual Report on Form 10-K are based on our current expectations and projections about future events and trends that we believe may affect our business, financial condition, and operating results. The outcome of the events described in these forward-looking statements is subject to risks, uncertainties, and other factors described in Item 1A, Risk Factors, and elsewhere in this Annual Report on Form 10-K. Moreover, we operate in a highly competitive and rapidly changing environment. New risks and uncertainties emerge from time to time, and it is not possible for us to predict all risks and uncertainties that could have an impact on the forward-looking statements contained in this Annual Report on Form 10-K. The results, events, and circumstances reflected in the forward-looking statements may not be achieved or occur, and actual results, events, or circumstances could differ materially from those described in the forward-looking statements.
In addition, statements that “we believe,” and similar statements reflect our beliefs and opinions on the relevant subject, based on information available to us as of the date of this Annual Report on Form 10-K. While we believe such information provides a reasonable basis for our statements, that information may be limited or incomplete. Our statements should not be read to indicate that we have conducted an exhaustive inquiry into, or review of, all relevant information. Such statements are inherently uncertain, and investors are cautioned not to unduly rely on these statements.
The forward-looking statements made in this Annual Report on Form 10-K relate only to events as of the date on which the statements are made. We undertake no obligation to update any forward-looking statements made in this Annual Report on Form 10-K to reflect events or circumstances after the date of this Annual Report on Form 10-K or to reflect new information or the occurrence of unanticipated events, except as required by law. Our forward-looking statements do not reflect the potential impact of any future acquisitions, mergers, dispositions, joint ventures, or investments.
4
PART I
Item 1. Business
Overview
First established in a Bucharest, Romania apartment in 2005, UiPath was incorporated in Delaware in 2015 as a company principally focused on building and managing automations and developing computer vision technology, which remains the foundation of our platform today. Since that time, we have evolved from our beginnings in RPA into an end-to-end AI-powered automation platform through development and acquisitions, launched new products, and expanded our operations across the globe. Our vision is to enable automation across all knowledge work to accelerate human achievement.
The UiPath Business Automation Platform is The Foundation of Innovation™ because it can be used everywhere, by everyone, for everything, to benefit every business. We provide our customers with a robust set of capabilities that allow them to discover opportunities for automation, automate using a digital workforce that seamlessly collaborates with humans, and operate a mission critical automation program at scale. Our platform enables employees to quickly build automations for both existing and new processes and to utilize software robots to perform a vast array of actions including, but not limited to, logging into applications, extracting information from documents, moving folders, filling in forms, and updating information fields and databases. The ability of our software robots to replicate steps performed by humans in executing business processes drives operational efficiencies and enables companies to deliver on key digital initiatives with greater speed, agility, and accuracy.
Enterprise automation is here, and its momentum is growing as organizations around the world begin to understand the power of automation to drive efficiency and business outcomes. We aspire to be the defining company, advancing the evolution of automation as not just a tool, but as a way of operating and innovating.
5
Trends Shaping Our Industry
| A fragmented application landscape complicates business processes and hinders digital transformation. | Businesses worldwide have spent billions of dollars on software in an attempt to drive efficiency and competitive advantages. A proliferation of applications has resulted in a shift from traditional software suites to specialized point solutions. Enterprises have transitioned from managing a handful of multi-purpose, largely on-premises applications to managing hundreds or thousands of point solutions deployed across on-premises, cloud, and hybrid environments. These applications, which were generally not designed for interoperability, run in tandem with legacy technologies, relying on humans to act as the connective tissue in the performance of business processes. As a result, employees lose valuable time navigating a fragmented application landscape and attention is diverted away from more cognitive activities that could directly improve business outcomes. | |||||||||||||
Automation of personal workflows can lead to a democratization of automation. |
Employees must navigate an ever-increasing number of systems and applications and execute many manual and repetitive tasks in the performance of their day-to-day work, leading to frustration and lost productivity. While traditional automation solutions have attempted to address this friction, they frequently fall short of expectations because they have been designed for use by developers and engineers, rather than the employees who are directly involved in and familiar with the work being automated. By contrast, low-code solutions require little technical expertise and empower employees to use their firsthand knowledge of business processes to easily automate their personal workflows, resulting in personal and organizational benefits. |
|||||||||||||
Resource constraints require organizations to maximize workforce productivity. |
Enterprises are under pressure to maximize the productivity of their employees. This is even more critical in the current macroeconomic climate. Inflationary tensions have caused resource constraints for organizations, driving them to become more cost-conscious and seek new opportunities for efficiency and savings. Investment in automation allows organizations to devote human capital resources to the highest value tasks that humans do best, such as abstract thinking, innovation, relationship building, and dealing with ambiguity. |
|||||||||||||
| Recent advancements in AI are enabling automation of sophisticated business processes and broader use cases. |
While RPA can easily capture data and manipulate applications like a person would, automation of certain more complex and cognitive tasks has historically been out of reach. The evolution of AI, which refers to decision-making capabilities demonstrated by computer programs, has now enabled the automation of processes with characteristics—such as high variability, inherent uncertainty, and unstructured data—that would have been impossible to automate with RPA alone. AI expands capabilities by enabling software robots to learn how to read, write, listen, recognize patterns, and make complex decisions, bringing automation to a new level by opening a world of new opportunities for business growth, cost reduction, and improved productivity.
|
|||||||||||||
Competition
The market for automation is one of the fastest growing enterprise software markets and is increasingly competitive. We believe our competitors primarily fall into the following three categories:
•Enterprise platform vendors that are acquiring, building, or investing in automation functionality or partnering with automation providers.
•RPA software providers that offer RPA platforms, but lack end-to-end automation capabilities.
•Adjacent automation and integration platform companies, such as low-code, iBPMS, iPaaS, process mining, IDP, and test automation vendors, that provide additional features that can be useful for automations.
We have alliances and integrations with key vendors in each of these groups, but they often develop and market automation capabilities as extensions of their core platforms.
6
A number of technology companies have attempted to address the automation needs of organizations through the application of business process management, application development platform offerings, RPA tools, and AI point offerings, as well as other horizontal software applications. However, these existing offerings are challenged by a number of inherent limitations, including:
•lack of an end-to-end platform;
•challenges in linking AI capabilities to real-world execution;
•need for changes to an enterprise's underlying infrastructure;
•unsuitability for organization-wide use;
•lack of governance capabilities at scale; and
•lack of an engaged user community.
What We Offer
Our platform is purpose-built to be responsive to these challenges and to advance the next generation of automation with several key strengths:
•Our platform’s embedded AI, ML, and NLP capabilities improve decisioning and information processing by adapting to constantly changing variables.
•Our software robots’ ability to emulate human behavior allows organizations to address a myriad of use cases, from simple to complex, across levels and departments.
•Our platform allows users to seamlessly design and combine UI automations, API integrations, and AI-based document understanding in a single workflow.
•Our multi-tenant platform is built for enterprise deployment, with security and governance at its core, and can be deployed on-premises, in a public or private cloud, or in a hybrid environment. In addition, we offer a managed, multi-tenant SaaS version called Automation Cloud, which enables our customers to begin automating without the need to provision infrastructure, install applications, or perform additional configurations.
•Our intuitive interface and low-code, drag-and-drop functionality is easy for employees to learn regardless of their technical acumen; built-in, customizable, and shareable components serve as building blocks for users to quickly and easily build and deploy automations.
•Our platform tracks, measures, and forecasts the performance of automations, enabling customers to gain powerful insights and generate key performance indicators with actionable metrics.
•Our technology democratizes automation, empowering employees and resulting in greater professional fulfillment and job satisfaction.
•Our platform was designed to enable people and software robots to work together in harmony, with each focusing on the processes they execute best, to improve business outcomes.
The UiPath Business Automation Platform
Our platform is built to span the full automation spectrum. We recently updated its name to reflect our belief that our platform, the UiPath Business Automation Platform, is now at the center of the way our customers run their businesses—sitting between their application landscape, their processes, and their people—allowing their processes and people to move forward at the rate that they need to, by delivering resilient and robust automations and applications.
7
|
Discover
Continuously uncovers opportunities for process and task improvements, helping to identify the highest-ROI areas
|
Process Mining enables complete transparency into business processes and transforms them with automation and improvements that drive continuous operational efficiency.
|
|||||||||||||||||||
Task Mining provides an objective, data-driven picture of desktop processes quicker and with fewer resources required, allowing organizations to act on gained insight through automation.
|
||||||||||||||||||||
Communications Mining lets users mine, monitor, and automate service conversations to scale operations efficiently and improve the experience of their customers.
|
||||||||||||||||||||
Idea Capture & Management enables organizations to centrally capture and manage automation ideas and process improvements, prioritized by impact and ROI.
|
||||||||||||||||||||
|
Automate
Gets more done with a digital workforce that seamlessly collaborates with people and automates work via UI and API, powered with native-integrated AI
|
Low-code development empowers employees to build business apps and automations rapidly with low-code, visual tools.
|
|||||||||||||||||||
UI and API automation are combined for maximum scale and speed across the broadest range of systems.
|
||||||||||||||||||||
Process orchestration enables users to create smarter decision-making and collaboration between people and software robots.
|
||||||||||||||||||||
Intelligent Document Processing removes the work from paperwork with semantic understanding of a wide range of documents—accurately and quickly.
|
||||||||||||||||||||
Integrated NLP and AI/ML makes software robots smarter to seamlessly automate more sophisticated work.
|
||||||||||||||||||||
|
Operate
An enterprise-grade foundation to run and optimize a mission critical automation program at high scale
|
Analytics provides the operational and business insight organizations need for their automation programs.
|
|||||||||||||||||||
Continuous testing guarantees reliability by continuously testing and monitoring automations and the applications they rely on.
|
||||||||||||||||||||
Unified management and governance allows the organization to monitor the integrated platform and their automation program centrally at the lowest cost of ownership.
|
||||||||||||||||||||
Flexible deployment allows organizations to use the complete cloud-native platform SaaS or self-hosted for maximum flexibility.
|
||||||||||||||||||||
Our Growth Strategies
Customer Acquisition and Expansion—We have simplified our go-to-market approach to drive a level of alignment that we believe will result in refined market segmentation, higher sales productivity, and better customer experience. We sell automation not merely as a tool, but as a way of operating and innovating, and emphasize the ability of our platform to deliver meaningful business outcomes for our customers.
We sell our platform through a direct sales team, supported by a team of pre-sales engineers and our professional services organization, who offer technical expertise to help customers accelerate adoption and time-to-value. We also sell through channel partnerships and are focused on maintaining and growing a high-quality ecosystem of partners that build, train, and certify skills on our technology as well as those that deploy our technology on behalf of their customers.
We sell to organizations of all sizes across a broad range of industries and geographies, with a focus on enterprise customers. In certain geographies, we maintain specialized teams that concentrate on specific verticals such as financial services, healthcare, manufacturing, and public sector. We've designed our go-to-market engine to segment our customer base according to propensity to invest in automation, and align our coverage model accordingly:
•Enterprise—We dedicate a higher density of resources and coverage to the largest companies with the highest propensity to invest in and potential to adopt automation at scale. We believe these accounts represent our largest growth opportunity. Here we focus on selling positive business outcomes that resonate with C-level executives and leverage our largest partners for enablement. Dense coverage ratios and industry alignment of sales teams allow us to accelerate both new customer acquisition and usage expansion.
8
•Corporate and Mid-Market—We focus our more efficient and cost-effective resources on companies in the earlier stages of their automation journey, with a one-to-many coverage ratio. Our customers frequently see rapid time-to-value with our products, and we are able to quickly expand sales within organizations as customers add features, expand use cases, and increase the number of software robots beyond their initial deployment. The broad applicability of our platform enables us to sell across all levels and departments of an organization, affording opportunity for eventual graduation to the enterprise level.
•Small and Mid-Sized Business—We seek to sell to the smallest companies primarily through our most efficient partner-led, self-service, and digital channels, focusing on new durable customer acquisition. In addition, we are developing opportunities for product-led growth which will enable us to speak to users within the product to organically nurture adoption and sell additional capabilities.
Our sales efforts are complemented by our marketing initiatives, which build brand awareness, cultivate a large and growing community, and drive demand through a combination of global and local campaigns. We employ a variety of approaches to reach prospective customers, including community evangelism, in-person and digital events, content marketing, digital advertising, search optimization, partner marketing, social media, and public relations. We host and present regularly at regional and global events, including our own Forward and Together conferences.
Platform Investment and Innovation—We intend to improve outcomes for our customers by expanding our platform. We have made and plan to continue to make significant investments in research and development to enhance our technology. For example, in May 2022, we released version 22.4 of the UiPath Business Automation Platform. This release introduced new SaaS robots hosted in the UiPath Automation Cloud™, which allow customers to deploy unattended software robots instantly without IT, resources, or infrastructure. Other improvements in 22.4 included a larger library of ready-to-go automations, upleveled security and governance, and support for macOS. In October 2022, we released version 22.10 of the UiPath Business Automation Platform. This newest version provides browser-based access to a low-code build platform, the ability to build public-facing apps, enhanced process and task mining capabilities, and platform intelligence to help software robots understand both structured and unstructured data.
Strategic Acquisitions—We have acquired businesses and technologies to drive product and market expansion. For example, in July 2022, we acquired Re:inter LTD, a provider of NLP software focused on unstructured documents and communications, laying the foundation for our Communications Mining technology, which has been a fitting complement to our existing Document Understanding capabilities. We expect to continue to evaluate acquisition opportunities that we believe are complementary to our platform.
Community Engagement—We have built an extensive ecosystem through our Community, UiPath Academy and Academic Alliance initiatives, which support and train individuals working with our platform. Additionally, we offer free access via our Community Edition and Enterprise Trial, both available online. (Community Edition is a limited version of our platform that is offered for free to small businesses, university students, and individuals, whereas Enterprise Trial provides full functionality for a limited time.) The result is a global network of automation professionals who are actively building and sharing automations and transforming the way work gets done. We believe that our highly engaged user community differentiates us from competitors and that helping individual users to build their skills will drive future adoption of our platform.
Customers
We have a large and diversified customer base across a broad range of industry sectors.
We determine our customer count by considering the number of accounts with a unique account identifier for which we have an active subscription in the period indicated, including entities to which we have sold our products either directly or through a channel partner. A single organization with multiple divisions, segments, or subsidiaries is counted as a single customer. Our customer count is subject to adjustment for acquisitions, consolidations, spin-offs, and other market activity. Non-paying partners and resellers and users of free or trial subscriptions are excluded from our customer count.
9
We had approximately 10,800 and over 10,100 customers as of January 31, 2023 and 2022, respectively. The following chart illustrates the growth of our customer base over the past five years*:
Partners
We develop and maintain business and technology partnerships that help us to integrate the latest technology into our platform and to market and deliver our platform to our customers around the world.
Our business partners include regional system integrators, value-added resellers, and business consultants that enhance our market presence and drive greater sales efficiencies. In fiscal year 2023, we closed deals with a select number of partners that will offer our technology as managed services to their customers. While we have historically tiered partners based on their maintenance of competency requirements and a specified number of satisfied customers, we are in the process of transforming our partner ecosystem to increase focus on driving customer adoption, consumption, usage, and time-to-value, emphasizing quality of relationships.
Our technology partners bring specialized capabilities to our platform. They collaborate with us to develop integrations that simplify the interoperability of our platform with their technology, resulting in faster time-to-value. Examples of integrations available to our customers include integrations with offerings from Amazon Web Services Inc., Adobe Inc., Alteryx, Inc., Atlassian Corp Plc, Box, Inc., CrowdStrike, Inc., DocuSign Inc., Microsoft Corporation, Oracle Corporation, OutSystems, Qlik Technologies Inc., Salesforce.com, Inc., SAP SE, ServiceNow, Inc., Snowflake Inc., Tableau Software, LLC, and Workday, Inc.
We also drive innovation with leading AI technology partners that specialize in OCR, NLP, and custom ML and AI algorithms that are additive to our platform and can enhance the long-term business outcomes of our customers’ automations. Additionally, we maintain partnerships with leading cloud vendors, such as Amazon Web Services Inc., Google Inc., and Microsoft Corporation, to both simplify the deployment of our platform and to extend our platform to offer customers the benefits of cloud-based AI capabilities.
Intellectual Property
Intellectual property rights are important to the success of our business. We rely on a combination of patent, copyright, trademark, and trade secret laws in the U.S. and other jurisdictions, as well as license agreements, confidentiality procedures, non-disclosure agreements with third parties, and other contractual protections, to protect our intellectual property rights, including our proprietary technology, software, know-how, and brand.
10
As of January 31, 2023, we held 114 issued patents which are scheduled to expire between October 2039 and February 2043, across several jurisdictions:
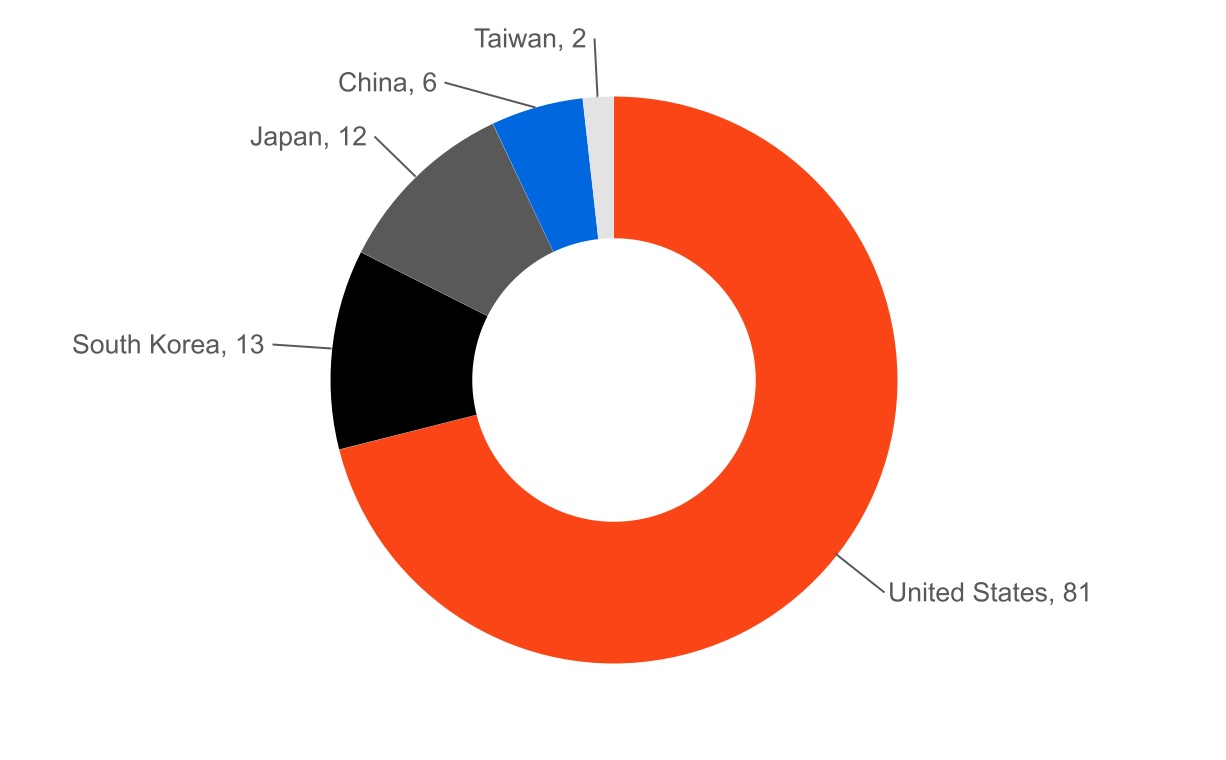
As of January 31, 2023, we also had 171 pending patent applications in the U.S., including 5 allowed U.S. patent applications, 124 pending Patent Cooperation Treaty applications, and 410 pending and 10 allowed patent applications in other jurisdictions. We held 10 registered U.S. trademarks, 11 pending U.S. trademark applications, and more than 500 active foreign trademark filings. We also held over 45 internet domain names.
We continually review our development efforts to assess and identify the existence and patentability of new intellectual property.
The terms of individual patents extend for varying periods of time, depending upon the date of filing of the patent application, the date of patent issuance, and the legal term of patents in the countries in which they are obtained. Generally, patents issued for applications filed in the U.S. are effective for 20 years from the earliest effective filing date of a non-provisional patent application. The duration of patents outside of the U.S. varies in accordance with provisions of applicable local law, but is typically also 20 years from the earliest effective filing date. However, the actual protection afforded by a patent varies from country to country and depends upon many factors, including the type of patent, the scope of its coverage, the availability of legal remedies in a particular country, and the validity and enforceability of the patent.
Although we rely on intellectual property rights, including patents, copyrights, trademarks, and trade secrets, as well as contractual protections to establish and protect our proprietary rights, we believe that factors such as the technological and creative skills of our personnel, development of new services, features, and functionality, and frequent enhancements to our platform are equally essential to establishing and maintaining our technology leadership position.
We restrict access to and use of our proprietary technology and other confidential information through the use of internal and external controls, including contractual protections with employees, contractors, customers, and partners. We require our employees, consultants, and certain other third parties to enter into confidentiality and proprietary rights agreements, and we control and monitor access to our software, documentation, and other confidential information. Our policy is to require all employees and independent contractors to sign agreements assigning to us any inventions, trade secrets, works of authorship, developments, processes, and other intellectual property generated by them on our behalf and under which they agree to protect our confidential information. In addition, we generally enter into confidentiality agreements with our customers and partners. See the section titled
11
“Risk Factors—Risks Related to Our Intellectual Property,” included in Item 1A of this Annual Report on Form 10-K, for a description of risks related to our intellectual property.
Government Regulation
Our business is and will continue to be subject to extensive U.S. federal and state and foreign laws and regulations, including laws and regulations involving privacy, data protection, security, intellectual property, competition, taxation, anti-corruption, anti-bribery, anti-money laundering, and other similar laws. Many of these laws and regulations are still evolving and are likely to remain uncertain for the foreseeable future, and these laws and regulations can vary significantly from jurisdiction to jurisdiction. The costs of complying with these laws and regulations are high and are likely to increase in the future. Further, the impact of these laws and regulations may disproportionately affect our business in comparison to our competitors that have greater resources.
In the U.S., we are subject to data security and privacy rules and regulations promulgated under the authority of the Federal Trade Commission, the Electronic Communications Privacy Act, the Computer Fraud and Abuse Act, the CCPA, and other state and federal laws relating to privacy and data security. The CCPA requires covered businesses to provide new disclosures to California residents and to provide them new ways to opt out of the sale of personal information, and provides a private right of action and statutory damages for data breaches. Other jurisdictions in the U.S. are beginning to propose laws similar to the CCPA.
As a result of our international operations, we must comply with many data security and privacy laws that may vary significantly from jurisdiction to jurisdiction. Virtually every jurisdiction in which we operate has established or is in the process of establishing data security and privacy legal frameworks with which we or our customers must comply. Our failure to comply with the laws of each jurisdiction may subject us to significant penalties. For example, the data protection landscape in Europe, including with respect to cross-border data transfers, is currently unstable and other countries outside of Europe have enacted or are considering enacting cross-border data transfer restrictions and laws requiring local data residency.
We must also comply with sanctions that are issued by countries in which we do business. In response to Russia’s military operations in Ukraine, the U.S., the EU, the U.K., Australia, Japan and other countries have imposed sanctions on Russia. Russia has also imposed sanctions. While Russia, Belarus, and Ukraine represent an immaterial percentage of our business, this is a complex and evolving area.
For a discussion of the various risks we face from regulation and compliance matters, see the sections titled “Risk Factors—Risks Related to Data Privacy and Cybersecurity” and “Risk Factors—Risks Related to Regulatory Compliance and Governmental Matters” included in Item 1A of this Annual Report on Form 10-K.
Human Capital
Workforce
Human capital is our most important asset. We were recognized as one of Inc.’s Best Workplaces for 2022 and won eight Best Company awards from Comparably in 2022, including awards for Global Culture, Happiness, Perks and Benefits, Leadership, and Best Places to Work in New York. We have been able to attract and motivate exceptionally talented, educated, and experienced employees, and believe that our ability to continue to do so is critical to our success. The principal purposes of our equity and other incentive plans are to attract, retain, and motivate selected employees, consultants, and directors through the granting of stock-based compensation awards and cash-based performance bonus awards.
12
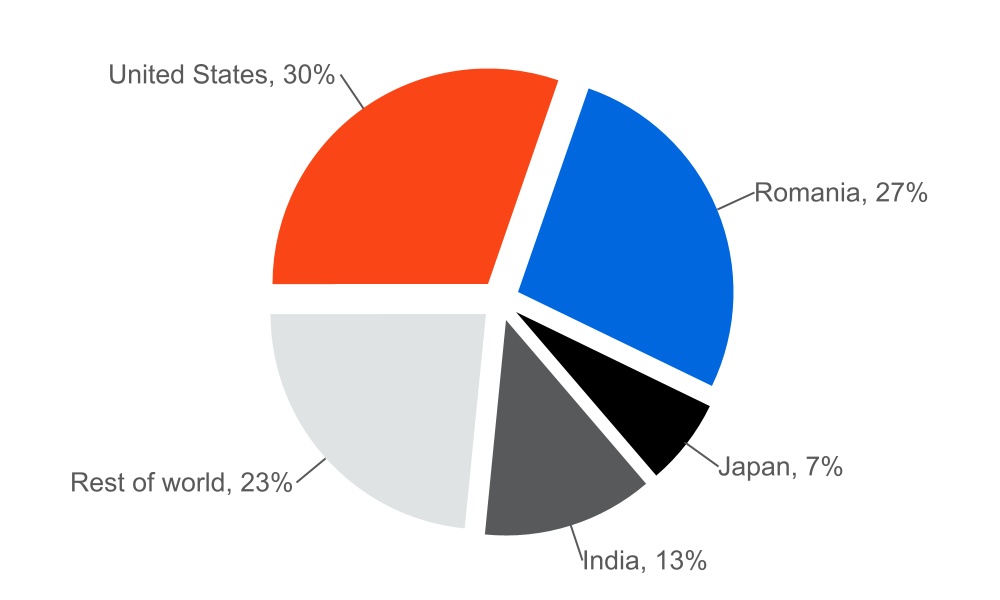
As of January 31, 2023, we had a total of 3,833 full-time employees, geographically distributed as follows:
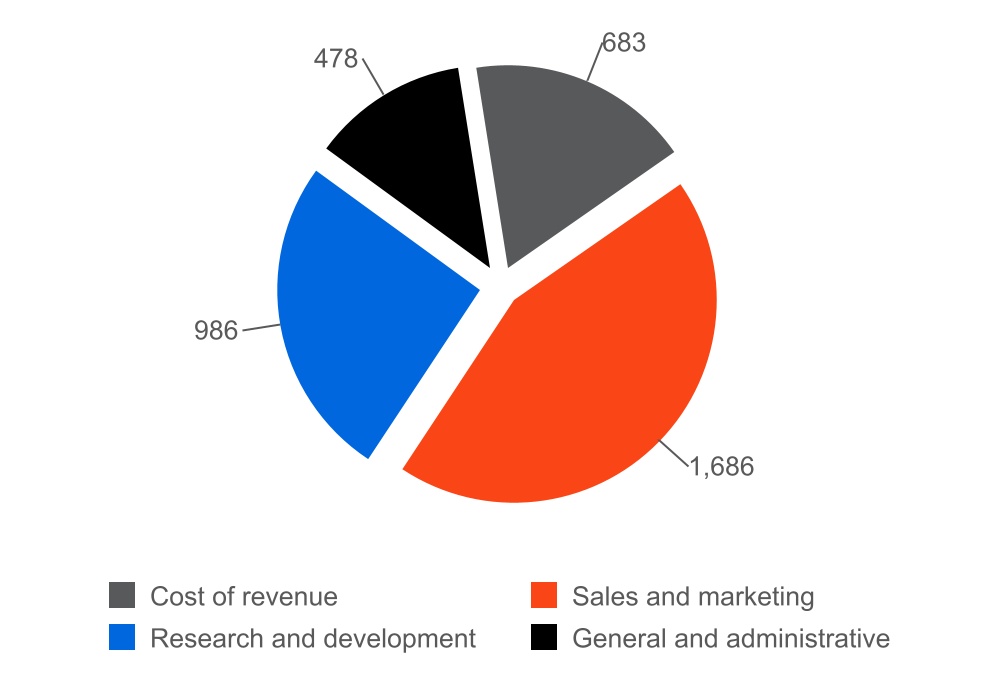
The following chart presents our full-time employees by financial statement line as of January 31, 2023:
We are subject to local labor law requirements in all countries in which we operate. We consider our employee relations to be good and have not experienced any work stoppages.
13
Culture and Values
We believe that our culture and values are critical to our success and help us to deliver tangible financial and operational benefits to our customers, employees, and stockholders. Our core values are:
 |
Humble
Listen. Learn. Help Others.
|
|||||||||||||
 |
Bold
Challenge. Experiment. Explore.
|
|||||||||||||
 |
Immersed
Consider. Reflect. Imagine.
|
|||||||||||||
 |
Fast
Take Action. Preempt. Transform.
|
|||||||||||||
Diversity, Equity, and Belonging
We believe that diversity, equity, and belonging is a business priority and a moral imperative, driving value for our employees, communities, and customers. We are strong because we welcome diverse perspectives, experiences, and approaches. We have added dedicated diversity, equity, and belonging roles to our human resources organization and seek to create an environment where employees are valued, respected, and empowered. We are committed to challenging and seeking to address inequities internally and in our communities and we invest in education to create equity. We increase job candidate pipeline diversity through external organizations such as Jobwel, NPower, and Inroad, as well as outreach to Historically Black Colleges, Black Girls Who Code, and Women Impact Tech, and have increased focus on recruiting women into leadership roles and to our Board of Directors.
Social Responsibility and Community Initiatives
We aspire to make work more meaningful for the global community as we help accelerate human achievement. This is reflected in our desire to improve our communities by bringing our technology to underserved areas. Through our global Automation for Good initiatives, we worked with governments during the COVID-19 pandemic to deploy our technology to assist government entities, hospitals, and non-profit organizations to improve citizen response, free health care workers to spend more time with patients, and accelerate mission objectives. As part of our commitment to make automation a force for good in the world, we have invested in research, collaborations, and partnerships to develop automation solutions to help solve global challenges and explore how to increase the positive impact of this technology for the benefit of people and our planet. Furthermore, we have supported initiatives and opportunities dedicated to improving automation skills and technology access and creating social good with our free online learning platform, UiPath Academy. Working with
14
our partners to develop accessible paths toward fulfilling careers and foster meaningful employment opportunities remains a key priority for UiPath, and we have expanded our network of partner organizations to equip students and workers with automation skills as part of our UiPath Academic Alliance program. We also founded the UiPath Foundation, an independent non-governmental, non-profit, non-political, and non-religious global organization, headquartered in Romania, which aims to provide children living in poverty with the skills and tools necessary to reach their potential. In April 2021, we joined the Pledge 1% movement; as of January 31, 2023, we have donated 0.3 million shares of our Class A common stock to fund projects related to our environmental, social, and governance initiatives, with an additional 2.5 million shares of our Class A common stock reserved for distribution by April 2031.
Corporate and Available Information
We were first established in Bucharest, Romania in 2005 and incorporated in Delaware on June 9, 2015. Our principal executive offices are located at One Vanderbilt Avenue, 60th Floor, New York, New York 10017, and our telephone number is (844) 432-0455.
The UiPath logo, “UiPath,” “Automation Cloud,” "The Foundation of Innovation," and our other registered and common law trade names, trademarks, and service marks are the property of UiPath, Inc. or our subsidiaries. Any other trade names, trademarks and service marks used in this Annual Report on Form 10-K are the property of their respective owners.
Our website address is www.uipath.com. Information found on, or accessible through, our website is not a part of, and is not incorporated into, this Annual Report on Form 10-K. We file electronically with the SEC our annual reports on Form 10-K, quarterly reports on Form 10-Q, current reports on Form 8-K, and amendments to those reports filed or furnished pursuant to Section 13(a) or 15(d) of the Exchange Act. We make available on our website at www.uipath.com, free of charge, copies of these reports and other information as soon as reasonably practicable after we electronically file such material with, or furnish it to, the SEC. The SEC maintains an internet site that contains reports, proxy and information statements and other information regarding issuers that file electronically with the SEC at www.sec.gov.
We may use our website as a distribution channel for material company information. Financial and other important information regarding UiPath is routinely posted on and accessible through our website at www.uipath.com. We therefore encourage investors and others interested in UiPath to review the information that we make available on our website, in addition to following our filings with the SEC, webcasts, press releases, and conference calls. In addition, you may automatically receive email alerts and other information about UiPath when you enroll your email address by visiting “Resources” under the "Investor Relations" section at www.uipath.com.
15
Item 1A. Risk Factors
Our operations and financial results are subject to various risks and uncertainties, including those described below. You should consider and read carefully all of the risks and uncertainties described below, together with all of the other information contained in this Annual Report on Form 10-K, including the section titled “Management’s Discussion and Analysis of Financial Condition and Results of Operations” and our consolidated financial statements and the related notes. The risks described below are those which we believe are the material risks we face. The occurrence of any of the following risks or additional risks and uncertainties not presently known to us or that we currently believe to be immaterial could materially and adversely affect our business, financial condition, or results of operations. In such case, the trading price of our Class A common stock could decline.
Risk Factors Summary
The following is a summary of the principal risks associated with an investment in our Class A common stock:
•Our recent rapid growth may not be indicative of our future growth. Our limited operating history and recent rapid growth also make it difficult to evaluate our future prospects and may increase the risk that we will not be successful.
•We may not be able to successfully manage our growth and, if we are not able to grow efficiently, we may not be able to reach or maintain profitability, and our business, financial condition, and results of operations could be harmed.
•Because we derive substantially all of our revenue from our automation platform, failure of this platform to satisfy customer demands could adversely affect our business, results of operations, financial condition, and growth prospects.
•Our business depends on our existing customers renewing their licenses and purchasing additional licenses and products from us and our channel partners. Declines in renewals or purchases of additional licenses and products by our customers could harm our future operating results.
•If we are unable to attract new customers, our business, financial condition, and results of operations will be adversely affected.
•The markets in which we participate are competitive and, if we do not compete effectively, our business, financial condition, and results of operations could be harmed.
•If we fail to retain and motivate members of our management team or other key employees or to integrate new team members, fail to execute management transitions, or fail to attract additional qualified personnel to support our operations, our business and future growth prospects could be harmed.
•Unfavorable macroeconomic conditions, including those caused by inflation, the Russian military action in Ukraine and related geopolitical situation, bank failures, or reductions in customers' spending on software, could limit our ability to grow our business and negatively affect our results of operations.
•A limited number of customers represent a substantial portion of our revenue and ARR. If we fail to retain these customers, our revenue and ARR could decline significantly.
•We rely on our channel partners, including our strategic alliances, to generate a substantial amount of our revenue, and if we fail to expand and manage our distribution channels or fulfill our future service obligations, our revenue could decline and our growth prospects could suffer.
•If we are not able to introduce new features or services successfully and to make enhancements to our platform or products, our business and results of operations could be adversely affected.
•Real or perceived errors, failures, or bugs in our platform and products could adversely affect our business, results of operations, financial condition, and growth prospects.
•Incorrect or improper implementation or use of our platform and products could result in customer dissatisfaction and harm our business, results of operations, financial condition, and growth prospects.
•We rely upon third-party providers of cloud-based infrastructure to host our cloud-based products. Any disruption in the operations of these third-party providers, limitations on capacity, or interference with our use could adversely affect our business, financial condition, and results of operations.
16
•We expect fluctuations in our financial results, making it difficult to project future results, and if we fail to meet the expectations of securities analysts or investors with respect to our results of operations, our stock price could decline.
•If we fail to maintain and enhance our brand, our ability to expand our customer base will be impaired and our business, financial condition, and results of operations may suffer.
•We are subject to stringent and changing obligations related to data privacy and security, including laws, regulations and standards, information security policies, and contractual obligations. Use and development of artificial intelligence and machine learning systems is also an area of developing laws, rules, and regulations. Our actual or perceived failure to comply with such obligations could lead to regulatory investigations or actions; litigation; fines and penalties; disruptions of our business operations; reputational harm; loss of revenue or profits; loss of customers or sales; and other adverse business consequences.
•If our information technology systems or data, or those of third parties upon which we rely, are or were compromised, we could experience adverse consequences resulting from such compromise, including but not limited to regulatory investigations or actions; litigation; fines and penalties; disruptions of our business operations; reputational harm; loss of revenue or profits; loss of customers or sales; and other adverse consequences.
•Any failure to obtain, maintain, protect, or enforce our intellectual property and proprietary rights could impair our ability to protect our proprietary technology and our brand.
•We may become subject to intellectual property disputes, which are costly and may subject us to significant liability and increased costs of doing business.
•Our current operations are international in scope, and we plan further geographic expansion, creating a variety of operational challenges.
•The Russian military action in Ukraine may produce near and longer term economic and geopolitical disruption which may harm our business.
•The dual class structure of our common stock has the effect of concentrating voting control with Daniel Dines, our Co-CEO, Co-Founder, and Chairman, which will limit your ability to influence the outcome of important decisions.
Risks Related to Our Business, Products, Operations, and Industry
Our recent rapid growth may not be indicative of our future growth. Our limited operating history and recent rapid growth also make it difficult to evaluate our future prospects and may increase the risk that we will not be successful.
We have experienced rapid growth. Our ARR was $1,203.8 million and $925.3 million at January 31, 2023 and 2022, respectively, representing a growth rate of 30%. We generated revenue of $1,058.6 million and $892.3 million for fiscal years 2023 and 2022, respectively, representing a growth rate of 19%. You should not, however, rely on the ARR or revenue growth of any prior quarterly or annual fiscal period as an indication of our future performance. We were incorporated in June 2015, and as a result of our limited operating history, our ability to accurately forecast our future results of operations is limited and subject to a number of uncertainties, including our ability to plan for and model future growth. Even if our ARR and revenue continue to increase, our ARR and revenue growth rates may decline in the future as a result of a variety of factors, including the maturation of our business, increased competition, changes to technology, a decrease in the growth of our overall market, or our failure, for any reason, to continue to take advantage of growth opportunities. Overall growth of our business depends on a number of additional factors, including our ability to:
•price our products effectively so that we are able to attract new customers and expand sales to our existing customers;
•expand the functionality and use cases for the products we offer on our platform;
•maintain and expand the rates at which customers purchase and renew licenses to our platform;
•provide our customers with support that meets their needs;
•continue to introduce and sell our products to new markets;
17
•continue to develop new products and new functionality for our platform and successfully further optimize our existing products and infrastructure;
•successfully identify and acquire or invest in businesses, products, or technologies that we believe could complement or expand our platform; and
•increase awareness of our brand on a global basis and successfully compete with other companies.
We may not successfully accomplish any of these objectives, and as a result, it is difficult for us to forecast our future results of operations. If the assumptions that we use to plan our business are incorrect or change in reaction to changes in our market, or if we are unable to maintain consistent ARR, revenue, or ARR or revenue growth, our stock price could be volatile, and it may be difficult to achieve and maintain profitability.
In addition, we expect to continue to expend substantial financial and other resources on:
•our technology infrastructure, including systems architecture, scalability, availability, performance, and security;
•our sales and marketing organization to engage our existing and prospective customers, increase brand awareness, and drive adoption of our products;
•product development, including investments in our product development team and the development of new products and new functionality for our platform as well as investments in further optimizing our existing products and infrastructure;
•acquisitions or strategic investments;
•our international operations and continued international expansion; and
•general administration, including increased legal and accounting expenses associated with being a public company.
These investments may not be successful on the timeline we anticipate or at all, and may not result in increased ARR or revenue growth. For instance, we anticipate that our customers will continue to increase adoption of our SaaS products in future periods. We have offered our SaaS products for only a short period of time, and we cannot predict how increased adoption of our SaaS products will change the buying patterns of our customers or impact our future ARR or revenue. If we are unable to maintain or increase our ARR or revenue at a rate sufficient to offset the expected increase in our costs, our business, financial condition, and results of operations will be harmed, and we may not be able to achieve or maintain profitability over the long term. Additionally, we have encountered, and may in the future encounter, risks and uncertainties frequently experienced by growing companies in rapidly changing industries, such as unforeseen operating expenses, difficulties, complications, delays, and other known or unknown factors that may result in losses in future periods. If our ARR or revenue growth does not meet our expectations in future periods, our business, financial condition, and results of operations may be harmed, and we may not achieve or maintain profitability in the future.
We may not be able to successfully manage our growth and, if we are not able to grow efficiently, we may not be able to reach or maintain profitability, and our business, financial condition, and results of operations could be harmed.
We have experienced and may continue to experience rapid growth and organizational change, which has placed and may continue to place significant demands on our management and our operational and financial resources. Actions we may decide to take in the future in our attempt to achieve profitability may not be successful in yielding our intended results and may not appropriately address either or both of the short-term and long-term strategy of our business. Implementation of a go forward plan and any other cost-saving initiatives, including possible future restructuring efforts, may be costly and disruptive to our business, the expected costs and charges may be greater than forecasted, and the estimated cost savings may be lower than forecasted. Finally, our organizational structure is becoming more complex as we improve our operational, financial and management controls as well as our reporting systems and procedures. If we fail to manage our anticipated growth, company personnel transitions, and change in a manner that preserves the key aspects of our corporate culture, our employee retention may suffer, which could negatively affect our products, brand, and reputation and harm our ability to retain and attract customers and employees.
18
In addition, as we expand our business, it is important that we continue to maintain a high level of customer service and satisfaction. If we are not able to continue to provide high levels of customer service, our reputation, as well as our business, results of operations, and financial condition, could be harmed. As usage of our platform capabilities grow, we will need to continue to devote additional resources to improving and maintaining our infrastructure and integrating with third-party applications. In addition, we have needed and will continue to need to appropriately scale our internal business systems and our services organization, including customer support and professional services, to serve our growing customer base. Failure of or delay in these continuing efforts could result in impaired system performance and reduced customer satisfaction, resulting in decreased sales to new customers, lower dollar-based net retention rates, the issuance of service credits, or requested refunds, which would hurt our revenue growth and our reputation. Even if we are successful in our expansion efforts, they will be expensive and complex, and require the dedication of significant management time and attention. We have faced and could continue to face inefficiencies or service disruptions as a result of our efforts to scale our internal infrastructure. We cannot be sure that the expansion of and improvements to our internal infrastructure will be effectively implemented on a timely basis, if at all, and such failures could harm our business, financial condition, and results of operations.
Because we derive substantially all of our revenue from our automation platform, failure of this platform to satisfy customer demands could adversely affect our business, results of operations, financial condition, and growth prospects.
We derive and expect to continue to derive substantially all of our revenue from our automation platform. As such, market adoption of our automation platform is critical to our continued success. Demand for our automation platform may be affected by a number of factors, many of which are beyond our control, including continued market acceptance and integration of our platform into our customers’ operations; the continued volume, variety, and velocity of automations that are generated through use of our platform; timing of development, and release of new offerings by our competitors; technological change, including in the areas of AI and ML systems, and the rate of growth in our market. Additionally, the utility of our automation platform and products relies in part on the ability of our customers to use our automation products in connection with other third-party software products that are important to our customers' businesses. If these third-party software providers were to modify the terms of their licensing arrangements with our customers in a manner that would reduce the utility of our products, or increase the cost to use our products in connection with these third-party software products, then our customers may no longer choose to adopt our automation platform or continue to use our products. If we are unable to continue to meet the demands of our customers and the developer community, our business operations, financial results, and growth prospects will be materially and adversely affected.
Our business depends on our existing customers renewing their licenses and purchasing additional licenses and products from us and our channel partners. Declines or significant delays in renewals or purchases of additional licenses and products by our customers could harm our future operating results.
Part of our growth strategy relies on our ability to deliver significant value in a short time to our customers, so that our customers will scale the use of our platform throughout their enterprise. Accordingly, our future success depends in part on our ability to exhibit this value and sell additional licenses and products to our existing customers, and our customers renewing their licenses with us and our channel partners when contract terms expire. Our license agreements primarily have annual terms, and some of our license agreements have multi-year terms. We generally do not sell standalone licenses with a term of less than one year. However, during the term of an annual contract or the last year of a multi-year contract, our customers may enter into an additional license agreement with a termination date that is coterminous with the anniversary date of such annual contract. Our customers have no obligation to renew their licenses for our products after the expiration of their license period. We provide some customers the opportunity to use our automation platform and products for free prior to purchasing a license. We also work with our customers to identify opportunities for follow-on sales to increase our footprint within their businesses.
In order for us to maintain or improve our results of operations, it is important that our customers renew or expand their licenses with us and our channel partners. We cannot accurately predict our renewals and dollar-based net retention rate given the diversity of our customer base in terms of size, industry, and geography. Our renewals and dollar-based net retention rate may decline or fluctuate as a result of a number of factors, many of which are outside our control, including the business strength or weakness of our customers; continuing or new delays in renewals due to economic conditions; customer usage, including the ability of our customers to quickly integrate our products into their businesses and continually find new uses for our products within their businesses;
19
cloud automation deployment or adoption issues; customer satisfaction with our products and platform capabilities and customer support; the utility of our platform to cost-effectively integrate with third-party software products; our prices; the capabilities and prices of competing products; mergers and acquisitions affecting our customer base; consolidation of affiliates’ multiple paid business accounts into a single paid business account or loss of business accounts in their entirety; the effects of global economic conditions including the immediate and longer-term effects of the Russian military action in Ukraine, reductions in our customers’ spending on software solutions or their spending levels generally; perceived security or data privacy risks from the use of our products; changes in regulatory regimes that affect our customers or our ability to sell our products, including changes to sanctions and export control regimes; or the views of the industry and public with regard to our products and automation products generally, including as a result of increased automation and displacement of human workforces. These factors may also be exacerbated if, consistent with our growth strategy, our customer base continues to grow to encompass larger enterprises, which may also require more sophisticated and costly sales efforts. If our customers do not purchase additional licenses and products from us or our customers fail to renew their licenses, our revenue may decline and our business, financial condition, and results of operations may be harmed.
We continually review how best to market our platform to our customers and potential customers and how to organize, train, and deploy our sales teams for efficiency and effectiveness; however, if our efforts and the changes that we are trying to implement on an ongoing basis are not successful, it could adversely affect our platform adoption and our growth.
If we are unable to attract new customers, our business, financial condition, and results of operations will be adversely affected.
To increase our revenue, we must continue to attract new customers. Our success will depend to a substantial extent on the widespread adoption of our platform and products as an alternative to existing solutions, including as an alternative to traditional systems relying on manual tasks and processes. Many enterprises have invested substantial personnel and financial resources to integrate traditional human-driven processes into their business architecture and, therefore, may be reluctant or unwilling to migrate to an automation solution. Accordingly, the adoption of automation solutions may be slower than we anticipate. A large proportion of our target market still uses traditional systems relying on manual tasks and processes for the major part of their operations. This market may need further education on the value of automation solutions in general and our platform and products in particular, and on how to integrate them into current operations. A lack of education as to how our automation platform and solutions operate may cause potential customers to prefer more traditional methodologies or their limited, internally-developed automated processes, to be cautious about investing in our platform and products, or to have difficulty integrating our platform and products into their business architecture. If we are unable to educate potential customers and change the market’s readiness to accept our technology, we may experience slower than projected growth and our business, results of operations, and financial condition may be harmed.
In addition, as our market matures, our products evolve, and competitors introduce lower cost or differentiated products that are perceived to be alternatives to our platform and products, our ability to sell licenses for our products could be impaired. Further, as various forms of AI, including generative AI, become more widely adopted and acceptable, if customers were to feel that our technology was not developing apace, our business and growth prospects could be harmed. The rapid evolution of AI may require the application of resources to develop, test, and maintain our products and services so that they are ethically designed to minimize unintended, harmful impacts. Similarly, our license sales could be adversely affected if customers or users within these organizations perceive that features incorporated into competitive products reduce the need for our products or if they prefer to purchase other products that are bundled with solutions offered by other companies that operate in adjacent markets and compete with our products. As a result of these and other factors, we may be unable to attract new customers, which may have an adverse effect on our business, financial condition, and results of operations.
The markets in which we participate are competitive and, if we do not compete effectively, our business, financial condition, and results of operations could be harmed.
Our platform and products provide automation solutions that our customers can integrate throughout their businesses. Accordingly, we compete with companies that provide RPA and other automation solutions, including Appian Corporation, Automation Anywhere, Inc., Blue Prism Group PLC, Celonis Inc., Kofax Inc., Microsoft Corporation, NICE LTD., NTT Ltd., Pegasystems Inc., and WorkFusion, Inc. In addition to RPA software providers, we compete with automation lifecycle technology providers, such as low-code, iBPMS, iPaaS, process mining, IDP, and test automation vendors, which develop and market automation capabilities as extensions of their core
20
platforms, and enterprise platform vendors, which provide horizontal applications and productivity tools and are acquiring, building, or investing in automation functionality or partnering with automation providers. We also compete with companies that provide and support the traditional systems relying on manual tasks and processes that our platform and products are designed to replace, including companies that facilitate outsourcing of such tasks and processes to lower cost workers. Our customers may also internally develop their own automated solutions to address tasks particular to their business.
The automation market is one of the fastest growing enterprise software markets and is increasingly competitive. With the introduction of new technologies and market entrants, we expect that the competitive environment will remain intense going forward. For instance, as our market becomes increasingly driven by cloud-based solutions, native cloud providers may enter this market and provide competitive offerings at lower prices. Additionally, open source alternatives for automation that are offered at no cost may impact our ability to sell our products to certain customers who may prefer to rely on these tools. Our competitors may be able to respond more quickly to new or expanding technology, such as newly emerging generative AI technologies, and devote more resources to product development that we can. The speed of technological development may prove disruptive to some of our markets if we are unable to maintain the pace of innovation. Some of our actual and potential competitors have been acquired by other larger enterprises, have made or may make acquisitions, may enter into partnerships or other strategic relationships that may provide more comprehensive products than they individually had offered, or may achieve greater economies of scale than us. In addition, new entrants not currently considered to be competitors may enter the market through acquisitions, partnerships, or strategic relationships. As we look to market and sell our products and platform capabilities to potential customers with existing internal solutions, we must convince their internal stakeholders that our products and platform capabilities are superior to their current solutions. If we fail to do so, our business, results of operations, and financial condition may be harmed.
If we fail to continue to differentiate our platform and products from those offered by our competitors, then our business, results of operations, and financial condition may be harmed.
Our competitors vary in size and in the breadth and scope of the products offered. Many of our competitors and potential competitors have greater name recognition, longer operating histories, more established customer relationships and installed customer bases, larger marketing budgets, and greater resources than we do. Further, other potential competitors not currently offering competitive solutions may expand their product or service offerings to compete with our products and platform capabilities. For instance, a number of our potential competitors already have close, integrated relationships with our customers and potential customers for other service offerings. If any of these potential competitors were to provide an automation solution within their current service offerings as a single, integrated solution, our customers and potential customers may choose to adopt the integrated solution due to administrative ease or other factors that are outside our control. Our current and potential competitors may also establish cooperative relationships among themselves or with third parties that may further enhance their resources and product offerings in our addressable market. Our competitors may be able to respond more quickly and effectively than we can to new or changing opportunities, technologies, standards, and customer requirements. An existing competitor or new entrant could introduce new technology that reduces demand for our products and platform capabilities. In addition to product and technology competition, we face pricing competition. Some of our competitors offer their on-premises or SaaS solutions at a lower price, which has resulted in, and may continue to result in, pricing pressures.
For all of these reasons, we may not be able to compete successfully against our current or future competitors, and this competition could result in the failure of our platform to continue to achieve or maintain market acceptance, which would harm our business, results of operations, and financial condition.
If we fail to retain and motivate members of our management team or other key employees or to integrate new team members, fail to execute management transitions, or fail to attract additional qualified personnel to support our operations, our business and future growth prospects could be harmed.
Our success and future growth depend largely upon the continued services of our executive officers, particularly Daniel Dines, our Co-Chief Executive Officer, Co-Founder, and Chairman, as well as our other key employees in the areas of research and development and sales and marketing. Additionally, many members of our management team have been with us for a short period of time, including Robert Enslin, our Co-Chief Executive Officer, who joined us in May 2022; and Brigette McGinnis-Day, our Chief People Officer, who joined us in August 2022. Chris Weber, our former Chief Business Officer, recently announced his departure from UiPath after a year of service. From time to time, there have been and may continue to be changes in our executive management team or
21
other key employees resulting from the hiring or the departure of these personnel. Our executive officers and other key employees are employed on an at-will basis, which means that these personnel could terminate their employment with us at any time. The loss of one or more of our executive officers, or the failure by our executive team to effectively work with our employees and lead the Company, could harm our business. Further, we have recently adopted a co-Chief Executive Officer structure and streamlined our senior management structure. Any of these changes may not achieve our desired results. As we experience personnel turnover, we have experienced and may continue to experience some loss of internal knowledge from time to time. The streamlining of our senior management team could introduce additional risk with fewer executives tasked with leading our organization. We also are dependent on the continued service of our existing software engineers because of the complexity of our products and platform capabilities.
In addition, competition for these personnel is intense, especially for engineers experienced in designing and developing RPA, AI, and ML applications, and experienced sales professionals. From time to time, we have experienced, and we expect to continue to experience, difficulty in hiring and retaining employees with appropriate qualifications. Potential candidates may not perceive our compensation package, including our equity awards, as favorably as employees hired in the past given the recent volatility in the price of our Class A common stock and in the public markets. In addition, our recruiting personnel, methodology, and approach has been and may in the future need to be altered to address a changing candidate pool and profile. We may not be able to identify or implement such changes in a timely manner.
Many of the companies with which we compete for experienced personnel have greater resources than we have. If we hire employees from competitors or other companies, their former employers have attempted and may in the future attempt to assert that these employees or we have breached their legal obligations, resulting in a diversion of our time and resources. In addition, prospective and existing employees often consider the value of the equity awards they receive in connection with their employment. As some of our employees' perception of our equity awards has declined, and may decline from time to time due to the lower price of our Class A common stock, if the Class A common stock continues to experience significant volatility, or volatility increases such that prospective employees believe there is limited upside to the value of our equity awards, it may adversely affect our ability to recruit and retain key employees. If we fail to attract new personnel or fail to retain and motivate our current personnel, our business and future growth prospects could be harmed.
We have a history of operating losses and have not been profitable in the past. We may not be able to reach and maintain profitability in the future.
While we have experienced significant revenue growth in recent periods, we have not been profitable in prior fiscal years, and we are not certain whether we will obtain a high enough volume of sales to sustain or increase our growth, or whether we will reach and maintain profitability in the future. We also expect our costs and expenses to increase in future periods, which could negatively affect our future results of operations if our revenue does not increase. In particular, we intend to continue to expend significant funds to further develop our platform, including by introducing new products and functionality, and to adapt and grow our inside sales team and enterprise sales force to drive new customer adoption, expand use cases and integrations, and support international expansion. In particular, we have entered into non-cancelable multi-year capacity commitments with respect to cloud infrastructure services with certain third-party cloud providers, which require us to pay for such capacity irrespective of actual usage. We will also face increased compliance costs associated with growth, the expansion of our customer base, and being a public company. Our efforts to grow our business may be costlier than we expect, or the rate of our growth in revenue may be slower than we expect, and we may not be able to increase our revenue enough to offset our increased operating expenses. We may incur significant losses in the future for a number of reasons, including the other risks described herein, and unforeseen expenses, difficulties, complications, or delays, and other unknown events. If we are unable to sustain profitability, the value of our business and Class A common stock may significantly decrease.
Unfavorable macroeconomic conditions, including those caused by inflation, the Russian military action in Ukraine and related geopolitical situation, or reductions in customers' spending on software, could limit our ability to grow our business and negatively affect our results of operations.
Our results of operations may vary based on the impact of changes in our industry or the macroeconomic environment on us or our customers and potential customers. Negative macroeconomic conditions both in the U.S. and abroad may include conditions resulting from changes in gross domestic product growth; labor shortages; supply chain disruptions; inflationary pressures, including those caused by the recent strengthening of the U.S.
22
dollar against certain foreign currencies in the markets in which we operate (particularly against the Euro, British Pound Sterling, and Japanese Yen); financial and credit market fluctuations, recent and potential future disruptions in access to bank deposits or lending commitments due to bank failures; international trade relations and/or the imposition of trade tariffs; political turmoil; natural catastrophes; regional or global outbreaks of contagious diseases such as COVID-19; and warfare and terrorist attacks on the U.S., Europe, the Asia Pacific region, or elsewhere, including military actions affecting Russia, Ukraine or elsewhere. These negative macroeconomic conditions have caused and may continue to cause a decrease in business investments, including spending on software solutions, and disruption of the timing and cadence of key industry and marketing events, and could materially and adversely affect the growth of our business and our results of operations. The global economy, including credit and financial markets, has experienced extreme volatility and disruptions. As a result of these factors, our revenues may be affected by both decreased customer acquisition and lower than anticipated revenue growth from existing customers. Any such volatility and disruptions may have material and adverse consequences on us, the third parties on whom we rely, or our customers. Increased inflation rates can adversely affect us by increasing our costs, including labor and employee benefit costs. Any significant increases in inflation and related increase in interest rates could have a material and adverse effect on our business, financial condition, or results of operations.
For example, these types of unfavorable conditions have in the past disrupted and could in the future disrupt the timing and attendance of key industry events, which we rely upon in part to generate sales of our products. If those events are disrupted in the future, our marketing investments, sales pipeline, and ability to generate new customers and sales of our products could be negatively and adversely affected. In addition, the increased pace of consolidation in certain industries may result in reduced overall spending on our products. Further, to the extent there is a general economic downturn and our platform is perceived by customers and potential customers as too costly or too difficult to deploy or migrate to, our revenue may be disproportionately affected by delays or reductions in general software or services spending. Also, competitors, many of whom are larger and more established than we are, may respond to market conditions by lowering prices and attempting to lure away our customers. In addition, the increased pace of consolidation in certain industries may result in reduced overall spending on our subscription offerings and related services.
Geopolitical risks, including those arising from trade tension and/or the imposition of trade tariffs, terrorist activity, or acts of civil or international hostility, are increasing. Similarly, the ongoing Russian military action in Ukraine has created extreme volatility in the global capital markets and is expected to have further global economic consequences, including disruptions of the global supply chain and energy markets. Further, other events outside of our control, including natural disasters, climate change-related events, pandemics (such as the COVID-19 pandemic), or health crises may arise from time to time and be accompanied by governmental actions that may increase international tension. Any such events and responses, including regulatory developments, may cause significant volatility and declines in the global markets, disproportionate impacts to certain industries or sectors, disruptions to commerce (including to economic activity, travel, and supply chains), loss of life, and property damage, and may materially and adversely affect the global economy or capital markets, as well as our business and results of operations.
We cannot predict the timing, strength, or duration of any economic slowdown, instability, or recovery, generally or within any particular industry. If the economic conditions of the general economy or markets in which we operate worsen from present levels, our business, results of operations, and financial condition could be adversely affected.
The Russian military action in Ukraine may produce near and longer term economic and geopolitical disruption which may harm our business.
Our operations in Russia, Belarus and Ukraine represent an immaterial amount of the Company's business. Since February 2022, we have taken steps designed to ensure that we comply with applicable regulations and that these events will not affect the services that we offer customers, including pausing our business in Russia and Belarus. The business in these areas has been and continues to be subject to regulatory and political risk and additional compliance costs in connection with sanctions and other trade controls imposed by the U.S. and other governmental authorities in response to Russia’s military operations in Ukraine. These government measures include (i) export controls restricting certain exports, re-exports, transfers or releases of commodities, software, and technology to Russia and Belarus, and (ii) sanctions targeting certain officials, individuals, entities, regions, and industries in Russia, Belarus, and Ukraine, including certain large Russian banks. We have no way to predict the progress or outcome of the situation, as the conflict and government reactions continue to develop and are beyond our control. Prolonged unrest, military activities, or additional sanctions, should they be implemented, could have a
23
material adverse effect on our operations and business outlook. If the conflict were to expand to the countries that border Ukraine, including Romania, our business could be adversely impacted. Although we have taken steps, these steps involve additional compliance costs and operational costs. If the relationship between Russia and the U.S. significantly worsens, or if Russia, the U.S., or other countries continue to impose additional economic sanctions, supply chain restrictions, or other restrictions on doing business, and we are restricted or precluded from continuing our software development operations in Ukraine, our costs could increase, and our product development efforts could be harmed, which could adversely impact our business, financial condition, and results of operations.
A limited number of customers represent a substantial portion of our revenue and ARR. If we fail to retain these customers, our revenue and ARR could decline significantly.
We derive a substantial portion of our revenue and ARR from sales to our top 10% of customers. As a result, our revenue and ARR could fluctuate materially and could be materially and disproportionately impacted by the purchasing decisions of these customers or any other significant future customer. Any of our significant customers may decide to purchase less than they have in the past, may alter their purchasing patterns at any time with limited notice, or may decide not to continue to license our platform and products at all, any of which could cause our revenue and ARR to decline and adversely affect our financial condition and results of operations. If we do not further diversify our customer base, we will continue to be susceptible to risks associated with customer concentration.
We rely on our channel partners, including our strategic alliances, to generate a substantial amount of our revenue, and if we fail to expand and manage our distribution channels or fulfill our future service obligations, our revenue could decline and our growth prospects could suffer.
Our success significantly depends upon maintaining and growing our relationships with a variety of channel partners, and we anticipate that we will continue to depend on these partners in order to grow our business. Our channel partners enable us to extend our local and global reach, in particular with smaller customers and in geographies where we have less direct sales presence. For fiscal years 2023, 2022, and 2021, we derived a substantial amount of our revenue from sales through channel partners, and we expect to continue to derive a substantial amount of our revenue from channel partners in future periods. Our agreements with our channel partners are generally non-exclusive and do not prohibit them from working with our competitors or offering competing products, and many of our channel partners may have more established relationships with our competitors. If our channel partners choose to place greater emphasis on products of their own or those offered by our competitors, do not effectively market and sell our products, or fail to meet the needs of our customers, then our ability to grow our business and sell our products may be adversely affected. In addition, the loss of one or more of our larger channel partners, who may cease marketing our products with limited or no notice, and our possible inability to replace them, could adversely affect our sales. Moreover, our ability to expand our distribution channels depends in part on our ability to educate our channel partners about our platform and products, which can be complex. Our failure to recruit additional channel partners, or any reduction or delay in their sales of our products or conflicts between channel sales and our direct sales and marketing activities may harm our results of operations. Even if we are successful, these relationships may not result in greater customer usage of our products or increased revenue. We also bear the risk that our channel partners will fail to comply with U.S. or international anti-corruption or anti-competition laws, in which case we might be fined or otherwise penalized as a result of the agency relationship with such partners.
In addition, the financial health of our channel partners and our continuing relationships with them are important to our success. Some of these channel partners may be unable to withstand adverse changes in economic conditions, which could result in insolvency and/or the inability of such distributors to obtain credit to finance purchases of our products and services, which could negatively impact our future financial performance. In addition, weakness in the end-user market could negatively affect the cash flows of our channel partners who could, in turn, delay paying their obligations to us, which would increase our credit risk exposure. Our business could be harmed if the financial condition of some of these channel partners substantially weakened and we were unable to timely secure replacement channel partners.
Further, we from time to time enter into strategic alliance arrangements wherein we sell our products and services to a partner. These strategic alliances may include investments we make to enable the partner to create or enhance their RPA practice. If the strategic alliance partner is unable to successfully create or expand their RPA practice, we may not realize the benefits we expect.
24
These strategic alliances may also include non-cancelable commitments we make to these third-party alliance partners whereby we plan to leverage the partner’s products or services in arrangements with third-party customers. Should we be unable to deploy the partner’s products or services in arrangements with third-party customers, it may materially and adversely impact our gross margins, profitability and financial results in any given period. Further, these strategic alliances are a vector for potential growth and expansion for us and these alliances may not be successful and/or as profitable as we project.
If we and our channel partners fail to provide sufficient high-quality consulting, training, support, and maintenance resources to enable our customers to realize significant business value from our platform, we may see a decrease in customer adoption of our platform.
Our customers sometimes request consulting and training to assist them in integrating our platform into their business, and rely on our customer support personnel to resolve issues and realize the full benefits that our platform provides. As a result, an increase in the number of customers is likely to increase demand for consulting, training, support, and maintenance related to our products. Given that our customer base and products continue to grow, we will need to provide our customers with more consulting, training, support, and maintenance to enable them to realize significant business value from our platform. We rely on our ecosystem of partners that build, train, and certify skills on our technology, as well as deploy our technology on behalf of their customers. We have been increasing our channel partner and customer enablement through our UiPath Academy and other training initiatives designed to create an ecosystem of people that are skilled in the use and integration of our platform in business operations. However, if we and our channel partners are unable to provide sufficient high-quality consulting, training, integration, and maintenance resources, our customers may not effectively integrate our automation platform into their business or realize sufficient business value from our products to justify follow-on sales, which could impact our future financial performance. Additionally, if our channel partners fail to perform or if any of our channel partners suffer reputational or brand harm, our customers may choose to not rely on our channel partners for consulting, training, integration, and maintenance resources. Further, some of our customers are industry leaders, and our contracts with them receive significant public attention. If we or our channel partners encounter problems in helping these customers implement our platform or if there is negative publicity regarding these engagements (even if unrelated to our services or products) our reputation could be harmed and our future financial performance could be negatively impacted. Finally, the investments required to meet the increased demand for our consulting services could strain our ability to deliver our consulting engagements at desired levels of profitability, thereby impacting our overall profitability and financial results.
If we are not able to introduce new features or services successfully and to make enhancements to our platform or products, our business and results of operations could be adversely affected.
Our ability to attract new customers and increase revenue from existing customers depends in part on our ability to enhance and improve our platform and to introduce new features and services. To grow our business and remain competitive, we must continue to enhance our platform with features that reflect the constantly evolving nature of automation and AI technology and our customers’ evolving needs. The success of new products, enhancements, and developments depends on several factors including, but not limited to: our anticipation of market changes and demands for product features, including successful product design and timely product introduction, sufficient customer demand, cost effectiveness in our product development efforts, and the proliferation of new technologies that are able to deliver competitive products and services at lower prices, more efficiently, more conveniently, or more securely. In addition, because our platform is designed to operate with a variety of systems, applications, data, and devices, we will need to continuously modify and enhance our platform to keep pace with changes in such systems. We may not be successful in developing these modifications and enhancements. Furthermore, the addition of features and solutions to our platform will increase our research and development expenses. Any new features that we develop may not be introduced in a timely or cost-effective manner or may not achieve the market acceptance necessary to generate sufficient revenue to justify the related expenses. It is difficult to predict customer adoption of new features. Such uncertainty limits our ability to forecast our future results of operations and subjects us to a number of challenges, including our ability to plan for and model future growth. If we cannot address such uncertainties and successfully develop new features, enhance our software, or otherwise overcome technological challenges and competing technologies, our business and results of operations could be adversely affected.
We also offer professional services including consulting and training and must continually adapt to assist our customers in deploying our platform in accordance with their specific automation strategies. If we cannot introduce new services or enhance our existing services to keep pace with changes in our customers’ deployment strategies,
25
we may not be able to attract new customers, retain existing customers, and expand their use of our software or secure renewal contracts, which are important for the future of our business.
We offer free trials and a free tier of our platform to drive awareness of our products, and encourage use and adoption. If these marketing strategies fail to lead to customers purchasing paid licenses, our ability to grow our revenue will be adversely affected.
To encourage awareness, use, familiarity, and adoption of our platform and products, we offer a community edition and enterprise trial version of our software, each of which provides free, online access to certain of our products. This “try-before-you-buy” strategy may not be successful in driving developer education regarding or leading customers to purchase our products. Many users of our free tier may not lead to others within their organization purchasing and deploying our platform and products. To the extent that users do not become or we are unable to successfully attract paying customers, we will not realize the intended benefits of these marketing strategies and our ability to grow our revenue will be adversely affected.
We target enterprise customers, and sales to these customers involve risks that may not be present or that are present to a lesser extent with sales to smaller entities.
Our enterprise sales force focuses on sales to large enterprise, organizational, and government agency customers. As of January 31, 2023, we had 1,785 customers with ARR of $100 thousand or more and 229 customers with ARR of $1.0 million or more, which accounted for approximately 81% and 43% of our revenue, respectively, for the period then ended. As of January 31, 2022, we had 1,493 customers with ARR of $100 thousand or more and 158 customers with ARR of $1.0 million or more, which accounted for approximately 79% and 43% of our revenue, respectively, for the period then ended. See the section titled “Management’s Discussion and Analysis of Financial Condition and Results of Operations—Key Performance Metric” for a description of ARR. Sales to large customers involve risks that may not be present or that are present to a lesser extent with sales to smaller entities, such as longer sales cycles, more complex customer requirements (and higher contractual risk as a result), substantial upfront sales costs, less favorable terms, and less predictability in completing some of our sales. For example, enterprise customers may require considerable time to evaluate and test our solution and those of our competitors prior to making a purchase decision and placing an order. A number of factors influence the length and variability of our sales cycle, including the need to educate potential customers about the uses and benefits of our automation platform and products, the discretionary nature of purchasing and budget cycles, and the competitive nature of evaluation and purchasing approval processes. As a result, the length of our sales cycle, from identification of the opportunity to deal closure, may vary significantly from customer to customer, with sales to large enterprises typically taking longer to complete and requiring greater organizational resources. Moreover, large enterprise customers often begin to deploy our products on a limited basis, but nevertheless demand configuration, integration services, and pricing negotiations, which increase our upfront investment in the sales effort with no guarantee that these customers will deploy our products widely enough across their organization to justify our substantial upfront investment.
Real or perceived errors, failures, or bugs in our platform and products could adversely affect our business, results of operations, financial condition, and growth prospects.
Our platform and products are complex and use novel technology. Undetected errors, failures, or bugs have occurred in our platform and products in the past and may occur in the future. Our platform and products are used throughout our customers’ business environments and with different operating systems, system management software, applications, devices, databases, servers, storage, middleware, custom and third-party applications and equipment, and networking configurations, which may cause errors or failures in the business environment into which our platform and products are deployed. This diversity of applications increases the likelihood of errors or failures in those business environments. Despite testing by us, real or perceived errors, failures, or bugs may not be found until our customers use our platform and products. Such failures or bugs can cause reputational damage, and in some cases can affect our revenue due to the impact of service level commitments that we offer to our customers, as described below.
Our platform and products also empower our customers to develop their own use cases for our automation platform and products. We cannot guarantee that these user-developed automations will be effective or that they do not include errors, failures, or bugs that then may be attributed, correctly or not, to our underlying technologies. For instance, our customers may use our products in a manner in which they were not intended and that could cause our platform or products to be implicated in any resulting errors or failures. Real or perceived errors, failures, or
26
bugs in our platform and products could result in negative publicity, loss of or delay in market acceptance of our platform and products, regulatory investigations and enforcement actions, harm to our brand, weakening of our competitive position, claims by customers for losses sustained by them, or failure to meet the stated service level commitments in our customer agreements. In such an event, we may be required, or may choose, for customer relations or other reasons, to expend significant additional resources in order to help correct the problem. Any errors, failures, or bugs in our platform or products could also impair our ability to attract new customers, retain existing customers, or expand their use of our software, which would adversely affect our business, results of operations, and financial condition.
Incorrect or improper implementation or use of our platform and products could result in customer dissatisfaction and harm our business, results of operations, financial condition, and growth prospects.
Our automation platform and products and related services are designed to be deployed in a wide variety of technology environments, including in large-scale, complex technology environments across a wide range of use cases. We believe our future success will depend, at least in part, on our ability and the ability of our channel partners to support such deployments. Implementations of our platform may be technically complicated and it may not be easy to maximize the value of our platform without proper implementation and training. If our customers are unable to implement our platform successfully, or in a timely manner, or if our customers perceive that the implementation of our platform is too complex or time consuming, customer perceptions of us and our software may be impaired, our reputation and brand may suffer, and customers may choose not to renew their licenses or increase their purchases of our related services.
We regularly train our customers and channel partners in the proper use of and the variety of benefits that can be derived from our automation platform and products to maximize their potential. We and our channel partners often work with our customers to achieve successful implementations, particularly for large, complex deployments. Our failure or the failure of our channel partners to train customers on how to efficiently and effectively deploy and use our platform and products, or our failure or the failure of our channel partners to provide effective support or professional services to our customers, whether actual or perceived, may result in negative publicity or legal actions against us. Also, as we continue to expand our customer base, any actual or perceived failure by us or our channel partners to properly provide these services will likely result in lost opportunities for follow-on sales of our related services.
We rely upon third-party providers of cloud-based infrastructure to host our cloud-based products. Any disruption in the operations of these third-party providers, limitations on capacity, or interference with our use could adversely affect our business, financial condition, and results of operations.
Our continued growth depends in part on the ability of our existing and potential customers to continue to adopt and utilize our cloud-based products in conjunction with our platform. We outsource substantially all of the infrastructure relating to our cloud-based products to third-party hosting services. Customers of our cloud-based products expect to be able to access these products at any time, without material interruption or degradation of performance. Our cloud-based products depend on virtual cloud infrastructure hosted by third-party hosting services. UiPath protects these services by maintaining the configuration, architecture, features, and interconnection specifications, as well as the information stored in these virtual data centers, which is transmitted by third-party internet service providers. Any disruption as a result of cyberattacks or similar issues, or any limitation on the capacity of our third-party hosting services, could impede our ability to onboard new customers or expand the usage of our existing customers or otherwise adversely affect our business, which could adversely affect our financial condition and results of operations. Due to the fact that we rely on third-party providers of cloud-based infrastructure to host our cloud-based products, it may become increasingly difficult to maintain and improve their performance, especially during peak usage times and as our cloud capabilities become more complex and our user traffic increases, because we do not control the infrastructure supporting these services. In addition, any incident affecting our third-party hosting services’ infrastructure that may be caused by cyberattacks, natural disasters, fire, flood, severe storm, earthquake, power loss, telecommunications failures, outbreaks of contagious diseases, military actions, terrorist or other attacks, and other similar events beyond our control could negatively affect our cloud-based products. If our cloud-based products are unavailable or if our users are unable to access our cloud-based products within a reasonable amount of time or at all, we may experience a loss of customers, loss or delay of market acceptance of our platform and products, delays in payment to us by customers, injury to our reputation and brand, legal claims against us, and the diversion of our resources. We may also incur significant costs for using alternative equipment or taking other actions in preparation for, or in reaction to, events that damage the third-party hosting services we use.
27
In the event that our service agreements with our third-party hosting services are terminated, or there is a lapse of service, elimination of services or features that we utilize, interruption of internet service provider connectivity, or damage to such facilities, we could experience interruptions in access to our cloud-based products as well as significant delays and additional expense in arranging or creating new facilities and services and/or re-architecting our cloud-based products for deployment on a different cloud infrastructure service provider, which could adversely affect our business, financial condition, and results of operations.
We expect fluctuations in our financial results, making it difficult to project future results, and if we fail to meet the expectations of securities analysts or investors with respect to our results of operations, our stock price could decline.
Our results of operations have fluctuated in the past and are expected to fluctuate in the future due to a variety of factors, many of which are outside of our control. As a result, our past results may not be indicative of our future performance. In addition to the other risks described herein, factors that may affect our results of operations include the following:
•fluctuations in demand for or pricing of our platform and products;
•fluctuations in usage of our platform and products;
•fluctuations in our mix of revenue from licenses and service arrangements;
•our ability to attract new customers;
•our ability to retain our existing customers;
•customer expansion rates and the pricing and quantity of licenses renewed;
•fluctuations in mix of revenue, cost of revenue, and gross margin from sales directly to end-customers and/or through channel partners including our strategic alliances;
•timing and amount of our investments to expand the capacity of our third-party cloud infrastructure providers;
•seasonality;
•the investment in new products and features relative to investments in our existing infrastructure and products;
•the timing of customer purchases;
•fluctuations or delays in purchasing decisions in anticipation of new products or enhancements by us or our competitors;
•changes in customers’ budgets and in the timing of their budget cycles and purchasing decisions;
•our ability to control costs, including our operating expenses;
•the amount and timing of payment for operating expenses, particularly sales and marketing and research and development expenses, including commissions;
•the amount and timing of non-cash expenses, including stock-based compensation, goodwill impairments, and other non-cash charges;
•the amount and timing of costs associated with recruiting, training, and integrating new employees and retaining and motivating existing employees;
•the effects of acquisitions and their integration;
•general economic conditions, both domestically and internationally, as well as economic conditions specifically affecting industries in which our customers participate;
•the impact of new accounting pronouncements;
•changes in regulatory or legal environments that may cause us to incur, among other elements, expenses associated with compliance;
•changes in the competitive dynamics of our market, including consolidation among competitors or customers; and
28
•significant security breaches of, technical difficulties with, or interruptions to the delivery and use of our products and platform capabilities.
Any of these and other factors, or the cumulative effect of some of these factors, may cause our results of operations to vary significantly. If our quarterly or annual results of operations fall below the expectations of investors or securities analysts who follow our stock, the price of our Class A common stock could decline substantially, and we could face lawsuits that are costly and may divert management’s attention, including securities class action suits.
Seasonality may cause fluctuations in our sales and results of operations.
Historically, we have experienced seasonality in new and renewal customer bookings, as typically we enter into a higher percentage of license agreements with new customers and renewals with existing customers in the fourth quarter of our fiscal year. We believe that this seasonality results from the procurement, budgeting, and deployment cycles of many of our customers, particularly our enterprise customers. While we believe that this seasonality has affected and will continue to affect our quarterly or annual results, we expect that this seasonality will become more pronounced as we continue to target larger enterprise customers and as our rapid growth begins to slow. Seasonal fluctuations in our sales means that our revenue may not be consistent from period to period. Accordingly, you should not expect our quarterly or annual results to be predictive of any future period.
Our key performance metric, ARR, and certain other operational data in this report are subject to assumptions and limitations and may not provide an accurate indication of our future or expected results.
ARR is based on numerous assumptions and limitations, is calculated using our internal data that has not been independently verified by third parties, and may not provide an accurate indication of our future or expected results. We define ARR as annualized invoiced amounts per solution SKU from subscription licenses and maintenance and support obligations assuming no increases or reductions in customers' subscriptions. ARR does not include the costs we may incur to obtain such subscription licenses or provide such maintenance and support, and does not include invoiced amounts associated with perpetual licenses or professional services. ARR is not a forecast of future revenue and does not reflect any actual or anticipated reductions in invoiced value due to contract non-renewals or service cancellations other than for specific reserves, such as those for credit losses or disputed amounts. As a result, ARR and our other operational data may not reflect our actual performance, and investors should consider these metrics in light of the assumptions used in calculating such metrics and limitations as a result thereof. In addition, investors should not place undue reliance on these metrics as an indicator of our future or expected results. Moreover, these metrics may differ from similarly titled metrics presented by other companies and may not be comparable to such other metrics. See the sections titled “Management’s Discussion and Analysis of Financial Condition and Results of Operations—Key Performance Metric” for additional information regarding our ARR.
We may require additional capital to support the growth of our business, and this capital may not be available on acceptable terms, if at all.
We have funded our operations since inception primarily through customer payments and net proceeds from sales of equity securities. We cannot be certain when or if our operations will generate sufficient cash to fully fund our ongoing operations, our planned investments, or the growth of our business. Following our initial public offering, we focused on growing our business to take advantage of our market opportunities. While growth remains important, we are also focused on the path to profitability. Our planned investments to drive growth may require us to engage in equity or debt financings to secure additional funds. Additional financing may not be available on terms favorable to us, if at all. The effects of the disruptions to and volatility in the credit and financial markets in the U.S. and worldwide from geopolitical and macroeconomic events, including the COVID-19 pandemic, the ongoing Russia-Ukraine conflict and related sanctions, and bank failures, could limit our access to financing and increase our costs of borrowing.
If adequate funds are not available on acceptable terms, we may be unable to invest in future growth opportunities, which could harm our business, results of operations, and financial condition. If we incur debt, the debt holders would have rights senior to holders of Class A common stock to make claims on our assets, and the terms of any future debt could restrict our operations, including our ability to pay dividends on our Class A common stock. Furthermore, if we issue additional equity securities, stockholders will experience dilution, and the new equity securities could have rights senior to those of our Class A common stock. Because our decision to issue securities in the future will depend on numerous considerations, including factors beyond our control, we cannot predict or
29
estimate the amount, timing, or nature of any future issuances of debt or equity securities. As a result, our stockholders bear the risk of future issuances of debt or equity securities reducing the value of our Class A common stock and diluting their interests.
Adverse developments affecting the financial services industry could adversely affect our current and projected business operations and our financial condition and results of operations.
Adverse developments that affect financial institutions, such as events involving liquidity that are rumored or actual, have in the past and may in the future lead to bank failures and market-wide liquidity problems. For example, on March 10, 2023, Silicon Valley Bank was closed by the California Department of Financial Protection and Innovation, which appointed the FDIC as receiver. Similarly, on March 12, 2023, Signature Bank and Silvergate Capital Corp. were each swept into receivership.The Department of the Treasury, the Federal Reserve and the FDIC released a statement that indicated that all depositors of Silicon Valley Bank would have access to all of their funds, including funds held in uninsured deposit accounts, after only one business day of closure. The U.S. Department of Treasury, FDIC and Federal Reserve Board have announced a program to provide up to $25 billion of loans to financial institutions secured by certain of such government securities held by financial institutions to mitigate the risk of potential losses on the sale of such instruments, widespread demands for customer withdrawals or other liquidity needs of financial institutions for immediately liquidity may exceed the capacity of such program. There is no guarantee, however, that the U.S. Department of Treasury, FDIC and Federal Reserve Board will provide access to uninsured funds in the future in the event of the closure of other banks or financial institutions, or that they would do so in a timely fashion.
We do not hold material cash deposits or securities at Silicon Valley Bank and have not experienced any adverse impact to our liquidity or to our current and projected business operations, financial condition or results of operations. However, uncertainty remains over liquidity concerns in the broader financial services industry, and our business, our business partners, or industry as a whole may be adversely impacted in ways that we cannot predict at this time.
Uncertainty remains over liquidity concerns in the broader financial services industry, and there may be additional impacts to our business and our industry that we cannot predict at this time. Further, a significant portion of our assets are held in cash, cash equivalent and marketable securities. If the financial uncertainty were to impact a broad segment of the financial services environment, our enterprise value and our future prospects could be negatively impacted.
If we fail to maintain and enhance our brand, our ability to expand our customer base will be impaired and our business, financial condition, and results of operations may suffer.
We believe that maintenance and enhancement of the UiPath brand is important to support the marketing and sale of our existing and future products to new customers and expand sales of our platform and products to existing customers. We also believe that the importance of brand recognition will increase as competition in our market increases. Successful maintenance and enhancement of our brand will depend largely on the effectiveness of our marketing efforts, our ability to provide reliable products that continue to meet the needs of our customers at competitive prices, our ability to maintain our customers’ trust, our ability to show that our products improve efficiency for our customers while improving engagement and satisfaction of their employees, our ability to continue to develop new functionality and use cases, our ability to successfully differentiate our products and platform capabilities from competitive products, and our ability to adequately obtain and protect our trademarks and trade names. Our brand promotion activities may not generate customer awareness or yield increased revenue, and even if they do, any increased revenue may not offset the expenses we incur in building our brand.
Our ability to maintain and enhance our brand may also be subject to factors that are outside of our control. For instance, media stories regarding the potential effects on employment of automation and technologies that replace traditional, human-driven systems are commonplace. Unfavorable publicity regarding the impact automation may have on unemployment could harm our brand and reputation, even if unrelated to our products. Such negative publicity could also reduce the potential demand and size of the market for our products and decrease our revenue.
We may not be able to protect all of our registered or unregistered trademarks or trade names relevant to our brand and our rights may be challenged, infringed, circumvented, declared generic, lapsed, or determined to be infringing on or dilutive of other marks. If we are unable to protect our rights in these trademarks and trade names, third parties may file for registration of trademarks similar or identical to our trademarks, thereby impeding our ability
30
to build brand identity and possibly leading to market confusion. If we fail to successfully promote and maintain our brand, our business, financial condition, and results of operations may suffer.
If we cannot maintain our corporate culture as we grow, our success and our business and competitive position may be harmed.
We believe our culture has been a key contributor to our success to date and that the critical nature of the technology that we develop promotes a sense of greater purpose and fulfillment in our employees. We have developed a culture in which our employees adhere to our core tenets of being humble, bold, immersed, and fast. As we continue to hire more employees to keep pace with our growth, it may become more difficult for us to find employees that exhibit these values or to instill them in our new employees. Any failure to preserve our culture could negatively affect our ability to retain and recruit personnel, which is critical to our growth, and our ability to effectively focus on and pursue our corporate objectives. As we grow and develop our corporate infrastructure, we may find it difficult to maintain these important aspects of our culture. If we fail to maintain our company culture, our business and competitive position may be harmed.
Indemnity provisions in various agreements to which we are party potentially expose us to substantial liability for infringement, misappropriation, or other violation of intellectual property rights, data protection, and other losses.
Our agreements with our customers and other third parties may include indemnification provisions under which we agree to indemnify or otherwise be liable to them for losses suffered or incurred as a result of claims of infringement, misappropriation, or other violation of intellectual property rights, data protection, damages caused by us to property or persons, or other liabilities relating to or arising from our software, services, or platform, our acts or omissions under such agreements, or other contractual obligations. Some of these indemnity agreements provide for uncapped liability and some indemnity provisions survive termination or expiration of the applicable agreement. Large indemnity payments could harm our business, financial condition, and results of operations. Although we attempt to contractually limit our liability with respect to such indemnity obligations, we are not always successful and may still incur substantial liability related to them, and we may be required to cease use of certain functions of our platform or products as a result of any such claims. Any dispute with a customer or other third party with respect to such obligations could have adverse effects on our relationship with such customer or other third party and other existing or prospective customers, reduce demand for our products and services, and adversely affect our business, financial condition, and results of operations. In addition, although we carry general liability and cybersecurity insurance, our insurance may not be adequate to indemnify us for all liability that may be imposed or otherwise protect us from liabilities or damages with respect to claims alleging compromises of customer data, and any such coverage may not continue to be available to us on acceptable terms or at all.
We have in the past engaged, and may in the future engage, in acquisition and investment activities, which could divert the attention of management, disrupt our business, dilute stockholder value, and adversely affect our results of operations and financial condition.
As part of our business strategy, we continually evaluate opportunities to acquire or invest in businesses, products or technologies that we believe could complement or expand our products and solutions, enhance our technical capabilities or otherwise offer growth opportunities. For example, in March 2021, we acquired Cloud Elements, a provider of a leading application programming interface integration platform for SaaS application providers and the digital enterprise. In July 2022, we acquired Re:infer, an NLP company for unstructured documents and communications. In the future, we may be unable to identify suitable acquisition candidates and, even if we do, we may not be able to complete desired acquisitions on favorable terms, if at all. If we are unable to complete acquisitions, we may not be able to strengthen our competitive position or achieve our goals. Future acquisitions and investments may result in unforeseen operating difficulties and expenditures, including disruption of our ongoing operations, diversion of management attention, and increased expenses and liabilities. An acquisition may also negatively affect our financial results because it may:
•require us to incur charges or assume substantial debt;
•cause adverse tax consequences or unfavorable accounting treatment;
•expose us to claims and disputes by third parties, including intellectual property and privacy claims and disputes;
31
•not generate sufficient financial return to offset additional costs and expenses related to the acquisition;
•cause us to incur liabilities for activities of the acquired company before the acquisition;
•cause us to record impairment charges associated with goodwill and other acquired intangible assets; and
•cause other unforeseen operating difficulties and expenditures.
Moreover, to pay for an acquisition or investment, we would have to use cash, incur debt and/or issue equity securities, each of which may affect our financial condition or the value of our Class A common stock and (in the case of equity financing) could result in dilution to our stockholders.
In addition, a failure to successfully integrate the operations, personnel, or technologies of an acquired business could impact our ability to realize the full benefits of such an acquisition. Our limited experience acquiring companies increases these risks. If we are unable to achieve the anticipated strategic benefits of an acquisition or if the integration or the anticipated financial and strategic benefits, including any anticipated cost savings, revenue opportunities, or operational synergies, of such an acquisition are not realized as rapidly as or to the extent anticipated by us, our business, results of operations, and financial condition could suffer.
Our aspirations and disclosures related to environmental, social, and governance matters expose us to risks that could adversely affect our reputation and performance.
We have issued a baseline ESG report, and are in the process of determining emissions baselines and plan to set corporate goals. Our reports and statements reflect our current plans and aspirations and are not guarantees that we will be able to achieve them. Our failure to accomplish or accurately track and report on these goals on a timely basis, or at all, could adversely affect our reputation, financial performance, and growth, and expose us to increased scrutiny from the investment community as well as enforcement authorities.
Standards for tracking and reporting ESG matters continue to evolve. Our selection of voluntary disclosure frameworks and standards, and the interpretation or application of those frameworks and standards, may change from time to time or differ from those of others. This may result in a lack of consistent comparative data from period to period or between UiPath and other companies in the same industry. In addition, our processes and controls may not comply with evolving standards for identifying, measuring, and reporting ESG metrics, including ESG-related disclosures that may be required of public companies by the SEC and other regulatory agencies to which we may be subject, and such standards may change over time, which could result in significant revisions to our current goals, reported progress in achieving such goals, or ability to achieve such goals in the future.
If our ESG practices do not meet evolving investor or other stakeholder expectations and standards, our reputation, our ability to attract or retain employees, and our attractiveness as an investment, business partner, acquirer, or service provider could be negatively impacted. Further, our failure or perceived failure to pursue or fulfill our goals and objectives or to satisfy various reporting standards on a timely basis, or at all, could have similar negative impacts or expose us to government enforcement actions and private litigation.
We have undertaken, and may in the future undertake, internal restructuring activities that could result in disruptions to our business or otherwise materially harm our results of operations or financial condition.
From time to time, we have undertaken and may continue to undertake internal restructuring activities in an effort to better align our resources with our business strategy. For example, we initiated a restructuring plan in June 2022 that resulted in a reduction in our global workforce by approximately 5%, aimed at simplifying our go-to-market approach to improve market segmentation, increase sales productivity, and provide best-in-class customer experience and outcomes. In November 2022, our board of directors approved further restructuring actions to reduce our global workforce across functions by an additional 6%. We incur substantial costs to implement restructuring plans, and our restructuring activities may subject us to reputational risks and litigation risks and expenses. There can be no assurance that any restructuring activities that we have undertaken or undertake in the future will achieve the cost savings, operating efficiencies or other benefits that we may initially expect. In addition, restructuring activities may result in loss of institutional knowledge and expertise, attrition beyond our intended reduction-in-force, or a negative impact on employee morale and productivity or our ability to attract highly-skilled employees. Internal restructurings can also require a significant amount of time and focus from management and other employees, which may divert attention from commercial operations. If any internal restructuring activities we
32
have undertaken or undertake in the future fail to achieve some or all of the expected benefits, our business, results of operations, and financial condition could be materially and adversely affected.
Our business, financial condition, results of operations, or cash flows could be significantly hindered by the occurrence of a natural disaster, military action, terrorist attack, or other catastrophic event.
Our business operations may be susceptible to outages due to fire, floods, unusual weather conditions, power loss, telecommunications failures, military actions, terrorist attacks, and other events beyond our control. Natural disasters including tornados, hurricanes, floods, and earthquakes may damage the facilities of our customers or those of their suppliers or retailers or their other operations, which could lead to reduced revenue for our customers and thus reduced spending on our platform and products. In addition, a substantial portion of our operations rely on support from our headquarters in New York City and our office in Bucharest, Romania. To the extent that fire, floods, unusual weather conditions, power loss, telecommunications failures, military actions, terrorist attacks, and other events beyond our control materially impacts our ability to operate those offices, it may have a material impact on our business operations as a whole.
To the extent that such events disrupt our business or the business of our current or prospective customers, or adversely impact our reputation, such events could adversely affect our business, financial condition, results of operations, and cash flows.
Any future litigation against us could be costly and time-consuming to defend.
We are and may in the future become subject to legal proceedings and claims that arise in the ordinary course of business, such as claims brought by our customers in connection with commercial disputes or employment claims made by our current or former employees. Litigation might result in substantial costs and may divert management’s attention and resources, which might seriously harm our business, financial condition, and results of operations. Insurance might not cover such claims, might not provide sufficient payments to cover all the costs to resolve one or more such claims, and might not continue to be available on terms acceptable to us. A claim brought against us that is uninsured or underinsured could result in unanticipated costs, potentially harming our business, financial condition, and results of operations.
Pursuant to the terms of our outstanding indebtedness, we may be limited in our ability to incur future debt.
In October 2020, we entered into the Credit Facility with HSBC Ventures USA Inc., Silicon Valley Bank, Sumitomo Mitsui Banking Corporation, and Mizuho Bank, LTD. Our obligations under the Credit Facility are secured by substantially all of our assets, except for our intellectual property. As of January 31, 2023 and 2022, there were no amounts outstanding under the Credit Facility. Although we had a banking relationship with Silicon Valley Bank as of March 10, 2023, we did not experience any adverse impact to our liquidity or to our current and projected business operations, financial condition, or results of operations as a result of the closure of Silicon Valley Bank on March 10, 2023.
Pursuant to the terms of the Credit Facility, we are limited in our ability to incur additional indebtedness other than on the terms and conditions thereof. In addition, a failure to comply with the covenants under the Credit Facility could result in an event of default by us and an acceleration of amounts due. If an event of default occurs that is not waived by the lenders, and the lenders accelerate any amounts due, we may not be able to make accelerated payments, and the lender could seek to enforce their security interests in the collateral securing such indebtedness, which could have a material adverse effect on our business and results of operations.
Risks Related to Data Privacy and Cybersecurity
We are subject to stringent and changing obligations related to data privacy and security, including laws, regulations and standards, information security policies, and contractual obligations. Our actual or perceived failure to comply with such obligations could lead to regulatory investigations or actions; litigation; fines and penalties; disruptions of our business operations; reputational harm; loss of revenue or profits; loss of customers or sales; and other adverse business consequences.
In the ordinary course of business, we collect, receive, access, generate, transfer, store, disclose, share, make accessible, protect, secure, dispose of, use, and otherwise process personal data and other sensitive
33
information, including proprietary and confidential business data, trade secrets, intellectual property, sensitive third- party data about employees, contractors, customers, suppliers, and others. Our data processing activities subject us to numerous data privacy and security obligations, such as various laws, codes, regulations, industry standards, external and internal privacy and security policies, contracts, and other obligations that govern the processing of personal data by us and on our behalf.
In the U.S., federal, state, and local governments have enacted numerous data privacy and security laws, including data breach notification laws, personal data privacy laws, and consumer protection laws (e.g., Section 5 of the Federal Trade Commission Act), and other similar laws (e.g., wiretapping laws). The CCPA applies to personal information of consumers, business representatives, and employees, and requires businesses to provide specific disclosure in privacy notices and honor requests of California residents to exercise certain privacy rights. The CCPA provides for civil penalties of up to $7,500 per violation and allows private litigants affected by certain data breaches to recover significant statutory damages. In addition, the CPRA expands the CCPA’s requirements, including by establishing a new California Privacy Protection Agency to implement and enforce the law and adding a new right for individuals to correct their personal information. In addition, data privacy and security laws have been proposed at the federal, state, and local levels in recent years, which could further complicate compliance efforts. For example, Virginia, Colorado, Utah, and Connecticut have similarly enacted comprehensive privacy laws, effective in 2023.
Outside the U.S., an increasing number of laws, regulations, and industry standards apply to data privacy and security. The EU GDPR, the U.K. GDPR, Brazil’s LGPD, and China’s PIPL impose strict requirements for processing personal data. Under the EU GDPR, government regulators may impose temporary or definitive bans on data processing, as well as fines of up to 20 million euros or 4% of annual global revenue, whichever is greater; or private litigation related to processing of personal data brought by classes of data subjects or consumer protection organizations authorized by law to represent their interest. Furthermore, in Europe, there is a proposed regulation related to AI that, if adopted, could impose onerous obligations related to the use of AI-related systems. We may have to change our business practices to comply with such obligations. In Canada, PIPEDA and various related provincial laws, as well as CASL, applies to our operations. As another example, the LGPD applies to our operations. The LGPD broadly regulates processing personal data of individuals in Brazil and imposes compliance obligations and penalties comparable to those of the EU GDPR. We also target customers in Asia and have operations in Japan, Singapore, India, Hong Kong, and Australia and are subject to new and emerging data privacy regimes in Asia, including China’s PIPL, Japan’s Act on the Protection of Personal Information, and Singapore’s Personal Data Protection Act. In addition, privacy advocates and industry groups have proposed, and may propose, standards with which we are legally or contractually bound to comply.
Certain jurisdictions have enacted data localization laws and cross-border personal data transfer laws, which could make it more difficult to transfer information across jurisdictions (such as transferring or receiving personal data that originates in the EU or in other foreign jurisdictions). Existing mechanisms that facilitate cross-border personal data transfers may change or be invalidated. For example, absent appropriate safeguards or other circumstances, the EU GDPR generally restricts the transfer of personal data to countries outside of the EEA that the European Commission does not consider to provide an adequate level of data privacy and security, such as the U.S. The European Commission released a set of SCCs that are designed to be a valid mechanism to facilitate personal data transfers out of the EEA to these jurisdictions. Currently, these SCCs are a valid mechanism to transfer personal data outside of the EEA, but there exists some uncertainty regarding whether the SCCs will remain a valid mechanism. Additionally, the SCCs impose additional compliance burdens, such as conducting transfer impact assessments to determine whether additional security measures are necessary to protect the at-issue personal data. Some European regulators have ordered certain companies to suspend or permanently cease certain transfers out of Europe for allegedly violating the GDPR's cross-border data transfer limitations.
In addition, Switzerland and the U.K. similarly restrict personal data transfers outside of those jurisdictions to countries such as the U.S. that do not provide an adequate level of personal data protection, and certain countries outside Europe (e.g. Russia, China, Brazil) have also passed or are considering laws requiring local data residency, or otherwise impeding the transfer of personal data across borders, any of which could increase the cost and complexity of doing business. If we cannot implement a valid compliance mechanism for cross-border data transfers, we may face increased exposure to regulatory actions, substantial fines, and injunctions against processing or transferring personal data from Europe or other foreign jurisdictions. The inability to import personal data to the U.S. could significantly and negatively impact our business operations, including by limiting our ability to collaborate with parties that are subject to such cross-border data transfer or localization laws, by or requiring us to increase our personal data processing capabilities and infrastructure in foreign jurisdictions at significant expense.
34
Our obligations related to data privacy and security are quickly changing in an increasingly stringent fashion, creating some uncertainty as to the effective future legal framework. Use and development of AI and ML systems is also an area of developing laws, rules, and regulations. Additionally, these obligations may be subject to differing applications and interpretations, which may be inconsistent or conflict among jurisdictions. Preparing for and complying with these obligations requires significant resources and may necessitate changes to our information technologies, systems, and practices and to those of any third parties that process personal data on our behalf. In addition, these obligations may require us to change our business model.
Our business model materially depends on our ability to process personal data, so we are particularly exposed to the risks associated with the rapidly changing legal landscape. For example, we may be at heightened risk of regulatory scrutiny, and any changes in the regulatory framework could require us to fundamentally change our business model. Moreover, despite our efforts, our personnel or third parties upon whom we rely may fail to comply with such obligations, which could negatively impact our business operations and compliance posture. For example, any failure by a third-party processor to comply with applicable laws, regulations, or contractual obligations could result in adverse effects, including inability to or interruption in our ability to operate our business and proceedings against us by governmental entities or others.
If we fail, or are perceived to have failed, to address or comply with data privacy and security obligations, we could face significant consequences. These consequences may include, but are not limited to, government enforcement actions (e.g., investigations, fines, penalties, audits, inspections, and similar); litigation (including class- related claims); additional reporting requirements and/or oversight; bans on processing personal data; orders to destroy or not use personal data; and imprisonment of company officials. Any of these events could have a material adverse effect on our reputation, business, or financial condition, including but not limited to: loss of customers; interruptions or stoppages in our business operations (including, interruptions or stoppages of data collection needed to train our algorithms); inability to process personal data or to operate in certain jurisdictions; limited ability to develop or commercialize our products; expenditure of time and resources to defend any claim or inquiry; adverse publicity; or revision or restructuring of our operations.
Additionally, we publish privacy policies and other documentation regarding our processing of personal data. Although we endeavor to comply with our privacy policies and other data protection obligations, we may at times fail to do so or may be perceived to have failed to do so. Moreover, despite our efforts, we may not be successful in achieving compliance if our employees, contractors, service providers, or vendors fail to comply with our published policies and documentation. Such failures can subject us to potential foreign, federal, state, and local action if they are found to be deceptive, unfair, or misrepresentative of our actual practices. Claims that we have violated individuals’ privacy rights or failed to comply with privacy policies and other data protection obligations, even if we are not found liable, could be expensive and time-consuming to defend and could result in adverse publicity that could harm our business. We are also bound by contractual obligations related to data privacy and security (including related to industry standards ), and our efforts to comply with such obligations may not be successful. For example, certain privacy laws, such as the GDPR and the CCPA, require our customers to impose specific contractual restrictions on their service providers. Additionally, some of our customer contracts require us to host personal data locally.
We have in the past received and may in the future receive inquiries from or be subject to investigations by data protection authorities regarding, among other things, our privacy, data protection, and information security practices. We have been subject to investigations by regulators in Romania and Turkey in connection with a security incident affecting our information technology systems in 2020; however, we have remediated the incident and notified all affected individuals and relevant data protection authorities as required under applicable privacy laws. While we do not consider this to be a material event, the investigations are still ongoing. The result of these investigations could impact our brand reputation, subject us to monetary remedies and costs, interrupt or require us to change our business practices, divert resources and the attention of management from our business, or subject us to other remedies that adversely affect our business.
If our information technology systems or data, or those of third parties upon which we rely, are or were compromised, we could experience adverse consequences resulting from such compromise, including but not limited to regulatory investigations or actions; litigation; fines and penalties; disruptions
35
of our business operations; reputational harm; loss of revenue or profits; loss of customers or sales; and other adverse consequences.
In the ordinary course of our business, we may process proprietary, confidential, and sensitive data, including personal data, intellectual property, and trade secrets. We may rely on third-party service providers, sub-processors, and technologies to operate critical business systems to process sensitive information in a variety of contexts, including without limitation, third-party providers of cloud-based infrastructure, encryption and authentication technology, employee email, content delivery to customers, and other functions. Our ability to monitor these third parties’ information security practices is limited, and these third parties may not have adequate information security measures in place. We may share or receive sensitive information with or from third parties. If our third-party service providers experience a security incident or other interruption, we could experience adverse consequences. While we may be entitled to damages if our third-party service providers fail to satisfy their privacy or security-related obligations to us, any award may be insufficient to cover our damages, or we may be unable to recover such award.
Cyberattacks, malicious internet-based activity, and online and offline fraud are prevalent and continue to increase. These threats come from a variety of sources, including traditional computer “hackers,” threat actors, "hacktivists," organized criminal threat actors, personnel (such as employee theft or misuse), and sophisticated nation-state and nation-state supported actors. We and the third parties upon which we rely may be subject to a variety of evolving threats, including but not limited to social-engineering attacks (including through phishing attacks), malicious code (such as viruses and worms), malware (including as a result of advanced persistent threat intrusions), denial-of-service attacks (such as credential stuffing), credential harvesting, personnel misconduct or error, ransomware attacks, supply-chain attacks, software bugs, server malfunctions, software or hardware failures, loss of data or other information technology assets, adware, telecommunications failures, and other similar threats. Some actors now engage and are expected to continue to engage in cyberattacks, including without limitation nation-state actors for geopolitical reasons and in conjunction with military conflicts and defense activities. During times of war and other major conflicts, we, the third-party service providers upon which we rely, and our customers may be vulnerable to a heightened risk of these attacks, including retaliatory cyberattacks, that could materially disrupt our systems and operations, supply chain, and ability to produce, sell, and distribute our goods and services.
Ransomware attacks have become increasingly prevalent and severe and can lead to significant interruptions in our operations, loss of data and income, reputational harm, and diversion of funds. Extortion payments may alleviate the negative impact of a ransomware attack, but we may be unwilling or unable to make such payments due to, for example, applicable laws or regulations prohibiting such payments. Similarly, supply-chain attacks have increased in frequency and severity, and we cannot guarantee that third parties and infrastructure in our supply chain or our third-party partners’ supply chains have not been compromised or that they do not contain exploitable defects or bugs that could result in a breach of or disruption to our information technology systems (including our products/services) or the third- party information technology systems that support us and our services.
We are incorporated into the supply chain of a large number of companies worldwide and, as a result, if our solutions are compromised, a significant number of companies could be simultaneously affected. The potential liability and associated consequences we could suffer as a result of such a large-scale event could be catastrophic and result in irreparable harm. Remote work has become more common and has increased risks to our information technology systems and data, as more of our employees utilize network connections, computers and devices outside our premises or network, including working at home, while in transit, and in public locations. Future business transactions (such as acquisitions or integrations) could expose us to additional cybersecurity risks and vulnerabilities, as our systems could be negatively affected by vulnerabilities present in acquired or integrated entities’ systems and technologies. Furthermore, we may discover security issues that were not found during due diligence of such acquired or integrated entities, and it may be difficult to integrate companies into our information technology environment and security program. Any of the previously identified or similar threats could cause a security incident or other interruption. A security incident or other interruption could result in unauthorized, unlawful, or accidental acquisition, modification, destruction, loss, alteration, encryption, disclosure of, or access to our sensitive information. A security incident or other interruption could disrupt our ability (and that of third parties upon whom we rely) to provide our platform.
While we have implemented security measures designed to protect against security incidents, there can be no assurance that these measures will be effective. While we take steps to detect and remediate vulnerabilities, we may be unable in the future to detect vulnerabilities in our information technology systems because such threats and techniques change frequently, are often sophisticated in nature, and may not be detected until after a security incident has occurred. Despite our efforts to identify and remediate vulnerabilities, if any, in our information
36
technology systems (including our products), our efforts may not be successful. These vulnerabilities may pose material risks to our business. Further, we may experience delays in developing and deploying remedial measures designed to address any such identified vulnerabilities.
Applicable data privacy and security obligations may require us to notify relevant stakeholders of security incidents. Such disclosures are costly, and the disclosures or the failure to comply with such requirements could lead to adverse consequences. If we (or a third party upon whom we rely) experience a security incident or are perceived to have experienced a security incident, we may experience adverse consequences. These consequences may include: government enforcement actions (for example, investigations, fines, penalties, audits, and inspections); additional reporting requirements and/or oversight; restrictions on processing sensitive information (including personal data); litigation (including class claims); indemnification obligations; negative publicity; reputational harm; monetary fund diversions; interruptions in our operations (including availability of data); financial loss; and other similar harms. Security incidents and attendant consequences may cause customers to stop using our platform and products, deter new customers from using our platform and products, and negatively impact our ability to grow and operate our business. A security breach may cause us to breach customer contracts. Our agreements with certain customers may require us to use industry-standard or reasonable measures to safeguard personal information. We also may be subject to laws that require us to use industry-standard or reasonable security measures to safeguard personal information. Our contracts may not contain limitations of liability, and even when they do, there can be no assurance that limitations of liability in our contracts are sufficient to protect us from liabilities, damages, or claims related to our data privacy and security obligations. A security breach could lead to claims by our customers or other relevant stakeholders that we have failed to comply with such legal or contractual obligations. As a result, we could be subject to legal action or our customers could end their relationships with us. There can be no assurance that the limitations of liability in our contracts would be enforceable or adequate or would otherwise protect us from liabilities or damages, and in some cases our customer agreements do not limit our remediation costs or liability with respect to data breaches.
Litigation resulting from security breaches may adversely affect our business. Unauthorized access to our platform, systems, networks, or physical facilities, or those of our vendors, could result in litigation with our customers or other relevant stakeholders. These proceedings could force us to spend money in defense or settlement, divert management’s time and attention, increase our costs of doing business, or adversely affect our reputation. We could be required to fundamentally change our business activities and practices or modify our products and/or platform capabilities in response to such litigation, which could have an adverse effect on our business. If a security breach were to occur and the confidentiality, integrity, or availability of personal information was disrupted, we could incur significant liability or our platform, systems, or networks may be perceived as less desirable, which could negatively affect our business and damage our reputation.
We may not have adequate insurance coverage for security incidents or breaches. The successful assertion of one or more large claims against us that exceeds our available insurance coverage or results in changes to our insurance policies (including premium increases or the imposition of large deductible or co-insurance requirements) could have an adverse effect on our business. In addition, we cannot be sure that our existing insurance coverage and coverage for errors and omissions will continue to be available on acceptable terms or that our insurers will not deny coverage as to any future claim.
Risks Related to Regulatory Compliance and Governmental Matters
We are subject to anti-corruption, anti-bribery, anti-money laundering, and similar laws, and noncompliance with such laws can subject us to criminal or civil liability and harm our business, financial condition, and results of operations.
We are subject to the U.S. FCPA, U.S. domestic bribery laws, the United Kingdom Bribery Act, and other anti-corruption and anti-money laundering laws in the countries in which we conduct activities. Due to the international scope of our operations, we must comply with these laws in each jurisdiction where we operate. Additionally, many anti-bribery and anti-corruption laws, including the FCPA, have long-arm statutes that can expand the applicability of these laws to our operations worldwide. Accordingly, we must incur significant operational costs to support our ongoing compliance with anti-bribery and anti-corruption laws at all levels of our business. If we fail to comply with these laws we may be subject to significant penalties. Anti-corruption and anti-bribery laws have been enforced aggressively in recent years and are interpreted broadly to generally prohibit companies, their employees, and their third-party intermediaries from authorizing, offering, or providing, directly or indirectly, improper payments or benefits to recipients in the public or private sector. As we increase our international sales and business and sales to the
37
public sector, we may engage with business partners and third-party intermediaries to market our products and to obtain necessary permits, licenses, and other regulatory approvals. In addition, we or our third-party intermediaries may have direct or indirect interactions with officials and employees of government agencies or state-owned or affiliated entities. We can be held liable for the corrupt or other illegal activities of these third-party intermediaries, our employees, representatives, contractors, partners, and agents, even if we do not explicitly authorize such activities.
While we have policies and procedures to address compliance with such laws, we cannot assure you that all of our employees and agents will not take actions in violation of our policies and applicable law, for which we may be ultimately held responsible. As we increase our international sales and business, our risks under these laws may increase.
Detecting, investigating, and resolving actual or alleged violations of anti-corruption laws can require a significant diversion of time, resources, and attention from senior management. In addition, noncompliance with anti-corruption, anti-bribery, or anti-money laundering laws could subject us to whistleblower complaints, investigations, sanctions, settlements, prosecution, enforcement actions, fines, damages, other civil or criminal penalties or injunctions, suspension or debarment from contracting with certain persons, reputational harm, adverse media coverage, and other collateral consequences. If any subpoenas or investigations are launched, or governmental or other sanctions are imposed, or if we do not prevail in any possible civil or criminal proceeding, our business, financial condition, and results of operations could be harmed. In addition, responding to any action will likely result in a materially significant diversion of management’s attention and resources and significant defense costs and other professional fees.
Sales to government entities and highly regulated organizations are subject to a number of challenges and risks.
We currently sell, and anticipate continuing to sell, to U.S. federal, state, and local, and foreign governmental agency customers, as well as to customers in highly regulated industries such as financial services and healthcare. Sales to such customers are subject to a number of challenges and risks. Selling to such customers can be highly competitive, expensive, and time-consuming, often requiring significant upfront time and expense without any assurance that these efforts will generate a sale. These current and prospective customers may also be required to comply with stringent regulations in connection with purchasing and implementing our platform and products or particular regulations regarding third-party vendors that may be interpreted differently by different customers. In addition, regulatory agencies may impose requirements on third-party vendors generally, or our company in particular, that we may not be able to or may not choose to meet. In addition, government customers and customers in these highly regulated industries often have a right to conduct audits of our systems, products, and practices. In the event that one or more customers determine that some aspect of our business does not meet regulatory requirements, we may be limited in our ability to continue or expand our business. In addition, if our platform and products do not meet the standards of new or existing regulations, we may be in breach of our contracts with these customers, allowing them to terminate their agreements.
Government contracting requirements may also change and in doing so restrict our ability to sell into the government sector until we have attained the requisite approvals. Government demand and payment for our products are affected by public sector budgetary cycles and funding authorizations, with funding reductions or delays adversely affecting public sector demand for our products.
These customers may also be subject to a rapidly evolving regulatory framework that may impact their ability to use our platform and products. Moreover, changes in the underlying statutory and regulatory conditions that affect these types of customers could harm our ability to efficiently provide them access to our platform and to grow or maintain our customer base. If we are unable to enhance our platform and products to keep pace with evolving customer requirements, or if new technologies emerge that are able to deliver competitive products at lower prices, more efficiently, more conveniently, or more securely than our platform, our business, financial condition, and results of operations could be adversely affected.
Further, governmental and highly regulated entities may demand contract terms that differ from our standard arrangements and are less favorable than terms agreed with private sector customers, including preferential pricing or “most favored nation” terms and conditions or contract provisions that are otherwise time-consuming and expensive to satisfy. In the U.S., applicable federal contracting regulations change frequently, and the President may issue executive orders requiring federal contractors to adhere to new compliance requirements after a contract
38
is signed. If we undertake to meet special standards or requirements and do not meet them, we could be subject to significant liability from our customers or regulators. Even if we do meet these special standards or requirements, the additional costs associated with providing our platform to government and highly regulated customers could harm our results of operations. In addition, engaging in sales activities to foreign governments introduces additional compliance risks specific to the FCPA, the United Kingdom Bribery Act, and other similar statutory requirements prohibiting bribery and corruption in the jurisdictions in which we operate.
Such entities may have statutory, contractual, or other legal rights to terminate contracts with us or our partners for convenience or for other reasons. Any such termination may adversely affect our ability to contract with other government customers as well as our reputation, business, financial condition, and results of operations.
We are subject to governmental export and import controls that could impair our ability to compete in international markets or subject us to liability if we violate the controls.
Our business activities are subject to various export, import, and trade and economic sanction laws and regulations, including, among others, the U.S. Export Administration Regulations, administered by the U.S. Department of Commerce’s Bureau of Industry and Security, and economic and trade sanctions regulations maintained by the U.S. Department of the Treasury’s Office of Foreign Assets Control, which we refer to collectively as Trade Controls. Trade Controls may prohibit or restrict the sale or supply of certain products, including encryption items and other technology, and services to certain governments, persons, entities, countries, and territories, including those that are the target of comprehensive sanctions.
While we have implemented controls designed to promote and achieve compliance with applicable Trade Controls, our platform and products may have been provided in the past, and could in the future, be provided in violation of such laws, despite the precautions we take. Any failure to comply with applicable Trade Controls may materially affect us through reputational harm, as well as other negative consequences, including government investigations and penalties. Accordingly, we must incur significant operational costs to support our ongoing compliance with Trade Controls at all levels of our business.
Also, various countries in addition to the U.S. have enacted Trade Controls that could limit our ability to distribute our platform and products or could limit our customers’ ability to implement our platform and products in those countries. Changes in our platform or products or future changes in Trade Controls may create delays in the introduction of our platform and products in international markets or, in some cases, prevent the export or import of our platform and products to certain countries, governments, or persons altogether. Any change in Trade Controls could result in decreased use of our platform and products by, or decrease in our ability to export or sell our platform and products to, existing or potential customers. Any decreased use of our platform or products or limitation on our ability to export or sell our platform and products would adversely affect our business, results of operations, and growth prospects.
The evolving geopolitical situation in Ukraine has resulted in Trade Controls being implemented by the U.S., the United Kingdom, the EU, Australia, and Japan and other countries against officials, individuals, entities, regions, and industries in Russia, Ukraine, and Belarus, as well as counter sanctions by Russia. Such Trade Controls and any further restrictions that may be promulgated by relevant governmental authorities could adversely affect our business. See "—Risks Related to Our Business, Products, Operations, and Industry—The Russian military action in Ukraine may produce near and longer term economic and geopolitical disruption which may harm our business." for additional information.
Risks Related to Our Intellectual Property
Any failure to obtain, maintain, protect, or enforce our intellectual property and proprietary rights could impair our ability to protect our proprietary technology and our brand.
Our success depends to a significant degree on our ability to obtain, maintain, protect, and enforce our intellectual property rights, including our proprietary technology, know-how, and our brand. We rely on a combination of trademarks, trade secret laws, patents, copyrights, service marks, contractual restrictions, and other intellectual property laws and confidentiality procedures to establish and protect our proprietary rights. However, the steps we take to obtain, maintain, protect, and enforce our intellectual property rights may be inadequate. We may not be able to protect our intellectual property rights if, for example, we are unable to enforce our rights against infringement or misappropriation, or if we do not detect unauthorized use of our intellectual property rights. If we fail to protect our intellectual property rights adequately, our competitors may gain access to our proprietary technology
39
and develop and commercialize substantially identical products, services, or technologies and our business, financial condition, results of operations, or prospects may be harmed.
In addition, defending our intellectual property rights may entail significant expense. Any patent, trademark, or other intellectual property rights that we have or may obtain may be challenged or circumvented by others or invalidated or held unenforceable through administrative processes, including re-examination, inter partes review, interference, and derivation proceedings and equivalent proceedings in foreign jurisdictions (e.g., opposition, invalidation, and cancellation proceedings), or litigation. Moreover, there can be no assurance that our pending patent applications will result in issued patents. Even if we continue to seek patent protection in the future, we may be unable to obtain or maintain patent protection for our technology. In addition, any patents issued from pending or future patent applications or licensed to us in the future may not be sufficiently broad to protect our proprietary technologies, may not provide us with competitive advantages, or may be successfully challenged by third parties. The U.S. Patent and Trademark Office and various foreign governmental patent and trademark agencies also require compliance with a number of procedural, documentary, fee payment, and other similar provisions during the patent and trademark application process and after a patent or trademark registration has issued. There are situations in which noncompliance can result in abandonment or lapse of the patent, patent application, or trademark filing, resulting in partial or complete loss of patent or trademark rights in the relevant jurisdiction. If this occurs, our competitors might be able to enter the market.
Furthermore, legal standards relating to the validity, enforceability, and scope of protection of intellectual property rights are uncertain. Despite our precautions, it may be possible for unauthorized third parties to copy our brands, products, and platform capabilities, and use information that we regard as proprietary to create brands and products that compete with ours. Effective patent, trademark, copyright, and trade secret protection may not be available to us or commercially feasible in every country in which our products are available. Further, intellectual property law, including statutory and case law, particularly in the U.S., is constantly developing, and any changes in the law could make it harder for us to enforce our rights. The value of our intellectual property could diminish if others assert rights in or ownership of our trademarks, patents, and other intellectual property rights, or adopt trademarks that are similar to our trademarks. We may be unable to successfully resolve these types of conflicts to our satisfaction. In some cases, as noted below, litigation or other actions may be necessary to protect or enforce our trademarks, patents, and other intellectual property rights against infringement or misappropriation. As we expand our international activities, our exposure to unauthorized copying and use of our products and platform capabilities and proprietary information will likely increase. Moreover, policing unauthorized use of our technologies, trade secrets, and intellectual property may be difficult, expensive, and time-consuming, particularly in foreign countries where the laws may not be as protective of intellectual property rights as those in the U.S. and where mechanisms for enforcement of intellectual property rights may be weak or inadequate. Accordingly, despite our efforts, we may be unable to prevent third parties from infringing upon, misappropriating, or otherwise violating our intellectual property rights. Any of the foregoing could adversely impact our business, financial condition, and results of operations.
We may become subject to intellectual property disputes, which are costly and may subject us to significant liability and increased costs of doing business.
We are from time-to-time subject to intellectual property disputes. Our success depends, in part, on our ability to develop and commercialize our products and services without infringing, misappropriating, or otherwise violating the intellectual property rights of third parties. However, we may not be aware that our products or services are infringing, misappropriating, or otherwise violating third-party intellectual property rights, and such third parties may bring claims alleging such infringement, misappropriation, or violation. As one example, there may be issued patents of which we are not aware, held by third parties that, if found to be valid and enforceable, could be alleged to be infringed by our current or future technologies or products. There also may be pending patent applications of which we are not aware that may result in issued patents, which could be alleged to be infringed by our current or future technologies or products. Because patent applications can take years to issue and are often afforded confidentiality for some period of time there may currently be pending applications, unknown to us, that later result in issued patents that could cover our current or future technologies or products.
Lawsuits can be time-consuming and expensive to resolve and can divert management’s time and attention. The software industry in which we operate is characterized by the existence of a large number of patents, copyrights, trademarks, trade secrets, and other intellectual and proprietary rights. Companies in the software industry are often required to defend against litigation claims based on allegations of infringement, misappropriation, or other violations of intellectual property rights. Our technologies may not be able to withstand any third-party
40
claims against their use. In addition, many companies have the capability to dedicate substantially greater resources to enforce their intellectual property rights and to defend claims that may be brought against them, than we can. In a patent infringement claim against us, we may assert as a defense that we do not infringe the relevant patent claims, that the patent is invalid, or both. The strength of our defenses may depend on the patents asserted, the interpretation of these patents, or our ability to invalidate the asserted patents. However, we could be unsuccessful in advancing non-infringement and/or invalidity arguments in our defense. In the U.S., issued patents enjoy a presumption of validity, and the party challenging the validity of a patent claim must present clear and convincing evidence of invalidity, which is a high burden of proof. Conversely, the patent owner need only prove infringement by a preponderance of the evidence, which is a lower burden of proof. We do not currently have a large number of issued patents, which could prevent us from deterring patent infringement claims through our own patent portfolio, and our competitors and others may now and in the future have significantly larger and more mature patent portfolios than we have. Any litigation may also involve patent holding companies or other adverse patent owners that have no relevant product revenue, and therefore, our patents may provide little or no deterrence as we would not be able to assert them against such entities or individuals.
An adverse result in any infringement or misappropriation proceeding could subject us to significant damages, injunctions, and reputational harm. If a third party is able to obtain an injunction preventing us from accessing such third-party intellectual property rights, or if we cannot license or develop alternative technology for any infringing aspect of our business, we may be forced to limit or stop sales of our relevant products and platform capabilities or cease business activities related to such intellectual property. Although we carry general liability and intellectual property insurance, our insurance may not cover potential claims of this type or may not be adequate to indemnify us for all liability that may be imposed. We cannot predict the outcome of lawsuits and cannot ensure that the results of any such actions will not have an adverse effect on our business, financial condition, or results of operations. Any intellectual property litigation to which we might become a party, or for which we are required to provide indemnification, may require us to do one or more of the following:
•cease selling or using products or services that incorporate the intellectual property rights that we allegedly infringe, misappropriate, or violate;
•make substantial payments for legal fees, settlement payments, or other costs or damages;
•obtain a license, which may not be available on reasonable terms or at all, to sell or use the relevant technology;
•redesign the allegedly infringing products to avoid infringement, misappropriation, or violation, which could be costly, time-consuming, or impossible;
•rebrand our products and services and/or be prevented from selling some of our products or services if third parties successfully oppose or challenge our trademarks or successfully claim that we infringe, misappropriate, or otherwise violate their trademarks or other intellectual property rights; and
•limit the manner in which we use our brands, or prevent us from using our brands in particular jurisdictions.
Even if the claims do not result in litigation or are resolved in our favor, these claims, and the time and resources necessary to resolve them, could divert the resources of our management and harm our business and results of operations. Moreover, there could be public announcements of the results of hearings, motions, or other interim proceedings or developments and if securities analysts or investors perceive these results to be negative, it could have a substantial adverse effect on the price of our Class A common stock. The occurrence of infringement and misappropriation claims may grow as the market for our platform and products grows. Accordingly, our exposure to damages resulting from infringement claims could increase and this could further exhaust our financial and management resources. Any of the foregoing could adversely impact our business, financial condition, and results of operations.
We may become involved in lawsuits to protect or enforce our intellectual property, which could be expensive, time consuming, and unsuccessful.
Third parties, including our competitors, could be infringing, misappropriating, or otherwise violating our intellectual property rights, and we may be required to spend significant resources to monitor and protect those rights. Litigation may be necessary in the future to enforce our intellectual property rights and to protect our trade secrets. Litigation brought to protect and enforce our intellectual property rights could be costly, time-consuming, and distracting to management, and could result in the impairment or loss of portions of our intellectual property.
41
Further, our efforts to enforce our intellectual property rights may be met with defenses, counterclaims, and countersuits attacking the validity and enforceability of our intellectual property rights and if such defenses, counterclaims, or countersuits were successful, we could lose valuable intellectual property rights. An adverse determination of any litigation proceedings could put our intellectual property at risk of being invalidated or interpreted narrowly and could put our related patents, patent applications, and trademark filings at risk of being invalidated, not issued, or cancelled. Furthermore, because of the substantial amount of discovery required in connection with intellectual property litigation, there is a risk that some of our confidential or sensitive information could be compromised by disclosure in the event of litigation. In addition, during the course of litigation there could be public announcements of the results of hearings, motions, or other interim proceedings or developments. If securities analysts or investors perceive these results to be negative, it could have a substantial adverse effect on the price of our Class A common stock. Our inability to protect our proprietary technology against unauthorized copying or use, as well as any costly litigation or diversion of our management’s attention and resources, could delay further sales or the implementation of our products and platform capabilities, impair the functionality of our products and platform capabilities, delay introductions of new solutions, result in our substituting inferior or more costly technologies into our products, or injure our reputation. Any of the foregoing could adversely impact our business, financial condition, and results of operations.
If we are unable to protect the confidentiality of our trade secrets, our business and competitive position would be harmed.
We rely heavily on trade secrets and confidentiality agreements to protect our unpatented know-how, technology, and other proprietary information and to maintain our competitive position. However, trade secrets and know-how can be difficult to protect. We seek to protect these trade secrets and other proprietary technology, in part, by entering into non-disclosure and confidentiality agreements with parties who have access to them, such as our employees, consultants, and other third parties, including suppliers and other partners. However, we cannot guarantee that we have entered into such agreements with each party that has or may have had access to our proprietary information, know-how, and trade secrets. Moreover, no assurance can be given that these agreements will be effective in controlling access to, distribution, use, misuse, misappropriation, reverse engineering, or disclosure of our proprietary information, know-how, and trade secrets. Further, these agreements may not prevent our competitors from independently developing technologies that are substantially equivalent or superior to our products and platform capabilities. These agreements may be breached, and we may not have adequate remedies for any such breach. For example, past employees have sought to misappropriate source code relevant to certain of our products. While we have taken steps to enjoin misappropriation that we are aware of, such steps may not ultimately be successful and we may not be aware of all such misappropriation. Any of the foregoing could adversely impact our business, financial condition, and results of operations.
We may be subject to claims that our employees, consultants, or advisors have wrongfully used or disclosed alleged trade secrets of their current or former employers or claims asserting ownership of what we regard as our own intellectual property.
Many of our employees and consultants are currently or were previously employed at other companies in our field, including our competitors or potential competitors. Although we try to ensure that our employees and consultants do not use the proprietary information or know-how of others in their work for us, we may be subject to claims that we or these individuals have used or disclosed intellectual property, including trade secrets or other proprietary information, of any such individual’s current or former employer. Litigation may be necessary to defend against these claims. If we fail in defending any such claims, in addition to paying monetary damages, we may lose valuable intellectual property rights or personnel. Even if we are successful in defending against such claims, litigation could result in substantial costs and be a distraction to management.
In addition, while it is our policy to require our employees and contractors who may be involved in the conception or development of intellectual property to execute agreements assigning such intellectual property to us, we may be unsuccessful in executing such an agreement with each party who, in fact, conceives or develops intellectual property that we regard as our own. The assignment of intellectual property rights may not be self-executing, or the assignment agreements may be breached, and we may be forced to bring claims against third parties, or defend claims that they may bring against us, to determine the ownership of what we regard as our intellectual property. Any of the foregoing could adversely impact our business, financial condition, and results of operations.
42
We use open source software in our products, which could negatively affect our ability to sell our services or subject us to litigation or other actions.
We use open source software in our products and we expect to continue to incorporate open source software into our products in the future. Few of the licenses applicable to open source software have been interpreted by courts, and there is a risk that these licenses could be construed in a manner that could impose unanticipated conditions or restrictions on our ability to commercialize our products. Moreover, we cannot ensure that we have not incorporated additional open source software in our products in a manner that is inconsistent with the terms of the applicable licenses or our current policies and procedures. If we fail to comply with these licenses, we may be subject to certain requirements, including requirements that we offer our products that incorporate the open source software for no cost, that we make available source code for modifications or derivative works we create based upon, incorporating, or using the open source software, and that we license such modifications or derivative works under the terms of applicable open source licenses. In addition, although we employ open source software license screening measures, if we were to combine our proprietary software products with open source software in a certain manner we could, under certain open source licenses, be required to release the source code of our proprietary software products. If an author or other third party that distributes such open source software were to allege that we had not complied with the conditions of one or more of these licenses, we could be required to incur significant legal expenses defending against such allegations and could be subject to significant damages, enjoined from the sale of our products that contained the open source software, and required to comply with onerous conditions or restrictions on these products, which could disrupt the distribution and sale of these products.
From time to time, there have been claims challenging the ownership rights in open source software against companies that incorporate it into their products and the licensors of such open source software provide no warranties or indemnities with respect to such claims. As a result, we and our customers could be subject to lawsuits by parties claiming ownership of what we believe to be open source software. Litigation could be costly for us to defend, have a negative effect on our business, financial condition, and results of operations, or require us to devote additional research and development resources to change our products. Some open source projects have known vulnerabilities and architectural instabilities and are provided on an “as-is” basis, which, if not properly addressed, could negatively affect the performance of our product. If we inappropriately use or incorporate open source software subject to certain types of open source licenses that challenge the proprietary nature of our products, we may be required to re-engineer such products, discontinue the sale of such products, or take other remedial actions, any of which could adversely impact our business, financial condition, and results of operations.
If we cannot license rights to use technologies on reasonable terms, we may be unable to license rights that are critical to our business.
In the future we may identify additional third-party intellectual property that we may need to license in order to engage in our business, including to develop or commercialize new products or services. However, such licenses may not be available on acceptable terms or at all. The licensing or acquisition of third-party intellectual property rights is a competitive area, and more established companies may pursue strategies to license or acquire third-party intellectual property rights that we may consider attractive or necessary. These more established companies may have a competitive advantage over us due to their size, capital resources, and greater development or commercialization capabilities. In addition, companies that perceive us to be a competitor may be unwilling to assign or license rights to us. Even if such licenses were available, we might be required to pay the licensor substantial royalties based on sales of our products and services. Such royalties are a component of the cost of our products or services and may affect the margins on our products and services. If we are unable to enter into the necessary licenses on acceptable terms or at all, it could adversely impact our business, financial condition, and results of operations.
Risks Related to Our International Operations
Our current operations are international in scope, and we plan further geographic expansion, creating a variety of operational challenges.
We currently operate internationally, and a component of our growth strategy involves the further expansion of our operations and customer base internationally. Customers outside the U.S. generated 54% and 57% of our revenue for fiscal years 2023 and 2022, respectively. Beyond the U.S., we have operational presence internationally, including in Romania, the United Kingdom, and a number of other countries in Europe, Australia, Brazil, Canada, China, India, Israel, Japan, Mexico, Singapore, South Korea, Turkey, and the United Arab Emirates,
43
among others. We are continuing to adapt to and develop strategies to further address international markets, but there is no guarantee that such efforts will have the desired effect. For example, we anticipate that we will need to establish relationships with new partners in order to expand into certain countries, and if we fail to identify, establish, and maintain such relationships, we may be unable to execute on our expansion plans. As of January 31, 2023, the majority of our full-time employees were located outside of the U.S. We expect that our international activities will continue to grow for the foreseeable future as we continue to pursue opportunities in existing and new international markets, which will require significant dedication of management attention and financial resources.
Our current and future international business and operations involve a variety of risks, including:
•slower than anticipated availability to and adoption of our platform and products by international businesses;
•changes in a specific country’s or region’s political, regulatory, or economic conditions;
•the need to adapt and localize our products for specific countries;
•greater difficulty collecting accounts receivable and longer payment cycles;
•potential changes in trade relations, regulations, or laws;
•unexpected changes in laws or regulatory requirements, including tax laws and regulations;
•more stringent regulations relating to privacy and data security and the unauthorized use of or access to commercial and personal data, particularly in Europe;
•differing and potentially more onerous labor regulations, especially in Europe, where labor laws are generally more advantageous to employees as compared to the U.S., including deemed hourly wage and overtime regulations in these locations;
•challenges inherent in efficiently managing, and the increased costs associated with, an increased number of employees over large geographic distances, including the need to implement appropriate systems, policies, benefits, and compliance programs that are specific to each jurisdiction;
•difficulties in managing a business in new markets with diverse cultures, languages, customs, legal systems, alternative dispute systems, and regulatory systems;
•increased travel, real estate, infrastructure, and legal compliance costs associated with international operations;
•currency exchange rate fluctuations and the resulting effect on our revenue and expenses, and the cost and risk of entering into hedging transactions if we chose to do so in the future;
•limitations on our ability to reinvest earnings from operations in one country to fund the capital needs of our operations in other countries;
•laws and business practices favoring local competitors or general market preferences for local vendors;
•limited or insufficient intellectual property protection or difficulties obtaining, maintaining, protecting, or enforcing our intellectual property rights, including our trademarks and patents;
•political instability or terrorist activities;
•an outbreak of a contagious disease, which may cause us or our third-party providers and/or customers to temporarily suspend our or their respective operations in the affected city or country;
•exposure to liabilities under anti-corruption and anti-money laundering laws, including the FCPA, U.S. bribery laws, the United Kingdom Bribery Act, and similar laws and regulations in other jurisdictions;
•exposure to anti-competition laws in foreign jurisdictions that may conflict with or be more restrictive than similar U.S. anti-competition laws;
•adverse changes to domestic and foreign tax laws and regulations, and the requirements of foreign exchange controls, which could make it difficult to repatriate earnings and cash; and
•the impact of the Russian military action and evolving geopolitical situation in Ukraine and the near- and longer-term effects on our employees, our business, and the global economic environment.
44
Although we have taken steps designed to ensure that UiPath complies with applicable regulations including evolving U.S. and international sanctions, these steps involve additional compliance costs and operational costs. Any of these risks could adversely impact our business, financial condition, and results of operations. Failure to comply with these international regulations as they evolve could harm our business. If we invest substantial time and resources to further expand our international operations and are unable to do so successfully and in a timely manner, our business and results of operations will suffer.
Risks Related to Tax and Accounting Matters
If we fail to maintain effective internal control over financial reporting, our ability to produce timely and accurate financial statements or comply with applicable laws and regulations could be impaired.
We are subject to the reporting requirements of the Exchange Act, SOX, the rules and regulations of the New York Stock Exchange, and other securities rules and regulations that impose various requirements on public companies. Our management and other personnel devote substantial time and resources to comply with these rules and regulations. Such compliance has increased and will continue to increase our legal, accounting, and financial compliance costs and make some activities more difficult and time-consuming. SOX requires, among other things, that we maintain effective disclosure controls and procedures and internal control over financial reporting. We are continuing to refine our disclosure controls and procedures, internal control over financial reporting, and other procedures that are designed to ensure that information required to be disclosed by us in our financial statements and in the reports that we file with the SEC is recorded, processed, summarized, and reported within the time periods specified in SEC rules and forms, and that information required to be disclosed in reports under the Exchange Act is accumulated and communicated to our principal executive and financial officers.
Our current controls and any new controls we develop may become inadequate because of changes in conditions in our business. Additionally, to the extent that we acquire other businesses, the acquired company may not have a sufficiently robust system of internal controls and we may uncover new deficiencies. Weaknesses in our internal controls may be discovered in the future. Any failure to develop or maintain effective controls, or any difficulties encountered in their implementation or improvement, could harm our results of operations, may result in a restatement of our financial statements for prior periods, may cause us to fail to meet our reporting obligations, could result in an adverse opinion regarding our internal control over financial reporting from our independent registered public accounting firm, and could lead to investigations or sanctions by regulatory authorities.
Section 404 of SOX, requires our management to certify financial and other information in our quarterly and annual reports and provide an annual management report on the effectiveness of our internal control over financial reporting. We are also required to have our independent registered public accounting firm attest to, and issue an opinion on, the effectiveness of our internal control over financial reporting. If we are unable to assert that our internal control over financial reporting is effective, or if, when required, our independent registered public accounting firm is unable to express an opinion on the effectiveness of our internal control over financial reporting, we could lose investor confidence in the accuracy and completeness of our financial reports, which could cause the price of our Class A common stock to decline.
Any failure to maintain effective disclosure controls and procedures and internal control over financial reporting could have a material and adverse effect on our business and results of operations.
We are exposed to fluctuations in currency exchange rates, which affect our results of operations.
While our sales contracts are denominated predominantly in U.S. dollars, we also have sales contracts representing a large portion of our revenue denominated in foreign currencies. Therefore, a significant portion of our revenue has been and continues to be subject to fluctuations due to changes in foreign currency exchange rates. Additionally, for our foreign sales contracts denominated in U.S. dollars, a strengthening of the U.S. dollar has increased and could continue to increase the real cost of our products and platform capabilities to these customers outside of the U.S., which could adversely affect our results of operations.
Further, an increasing portion of our operating expenses are incurred outside the U.S. We conduct our business and incur costs in the local currency of most countries in which we operate. We incur currency transaction risk whenever one of our operating subsidiaries enters into either a purchase or a sales transaction using a different currency from the currency in which it operates, or holds assets or liabilities in a currency different from its functional currency. Changes in exchange rates can also affect our results of operations when the value of sales and expenses of foreign subsidiaries are translated to U.S. dollars. We cannot accurately predict the impact of future
45
exchange rate fluctuations on our results of operations. Given the volatility of exchange rates, we may not be able to effectively manage our currency risks, and any volatility in currency exchange rates may have an adverse effect on our financial condition, cash flows, and profitability.
Our corporate structure and intercompany arrangements cause us to be subject to the tax laws of various jurisdictions, and we could be obligated to pay additional taxes, which could materially adversely affect our business, financial condition, results of operations, and prospects.
Our international operations and personnel have rapidly expanded to support our business in numerous international markets. We generally conduct our international operations through directly or indirectly wholly-owned subsidiaries, and we are or may be required to report our taxable income in various jurisdictions worldwide with increasingly complex tax laws based upon our business operations in those jurisdictions. Our intercompany relationships and agreements are subject to complex transfer pricing regulations administered by tax authorities in various jurisdictions with potentially divergent tax laws. Tax authorities may disagree with tax positions that we have taken. For example, the IRS or another tax authority could challenge our allocation of income by tax jurisdiction and the amounts paid between our affiliated companies pursuant to our intercompany arrangements and transfer pricing policies, including amounts paid with respect to our intellectual property in connection with our intercompany research and development cost sharing arrangement and legal structure.
The amount of taxes we pay in different jurisdictions may depend on the application of the tax laws of the various jurisdictions, including the U.S., to our international business activities, changes in tax rates, new or revised tax laws or interpretations of existing tax laws and policies, and our ability to operate our business in a manner consistent with our corporate structure and intercompany arrangements. The authorities in these jurisdictions could review our tax returns or require us to file tax returns in jurisdictions in which we are not currently filing and could impose additional tax, interest, and penalties. In addition, the authorities could claim that various withholding requirements apply to us or our subsidiaries, assert that benefits of tax treaties are not available to us or our subsidiaries, or challenge our methodologies for valuing developed technology or intercompany arrangements, including our transfer pricing. If such a challenge or disagreement were to occur, and our position was not sustained, we could be required to pay additional taxes, interest, and penalties, which could result in one-time tax charges, higher effective tax rates, reduced cash flows, and lower overall profitability of our operations. Our financial statements could fail to reflect adequate reserves to cover such contingencies. Furthermore, we are subject to periodic audits in the various jurisdictions in which we operate, which if determined aversely could have an adverse impact on our financial conditions.
Changes in tax laws or tax rulings could materially affect our financial condition, results of operations, and cash flows.
The tax regimes that we are subject to or operate under, including income and non-income taxes, may be subject to significant change. Changes in tax laws, regulations, or rulings, or changes in interpretations of existing laws and regulations, could materially affect our financial condition and results of operations, and we must monitor such changes closely. For example, the TCJA, the Coronavirus Aid, Relief, and Economic Security Act enacted in 2020 and the Inflation Reduction Act enacted in 2022, made many significant changes to the U.S. tax laws, especially with regard to international aspects of taxation. Further, effective January 1, 2022, the TCJA eliminated the option to deduct research and development expenses for tax purposes in the year incurred, and instead requires taxpayers to capitalize and subsequently amortize such expenses over five years for research activities conducted in the U.S. and over 15 years for research activities conducted outside the U.S. Although there have been legislative proposals to repeal or defer the capitalization requirement to later years, there can be no assurance that the provision will be repealed or otherwise modified. Future guidance from the IRS and other tax authorities with respect to any existing or new laws may affect us, and certain aspects of such laws could be repealed or modified in future legislation. In addition, it is uncertain if and to what extent various states in the U.S. will conform to U.S. federal tax laws.
In addition, the OECD has been working on a BEPS Project and issued a report in 2015, an interim report in 2018, and has issued additional guidelines, model rules, and final proposals that may change various aspects of the existing framework under which our tax obligations are determined in many of the countries in which we do business. In particular, the OECD is coordinating the implementation of rules to be adopted from 2023 for taxing the digital economy, specifically with respect to nexus and profit allocation (Pillar One), and for a global minimum tax (Pillar Two). While these and other BEPS initiatives are in the final stages of approval and/or implementation, we
46
cannot predict their outcome or what potential impact they may have on our tax obligations and operations or our financial statements, up to their final enactment in national and international legislation.
Additionally, the European Commission and several countries have issued (and continue to issue) proposals that could change various aspects of the current tax framework under which we are taxed. These proposals include changes to the existing framework to calculate income tax, as well as proposals to change or impose new types of non-income taxes, including taxes based on a percentage of revenue or online sale. For example, several countries have proposed or enacted taxes applicable to digital services, which could apply to our business (subject to any scaling back or withdrawal of such proposals or enactments following the implementation of Pillar One and Pillar Two and/or the introduction of mechanisms to avoid double taxation currently being assessed).
Due to the large and expanding scale of our international business activities, these types of changes to the taxation of our activities could increase our worldwide effective tax rate, increase the amount of taxes imposed on our business, and harm our financial position. Such changes may also apply retroactively to our historical operations and result in taxes greater than the amounts estimated and recorded in our financial statements.
Changes in our effective tax rate or tax liability may have an adverse effect on our results of operations.
We are subject to income taxes in the U.S. and various foreign jurisdictions. The determination of our worldwide provision for income taxes and other tax liabilities requires significant judgment by management, and there are many transactions where the ultimate tax determination is uncertain. We believe that our provision for income taxes is reasonable, but the ultimate tax outcome may differ from the amounts recorded in our consolidated financial statements and may materially affect our financial results in the period or periods in which such outcome is determined.
Our effective tax rate could increase due to several factors, including:
•changes in the relative amounts of income before taxes in the various jurisdictions in which we operate that have differing statutory tax rates;
•changes in tax laws, tax treaties, and regulations or the interpretation of them;
•changes to our assessment about our ability to realize our DTAs that are based on estimates of our future results, the prudence and feasibility of possible tax planning strategies, and the economic and political environments in which we do business;
•the outcome of current and future tax audits, examinations, or administrative appeals;
•changes international tax frameworks; and
•the effects of acquisitions.
Any of these developments could adversely affect our results of operations.
We could be required to collect additional sales, use, transfer, or other indirect taxes or be subject to other tax liabilities that may increase the costs our customers would have to pay for our products and adversely affect our results of operations.
We currently collect and remit applicable sales, use, transfer, or other indirect taxes in jurisdictions where we, through our employees or economic activity, have a presence and where we have determined, based on applicable legal precedents, that sales or licensing of our products are classified as taxable. We do not currently collect and remit state and local excise, utility user or ad valorem taxes, fees, or surcharges in jurisdictions where we believe we do not have sufficient nexus. There is uncertainty as to what constitutes sufficient nexus for a state or local jurisdiction to levy taxes, fees, and surcharges for sales made over the internet, and there is also uncertainty as to whether our characterization of our products as not taxable in certain jurisdictions will be accepted by state and local tax authorities.
An increasing number of states have considered or adopted laws that attempt to impose tax collection obligations on out-of-state companies. Additionally, the Supreme Court of the U.S. ruled in South Dakota v. Wayfair, Inc. et al that online sellers can be required to collect sales and use tax despite not having a physical presence in the buyer’s state. In response to this ruling, or otherwise, states or local governments may adopt, or begin to enforce, laws requiring us to calculate, collect, and remit taxes on sales in their jurisdictions. A successful assertion
47
by one or more states requiring us to collect taxes where we presently do not do so, or to collect more taxes in a jurisdiction in which we currently do collect some taxes, could result in substantial tax liabilities, including taxes on past sales, as well as penalties and interest. The imposition by state governments or local governments of sales tax collection obligations on out-of-state sellers could also create additional administrative burdens for us and put us at a competitive disadvantage if they do not impose similar obligations on our competitors.
Our ability to use our NOLs to offset future taxable income may be subject to certain limitations.
Certain of our NOLs could expire unused and be unavailable to offset future income tax liabilities because of their limited duration or because of restrictions under U.S. or foreign tax law. NOLs generated in taxable years beginning before January 1, 2018 are permitted to be carried forward for only 20 taxable years under applicable U.S. federal income tax law. Under current law, NOLs arising in taxable years beginning after December 31, 2020 may not be carried back. Moreover, under current law, NOLs generated in taxable years beginning after December 31, 2017 may be carried forward indefinitely, but the deductibility of such NOLs generally will be limited to 80% of current year taxable income. The extent to which state income tax law will conform to federal is uncertain.
In general, under Section 382 of the IRC, a corporation that undergoes an “ownership change” (as defined under Section 382 of the IRC and applicable Treasury Regulations) is subject to limitations on its ability to utilize its pre-change NOLs to offset future taxable income. We have identified Section 382 ownership changes in April 2017 and July 2020 and, accordingly, our NOLs are subject to limitation. We did not experience a subsequent ownership change in connection with the Series F Financing and our IPO. We do not believe that any Section 382 limitations will prevent us from fully utilizing our NOLs. It is possible that we have in the past undergone and may in the future undergo, additional ownership changes that we have not identified and that could result in additional limitations on our NOLs. Furthermore, our ability to utilize NOLs of companies that we have acquired or may acquire in the future may be subject to limitations. There is also a risk that due to regulatory changes, such as suspensions on the use of NOLs or other unforeseen reasons, our existing NOLs could expire or otherwise be unavailable to reduce future income tax liabilities, including for state tax purposes. For these reasons, we may not be able to utilize a material portion of our NOLs, even if we attain profitability, which could potentially result in increased future tax liability to us and could adversely affect our results of operations and financial condition.
Our reported financial results may be adversely affected by changes in GAAP.
GAAP is subject to interpretation by the FASB, SEC, and various bodies formed to promulgate and interpret appropriate accounting principles. A change in these principles or interpretations could have a significant effect on our reported results of operations and could affect the reporting of transactions already completed before the announcement of a change.
If our estimates or judgments relating to our critical accounting estimates prove to be incorrect, our results of operations could be adversely affected.
The preparation of financial statements in conformity with GAAP requires management to make estimates and assumptions that affect the amounts reported in our consolidated financial statements. We base our estimates on historical experience and on various other assumptions that we believe to be reasonable under the circumstances. The results of these estimates form the basis for making judgments about the carrying values of assets, liabilities, and equity, and the amount of revenue and expenses that are not readily apparent from other sources. Significant estimates and judgments involve revenue recognition and stock-based compensation. Our results of operations may be adversely affected if our assumptions change or if actual circumstances differ from those in our assumptions, which could cause our results of operations to fall below the expectations of securities analysts and investors, resulting in a decline in the market price of our Class A common stock.
Our revenue recognition policy and other factors may cause variability of our financial results in any given period and make them difficult to predict.
We derive our revenue from the sale of our software licenses for use of our proprietary software, maintenance and support for our licenses, right to access certain products that are hosted by us (i.e., SaaS), and professional services. Under ASC 606, Revenue from Contracts with Customers, we recognize revenue when a customer obtains control of promised goods or services are delivered. The amount of revenue recognized reflects the consideration that we expect to receive in exchange for these goods or services. Licenses revenue (including the term license portion of Flex Offerings) is recognized when we transfer control of the respective license to the customer. Revenue from SaaS and revenue from maintenance and support are recognized ratably over time since
48
control passes to our customers over the arrangement’s contractual period. Professional services revenue is recognized as services are rendered.
Furthermore, the presentation of our financial results requires us to make estimates and assumptions that may affect revenue recognition. In some instances, we could reasonably use different estimates and assumptions, and changes in estimates may occur from period to period.
Given the foregoing factors, our actual results could differ significantly from our estimates. Comparing our revenue and operating results on a period-to-period basis may not be meaningful, and our past results may not be indicative of our future performance.
For more information on our revenue recognition policy, refer to Note 2, Summary of Significant Accounting Policies—Revenue Recognition, included in Part II, Item 8 of this Annual Report on Form 10-K.
Risks Related to Ownership of Our Class A Common Stock
The dual class structure of our common stock has the effect of concentrating voting control with Daniel Dines, our Co-Chief Executive Officer, Co-Founder, and Chairman, which will limit your ability to influence the outcome of important decisions.
Our Class B common stock has 35 votes per share and our Class A common stock has one vote per share. Our Co-Chief Executive Officer, Co-Founder, and Chairman, Daniel Dines, collectively with his controlled entities, holds all our outstanding shares of Class B common stock, and beneficially owned shares representing approximately 87% voting power of our outstanding capital stock as of January 31, 2023. As a result, Mr. Dines has the ability to control the outcome of matters requiring stockholder approval, including the election of directors and approval of significant corporate transactions, such as a merger or other sale of our company or our assets, even if his stock ownership represents less than 50% of the outstanding aggregate number of shares of our capital stock. This concentration of ownership will limit the ability of other stockholders to influence corporate matters and may cause us to make strategic decisions that could involve risks to you or that may not be aligned with your interests. As a board member, Mr. Dines owes a fiduciary duty to our stockholders and is legally obligated to act in good faith and in a manner he reasonably believes to be in the best interests of our stockholders. As a stockholder, Mr. Dines is entitled to vote his shares in his own interests, which may not always be in the interests of our stockholders generally. Mr. Dines’ control may adversely affect the market price of our Class A common stock.
Further, future transfers by holders of our Class B common stock will generally result in those shares converting into shares of our Class A common stock, subject to limited exceptions, such as certain transfers effected for tax or estate planning purposes.
We have not elected to take advantage of the “controlled company” exemption to the corporate governance rules for publicly-listed companies but may do so in the future.
Because our Co-Chief Executive Officer, Co-Founder, and Chairman, Daniel Dines, who, collectively with his controlled entities, holds all our outstanding shares of Class B common stock, and beneficially owns shares representing in excess of 50% of the voting power of our outstanding capital stock, we are eligible to elect the “controlled company” exemption to the corporate governance rules for publicly-listed companies. We have not elected to do so. If we decide to rely on the “controlled company” exemption, then under the corporate governance rules for publicly-listed companies, we would not be required to have a majority of our board of directors be independent, nor would we be required to have a compensation committee or an independent nominating function. If we choose controlled company status in the future, our status as a controlled company could cause our Class A common stock to be less attractive to certain investors or otherwise harm our trading price.
We cannot predict the impact our dual class structure may have on the market price of our Class A common stock.
We cannot predict whether our dual class structure, combined with the concentrated control of our Co-Chief Executive Officer, Co-Founder, and Chairman, Daniel Dines, who holds all of the outstanding shares of our Class B common stock, will result in a lower or more volatile market price of our Class A common stock or in adverse publicity or other adverse consequences. Certain index providers have announced restrictions on including companies with multiple-class share structures in certain of their indexes. For example, in July 2017, FTSE Russell and Standard & Poor’s announced that they would cease to allow most newly public companies utilizing dual or
49
multi-class capital structures to be included in their indices. Under the announced policies, our dual class capital structure would make us ineligible for inclusion in any of these indices. Given the sustained flow of investment funds into passive strategies that seek to track certain indexes, exclusion from stock indexes would likely preclude investment by many of these funds and could make our Class A common stock less attractive to other investors. As a result, the market price of our Class A common stock could be adversely affected.
Future sales of our Class A common stock in the public market could cause the market price of our Class A common stock to decline.
Sales of a substantial number of shares of our Class A common stock in the public market in the future, or the perception that these sales might occur, could depress the market price of our Class A common stock and could impair our ability to raise capital through the sale of additional equity securities. We are unable to predict the timing of or the effect that such sales may have on the prevailing market price of our Class A common stock.
In addition, there were 50,824,592 shares of Class A common stock issuable upon the exercise of options and upon the vesting and settlement of restricted stock units outstanding as of January 31, 2023. We have registered all of the shares of Class A common stock issuable upon exercise of outstanding options, vesting and settlement of outstanding restricted stock units, and other equity incentives we may grant in the future, for public resale under the Securities Act. The shares of Class A common stock became eligible for sale in the public market to the extent such options are exercised or restricted stock units vested and settled, subject to compliance with applicable securities laws. Further, certain of our stockholders have rights, subject to some conditions, to require us to file registration statements covering the sale of their shares or to include their shares in registration statements that we may file for ourselves or other stockholders.
Sales, short sales, or hedging transactions involving our equity securities, whether or not we believe them to be prohibited, could adversely affect the price of our Class A common stock.
Anti-takeover provisions in our charter documents and under Delaware law could make an acquisition of our company more difficult, limit attempts by our stockholders to replace or remove our current management, and limit the market price of our Class A common stock.
In addition to the effects of our dual class structure, provisions in our amended and restated certificate of incorporation and amended and restated bylaws may have the effect of delaying or preventing a change in control or changes in our management. Our amended and restated certificate of incorporation and amended and restated bylaws include provisions that may frustrate or prevent any attempts by our stockholders to replace or remove our current management by making it more difficult for stockholders to replace members of our board of directors, which is responsible for appointing the members of our management.
In addition, because we are incorporated in Delaware, we are governed by the provisions of Section 203 of the Delaware General Corporation Law, which generally, subject to certain exceptions, prohibits a Delaware corporation from engaging in any of a broad range of business combinations with any “interested” stockholder for a period of three years following the date on which the stockholder became an “interested” stockholder. Any of the foregoing provisions could limit the price that investors might be willing to pay in the future for shares of our Class A common stock, and they could deter potential acquirers of our company, thereby reducing the likelihood that you would receive a premium for your shares of our Class A common stock in an acquisition.
Our amended and restated certificate of incorporation provides that the Court of Chancery of the State of Delaware and the federal district courts of the U.S. will be the exclusive forums for substantially all disputes between us and our stockholders, which could limit our stockholders’ ability to obtain a favorable judicial forum for disputes with us or our directors, officers, or employees.
Our amended and restated certificate of incorporation provides the Court of Chancery of the State of Delaware is the exclusive forum for the following types of actions or proceedings under Delaware statutory or common law:
•any derivative claim or cause of action brought on our behalf;
•any claim or cause of action asserting a breach of fiduciary duty;
•any claim or cause of action against us arising under the Delaware General Corporation Law;
50
•any claim or cause of action arising under or seeking to interpret our amended and restated certificate of incorporation or our amended and restated bylaws; and
•any claim or cause of action against us that is governed by the internal affairs doctrine.
The provisions would not apply to suits brought to enforce a duty or liability created by the Exchange Act. Furthermore, Section 22 of the Securities Act creates concurrent jurisdiction for federal and state courts over all such Securities Act actions. Accordingly, both state and federal courts have jurisdiction to entertain such claims. To prevent having to litigate claims in multiple jurisdictions and the threat of inconsistent or contrary rulings by different courts, among other considerations, our amended and restated certificate of incorporation provides that the federal district courts of the U.S. will be the exclusive forum for resolving any complaint asserting a cause or causes of action arising under the Securities Act, including all causes of action asserted against any defendant to such complaint. For the avoidance of doubt, this provision is intended to benefit and may be enforced by us, our officers and directors, the underwriters to any offering giving rise to such complaint, and any other professional entity whose profession gives authority to a statement made by that person or entity and who has prepared or certified any part of the documents underlying the offering.
While the Delaware courts have determined that such choice of forum provisions are facially valid, a stockholder may nevertheless seek to bring a claim in a venue other than those designated in the exclusive forum provisions. In such instance, we would expect to vigorously assert the validity and enforceability of the exclusive forum provisions of our amended and restated certificate of incorporation. This may require significant additional costs associated with resolving such action in other jurisdictions and there can be no assurance that the provisions will be enforced by a court in those other jurisdictions.
These exclusive forum provisions may limit a stockholder’s ability to bring a claim in a judicial forum that it finds favorable for disputes with us or our directors, officers, or other employees, which may discourage lawsuits against us and our directors, officers, and other employees. If a court were to find either exclusive-forum provision in our amended and restated certificate of incorporation to be inapplicable or unenforceable in an action, we may incur further significant additional costs associated with resolving the dispute in other jurisdictions, all of which could seriously harm our business.
General Risk Factors
Our stock price may be volatile, and the value of our Class A common stock may decline.
The market price of our Class A common stock may be highly volatile and may fluctuate or decline substantially as a result of a variety of factors, some of which are beyond our control, including:
•actual or anticipated fluctuations in our financial condition or results of operations;
•variance in our financial performance from expectations of securities analysts;
•changes in the pricing of our products and services;
•changes in our projected operating and financial results;
•changes in laws or regulations applicable to our platform and products;
•announcements by us or our competitors of significant business developments, acquisitions, or new products;
•significant data breaches, disruptions to, or other incidents involving our software;
•our involvement in litigation or governmental investigations;
•future sales of our Class A common stock by us or our stockholders;
•changes in senior management or key personnel;
•the issuance of new or changed securities analysts’ reports or recommendations;
•the trading volume of our Class A common stock;
•changes in the anticipated future size and growth rate of our market;
•economic and market conditions in general, or in our industry in particular; and
51
•technical factors in the public trading market for our Class A common stock that may produce price movements that may or may not comport with macro, industry, or company-specific fundamentals, including, without limitation, the sentiment of retail investors, the amount and status of short interest in our securities, access to margin debt, trading in options and other derivatives on our common stock, and other technical trading factors.
Accordingly, we cannot assure you of the liquidity of an active trading market, your ability to sell your shares of our Class A common stock when desired, or the prices that you may obtain for your shares of our Class A common stock. The lack of an active market may impair your ability to sell your shares at the time you wish to sell them or at a price that you consider reasonable. The lack of an active market may also reduce the fair value of your shares. An inactive market may also impair our ability to raise capital to continue to fund operations by selling shares and may impair our ability to acquire other companies or technologies by using our shares as consideration.
Broad market and industry fluctuations, as well as general economic, political, regulatory, and market conditions, may also negatively impact the market price of our Class A common stock. In addition, technology stocks have historically experienced high levels of volatility. In the past, companies that have experienced volatility in the market price of their securities have been subject to securities class action litigation. We may be the target of this type of litigation in the future, which could result in substantial expenses and divert our management’s attention.
Our issuance of additional capital stock in connection with financings, acquisitions, investments, our equity incentive plans, or otherwise will dilute all other stockholders.
We expect to issue additional capital stock in the future that will result in dilution to all other stockholders. We expect to continue to grant equity awards to employees, directors, and consultants under our equity incentive plans. We may also raise capital through equity financings in the future. As part of our business strategy, we may acquire or make investments in companies, products, or technologies and issue equity securities to pay for any such acquisition or investment. Any such issuances of additional capital stock may cause stockholders to experience significant dilution of their ownership interests and the per share value of our Class A common stock to decline.
We incur significant costs as a result of operating as a public company, and our management is required to devote substantial time to compliance with our public company responsibilities and corporate governance practices.
As a public company, we incur significant legal, accounting, and other expenses. SOX, the Dodd-Frank Act, the listing requirements of the New York Stock Exchange, and other applicable securities rules and regulations impose various requirements on public companies. Our management and other personnel devote a substantial amount of time to compliance with these requirements. The increased compliance burden as we transition into large accelerated filer status from “emerging growth company” status and these rules and regulations contribute to increased legal and financial compliance costs and make some activities time-consuming.
As of January 31, 2023, we are no longer an emerging growth company, as defined under the JOBS Act, and will no longer be able to take advantage of certain exemptions from various reporting requirements that are applicable to emerging growth companies. In particular, we will now be required to, among other things, comply with the auditor attestation requirements of Section 404 of SOX, provide additional disclosure regarding executive compensation in our periodic reports and proxy statements, and hold a nonbinding advisory vote on executive compensation. In addition, we will no longer be able to use the extended transition period for complying with new or revised accounting standards available to emerging growth companies and will be required to adopt new or revised accounting standards as of the effective dates for public companies. Such changes may require us to incur additional costs for compliance.
52
Item 1B. Unresolved Staff Comments
Not applicable.
Item 2. Properties
Our corporate headquarters and other significant leased real property as of January 31, 2023 are shown in the following table.
| Location | Business Purpose |
Square Footage |
Lease Expiration Date | |||||||||||||||||
| New York, NY | Global headquarters | 26,363 | 3/31/2038 | |||||||||||||||||
| Bucharest, Romania | Corporate office | 100,335 | 3/1/2028 | |||||||||||||||||
| Bellevue, WA | Product development center | 39,120 | 11/30/2024 | |||||||||||||||||
| Bangalore, India | Corporate office | 21,006 | 2/14/2028 | |||||||||||||||||
| Tokyo, Japan | Serviced office space | 3,358 | 9/30/2023 | |||||||||||||||||
We also lease other spaces for our sales, services, development, and administrative activities in various locations in the U.S. and around the world. We do not own any real property. We believe our leased properties are in good operating condition and adequately serve our current business operations.
For additional information regarding obligations under operating leases, see Note 8, Operating Leases, to the consolidated financial statements included in Part II, Item 8 of this Annual Report on Form 10-K.
Item 3. Legal Proceedings
Information pertaining to legal proceedings, if any, can be found in Note 11, Commitments and Contingencies — Litigation, to the consolidated financial statements included in Part II, Item 8 of this Annual Report on Form 10-K.
Item 4. Mine Safety Disclosures
Not applicable.
53
PART II
Item 5. Market for Registrant's Common Equity, Related Stockholder Matters and Issuer Purchases of Equity Securities
Market Information
Our Class A common stock is traded on the New York Stock Exchange under the ticker symbol "PATH." There currently is no established public trading market for our Class B common stock, but each share of Class B common stock is convertible at any time at the option of the holder into one share of Class A common stock, and is automatically converted upon sale or transfer into one share of Class A common stock.
Number of Holders of Common Stock
The number of record holders of our Class A and Class B common stock as of March 21, 2023 was 61 and one, respectively. The number of beneficial owners of our Class A common stock is substantially greater than the number of record holders because a large portion of Class A common stock is held in “street name” by brokers.
Dividends
We have never declared or paid any dividends on our Class A or Class B common stock, and we do not anticipate paying cash dividends in the foreseeable future.
Use of Proceeds from Initial Public Offering of Class A Common Stock
In April 2021, we completed our IPO, in which we issued and sold 13.0 million shares of our Class A common stock, including 3.6 million shares pursuant to the exercise in full of the underwriters’ option to purchase additional shares, and the selling stockholders sold an additional 14.5 million shares, at a public offering price of $56.00 per share, resulting in net proceeds to us of $687.9 million after deducting underwriting discounts and commissions and offering expenses. We did not receive any proceeds from the sale of shares by the selling stockholders. All of the shares issued and sold in the IPO were registered under the Securities Act pursuant to a registration statement on Form S-1 (File No. 333-254738), which was declared effective by the SEC on April 20, 2021. There has been no material change in the planned uses of proceeds from our IPO from those disclosed in the 2022 Form 10-K.
Issuer Purchase of Equity Securities
The following table presents shares of Class A common stock withheld to satisfy employee tax obligations associated with net settlement of RSUs during the three months ended January 31, 2023:
| Period | Total Number of Shares Purchased |
Average Price Paid Per Share |
||||||||||||
| November 1 – 30 | — | $ | — | |||||||||||
| December 1 – 31 | — | — | ||||||||||||
| January 1 – 31 | 1,529,066 | 12.71 | ||||||||||||
| Total | 1,529,066 | $ | 12.71 | |||||||||||
54
Recent Sales of Unregistered Securities
None.
Stock Performance Graph
The following graph compares the cumulative total return of our Class A common stock for the period from April 21, 2021, the date our Class A common stock began trading on the New York Stock Exchange, through January 31, 2023, as compared to the cumulative total return of the S&P 500 Index and S&P 500 Technology Index over the same period. The graph assumes a $100 investment in our Class A common stock and each of the above indices at April 21, 2021, with cash dividends reinvested as applicable.
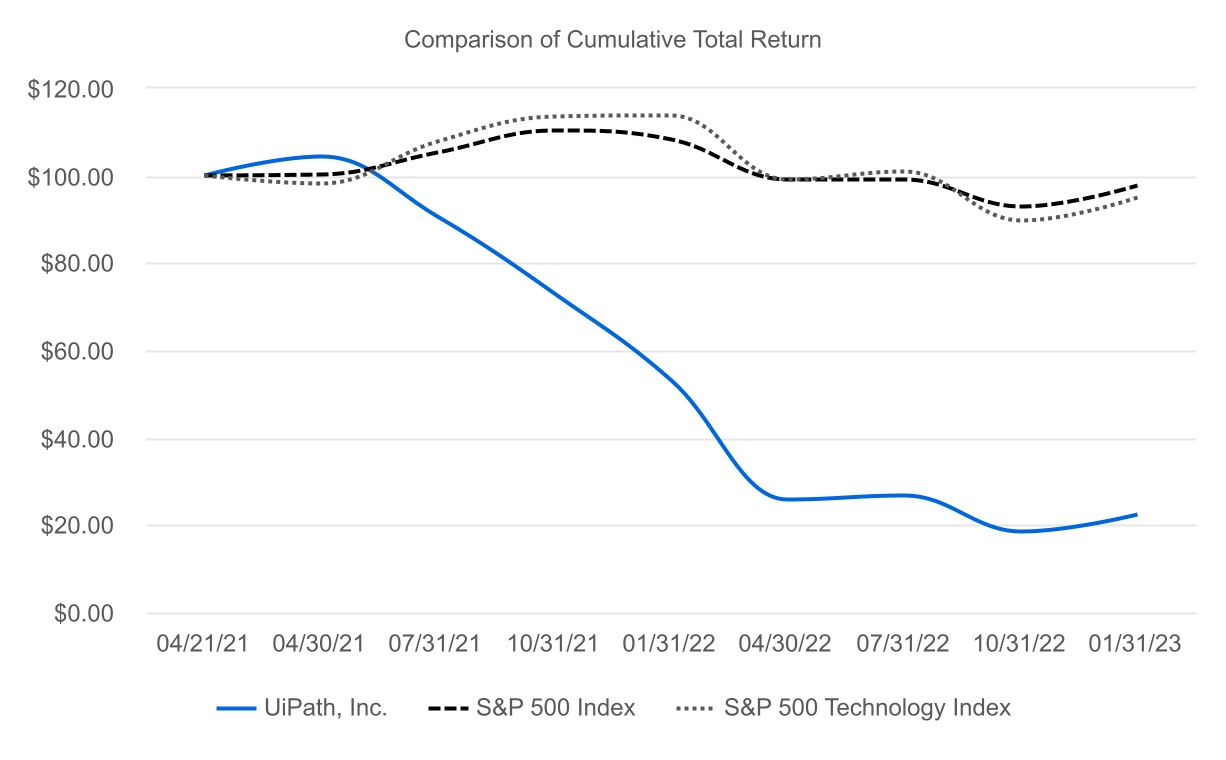
Item 6. [Reserved]
Item 7. Management's Discussion and Analysis of Financial Condition and Results of Operations
The following discussion and analysis of our financial condition and results of operations should be read in conjunction with our audited consolidated financial statements and related notes for the fiscal year ended January 31, 2023 included elsewhere in this Annual Report on Form 10-K. This discussion, particularly with respect to our future results of operations or financial condition, business strategy and plans and objectives of management for future operations, includes forward-looking statements that involve risks and uncertainties as described under the heading “Special Note Regarding Forward-Looking Statements” in this Annual Report on Form 10-K. You should review the disclosure under the heading “Risk Factors” in Part I, Item 1A of this Annual Report on Form 10-K for a discussion of important factors that could cause our actual results to differ materially from those anticipated in these forward-looking statements. Our fiscal quarters end on April 30, July 31, and October 31, and our fiscal year ends January 31. References to fiscal years 2023, 2022, and 2021 in this Annual Report on Form 10-K refer to our fiscal years ended January 31, 2023, 2022, and 2021, respectively. A discussion regarding our financial condition and our results of operations for fiscal year 2023 compared to fiscal year 2022 is presented below. A discussion regarding our results of operations for fiscal year 2022 compared to fiscal year 2021 was presented in the 2022 Form 10-K, under the section titled "Management's Discussion and Analysis of Financial Condition and Results of Operations."
55
Overview
UiPath is at the forefront of technology innovation and thought leadership in automation, as the provider of an end-to-end platform that can help customers realize the true potential of digital transformation. The UiPath Business Automation Platform leverages AI, ML, and NLP to empower software robots that emulate human behavior, driving operational efficiencies and meaningful business outcomes without requiring significant changes to the organization's underlying technology infrastructure.
Historically, we have grown our revenue and ARR significantly by helping customers adopt automation as a tool, process by process. Today, we continue to build on this foundation and drive the evolution of automation by inspiring customers to see automation more holistically, as not just a tool but as a whole new way of operating and innovating.
Our results of operations and financial condition are impacted by the macro factors affecting our industry, including the proliferation of cloud-based applications, the cost of skilled human capital, and the global demand for automation solutions. While our business is influenced by these macro factors, our results of operations are more directly affected by certain Company-specific factors, including:
•our ability to attract new customers, which depends on a number of other factors, including our ability to drive awareness of the benefits and power of automation among our existing and prospective customers, the effectiveness and pricing of our products, the offerings of our competitors, and competition among resellers;
•our ability to increase sales to existing customers, which depends on factors such as our customers’ satisfaction with our platform, competition, pricing, and overall changes in our customers’ propensity to invest in automation;
•our ability to grow our partner base, which depends on the competitiveness of our platform and the profitability of our relationship for our partners and potential partners;
•our ability to sustain innovation and automation leadership in order to maintain our competitive advantage, which depends on our capacity to invest in research and development to expand the capabilities of our platform, our ability to collaborate with other leading technology companies to develop integrations, and our ability to execute strategic acquisitions and investments in businesses and technologies to drive our product and market expansion; and
•our ability to continue to grow our business over the long term, which depends on our ability to invest in scaling across all organizational functions and domestic and international operations.
For further discussion of our business, our platform, and our growth strategies, refer to Item 1. Business.
Fiscal Year 2023 Highlights
•Revenue of $1,058.6 million increased 19% year-over-year.
•ARR of $1,203.8 million increased 30% year-over-year.
•Gross margin was 83% for fiscal year 2023, compared to 81% in fiscal year 2022.
•Cash, cash equivalents, and marketable securities were $1,759.8 million as of January 31, 2023, compared to $1,884.7 million as of January 31, 2022.
Macroeconomic Environment and Foreign Currency Fluctuations
Macroeconomic factors have affected our business and our customers’ businesses. Globally, we price our platform in local currency. Accordingly, the heightened volatility of global markets has exposed us and will continue to expose us to foreign currency fluctuations, which may impact demand for our platform, our near-term results, and our ability to predict future results. Further, cash, cash equivalents, and marketable securities represent a significant portion of our total assets; as such, liquidity concerns in the financial services industry may have an effect on our business, financial conditions, and results of operations.
Fiscal Year 2023 Restructuring Actions
56
On June 24, 2022, our board of directors approved restructuring actions to manage our operating expenses. These actions included an overall reduction of approximately 5% of our global workforce, aimed at simplifying our go-to-market approach to improve market segmentation, increase sales productivity, and provide best-in-class customer experience and outcomes. On November 10, 2022, our board of directors approved further restructuring actions, including an additional 6% workforce reduction to further support our strategic positioning to drive increased execution velocity, operational efficiency, and customer centricity. Refer to Note 11, Commitments and Contingencies—Workforce Restructuring included in Item 8 of this Annual Report on Form 10-K for more information.
Impact of COVID-19
When the COVID-19 pandemic began to unfold, we took decisive action across our internal and customer operations to ensure the resilience of the Company and the safety of our employees. Our operational rigor, digital infrastructure, and global footprint have enabled us to support our customers navigating new challenges presented by the pandemic as well as existing needs to automate. Global demand for automation has continued to accelerate as automation becomes ever more critical for business execution and performance in remote working environments, and we have continued to invest in the development and marketing of our automation platform to meet that demand.
Key Performance Metric
ARR is the key performance metric we use in managing our business because it illustrates our ability to acquire new subscription customers and to maintain and expand our relationships with existing subscription customers. We define ARR as annualized invoiced amounts per solution SKU from subscription licenses and maintenance and support obligations assuming no increases or reductions in customers' subscriptions. ARR does not include the costs we may incur to obtain such subscription licenses or provide such maintenance and support, and does not reflect any actual or anticipated reductions in invoiced value due to contract non-renewals or service cancellations other than for specific reserves, for example those for credit losses or disputed amounts. At January 31, 2023 and 2022, our ARR was $1,203.8 million and $925.3 million, respectively, representing a growth rate of 30%. Approximately 25% of this growth rate was due to new customers and 75% of this growth rate was due to existing customers. Our dollar-based net retention rate, which represents the net expansion of ARR from existing customers over the preceding 12 months, was 123% and 145% as of January 31, 2023 and 2022, respectively. We calculate dollar-based net retention rate as of a period end by starting with Prior Period ARR, the ARR from the cohort of all customers as of 12 months prior to such period end. We then calculate Current Period ARR, the ARR from these same customers as of the current period end. Current Period ARR includes any expansion and is net of contraction or attrition over the last 12 months, but does not include ARR from new customers in the current period. We then divide the total Current Period ARR by the total Prior Period ARR to arrive at the point-in-time dollar-based net retention rate.
Our ARR may fluctuate as a result of a number of factors, including customers’ satisfaction or dissatisfaction with our platform, pricing, competitive offerings, economic conditions, overall changes in our customers’ spending levels, and our ability to successfully execute on our strategic goals. ARR should be viewed independently of revenue and deferred revenue as ARR is an operating metric and is not intended to be combined with or to replace these items. For clarity, we use annualized invoiced amounts per solution SKU rather than revenue calculated in accordance with U.S. GAAP to calculate our ARR. Our invoiced amounts are not matched to transfer of control of the performance obligations associated with the underlying subscription licenses and maintenance and support obligations. This can result in timing differences between our GAAP revenue and ARR calculations. Our ARR calculation simply takes our invoiced amounts per solution SKU under a subscription license or maintenance agreement and divides that amount by the invoice term and multiplies by 365 days to derive the annualized value. In contrast, for our revenue calculated in accordance with GAAP, subscription licenses revenue derived from the sale of term-based licenses hosted on-premises is recognized at the point in time when the customer is able to use and benefit from our software, which is generally upon delivery to the customer or upon the commencement of the renewal term, and maintenance, support, and SaaS revenue is recognized ratably over the term of the arrangement. ARR is not a forecast of future revenue. Unlike ARR, future revenue can be impacted by contract start and end dates and duration. The timing of recognition of ARR is determined by contract billing structure, whereas billing structure will neither accelerate nor delay recognition of future revenue. For example, in a multi-year contract invoiced upfront, ARR is the annualized invoiced amount per solution SKU related to the final year of the contract, whereas revenue is determined by total contract value and timing of transfer of the underlying performance
57
obligations. ARR does not include invoiced amounts associated with perpetual licenses or professional services. Investors should not place undue reliance on ARR as an indicator of our future or expected results. Moreover, our presentation of ARR may differ from similarly titled metrics presented by other companies and may not be comparable to such other metrics. For further information, see the section titled “Risk Factors—Risks Related to Our Business, Products, Operations, and Industry" included in Part I, Item 1A of this Annual Report on Form 10-K.
A summary of ARR-related data at January 31, 2023 and 2022 is as follows:
| At January 31, | |||||||||||
| 2023 | 2022 | ||||||||||
| (dollars in thousands) | |||||||||||
| Annualized renewal run-rate (ARR) | $ | 1,203,845 | $ | 925,276 | |||||||
Incremental ARR (1)
|
$ | 278,569 | $ | 344,793 | |||||||
Customers with ARR ≥ $1 million: |
|||||||||||
| Number of customers | 229 | 158 | |||||||||
| Percent of fiscal year revenue | 43 | % | 43 | % | |||||||
Customers with ARR ≥ $100 thousand: |
|||||||||||
| Number of customers | 1,785 | 1,493 | |||||||||
| Percent of fiscal year revenue | 81 | % | 79 | % | |||||||
| Dollar-based net retention rate | 123 | % | 145 | % | |||||||
(1) For the twelve months ended January 31, 2023 and 2022, respectively
|
|||||||||||
Components of Results of Operations
Revenue
We derive revenue from the sale of: (1) software licenses for use of our proprietary software and related maintenance and support; (2) the right to access certain software products we host (i.e., SaaS); and (3) professional services.
In fiscal year 2023, we moved toward unifying our commercial offerings for products with both on-premise and cloud deployment options into a single offering that allows customers the choice of either deployment option throughout the term of the contract. These Flex Offerings replaced the hybrid offerings launched in fiscal year 2021. Flex Offerings are comprised of three types of performance obligations: term license, maintenance and support, and SaaS.
During the current fiscal year, we saw an increase in sales of our Flex Offerings compared to sales of our legacy offerings (primarily on-premise solutions sold as term-based licenses bundled with maintenance and support). We expect this trend to continue and, as a result, a greater portion of our revenue will be recognized over time as subscription services revenue rather than as license revenue, which is typically recognized at a point in time.
Licenses
We primarily sell term licenses (including the term license portion of Flex Offerings), which provide customers the right to use software for a specified period of time. Revenue for licenses is recognized at the point in time at which the customer is able to use and benefit from the software, which is generally upon delivery to the customer or upon commencement of the renewal term.
Subscription Services
We generate subscription services revenue through the provision of: (1) maintenance and support services, which include technical support and unspecified updates and upgrades on a when-and-if-available basis for our licenses, and (2) SaaS products, including those sold as part of our Flex Offerings. Maintenance and support and
58
SaaS products represent stand-ready obligations for which revenue is recognized ratably over the term of the arrangements.
Professional Services and Other
Professional services and other revenue consists of fees associated with professional services for process automation, customer education, and training services. Our professional services contracts are structured on a time and materials or fixed price basis, and the related revenue is recognized as the services are rendered.
Cost of Revenue
Licenses
Cost of licenses revenue consists of all direct costs to deliver our licenses to customers, amortization of software development costs related to our licenses, and amortization of acquired developed technology.
Subscription Services
Cost of subscription services revenue primarily consists of personnel-related expenses of our customer support and technical support teams, including salaries and bonuses, stock-based compensation expense, and employee benefit costs. Cost of subscription services revenue also includes third-party consulting services, hosting costs related to our SaaS products, amortization of acquired developed technology and capitalized software development costs related to SaaS products, and allocated overhead. Overhead is allocated to cost of subscription services revenue based on applicable headcount. We recognize these expenses as they are incurred. We expect cost of subscription services revenue to continue to increase in absolute dollars for the foreseeable future as our customer base grows. In the future, we expect further expansion of our cloud-based deployments. As sales of SaaS products become a larger percentage of our total revenue, we expect our gross margin to be impacted by increased hosting fees and cloud infrastructure costs.
Professional Services and Other
Cost of professional services and other revenue primarily consists of personnel-related expenses of our professional services team, including salaries and bonuses, stock-based compensation expense, and employee benefit costs. Cost of professional services and other revenue also includes expenses related to third-party consulting services and allocated overhead. We recognize these expenses as they are incurred. We expect cost of professional services and other revenue to continue to increase in absolute dollars for the foreseeable future as our customer base grows.
Operating Expenses
Our operating expenses consist of sales and marketing, research and development, and general and administrative expenses. Personnel-related expenses are the most significant component of operating expenses and consist of salaries and bonuses, stock-based compensation expense, and employee benefit costs. Operating expenses also include allocated overhead. During fiscal years 2022 and 2021, certain operating expenses, such as travel and entertainment, decreased, primarily as a result of the COVID-19 pandemic. During fiscal year 2023, we reinstated travel and in-person meetings and events, resulting in a resumption of these expenses.
Sales and Marketing
Sales and marketing expenses consist primarily of personnel-related expenses associated with our sales and marketing teams and related sales support teams, including salaries and bonuses, stock-based compensation expense, and employee benefit costs. Sales and marketing expenses also include sales and partner commissions, marketing event costs, advertising costs, travel, trade shows, other marketing materials, and allocated overhead. Similar to travel and entertainment, trade show expenses also decreased in fiscal year 2021 and through the first half of fiscal year 2022, as a result of the COVID-19 pandemic. We have since seen trade show expenses resume. We expect that over the longer term our sales and marketing expenses will decrease as a percentage of revenue, although this percentage may fluctuate from period to period due to timing and extent of expenses.
59
Research and Development
Research and development expenses consist primarily of personnel-related expenses, including salaries and bonuses, stock-based compensation expense, and employee benefits costs for our research and development employees, and allocated overhead. Research and development costs are expensed as incurred, with the exception of certain software development costs which are eligible for capitalization. We expect that our research and development expenses will increase in absolute dollars for the foreseeable future as we continue to invest in efforts to develop new technology and enhance the functionality and capabilities of our existing products and platform infrastructure. Our research and development expenses may fluctuate as a percentage of revenue from period to period due to the timing and extent of expenses.
General and Administrative
General and administrative expenses consist primarily of personnel-related expenses, including salaries and bonuses, stock-based compensation expense, and employee benefits costs associated with our finance, legal, human resources, compliance, and other administrative teams, as well as accounting and legal professional services fees, other corporate-related expenses, and allocated overhead. Following the completion of the IPO in April 2021, we have incurred and expect to continue to incur additional general and administrative expenses as a result of operating as a public company, including as a result of our transition from emerging growth company to large accelerated filer status at the end of fiscal year 2023. We expect that over the longer term our general and administrative expenses will decrease as a percentage of revenue, although this percentage may fluctuate from period to period due to timing and extent of expenses.
Interest Income
Interest income consists of interest income earned on our cash deposits, cash and cash equivalents balances, and marketable securities.
Other Income (Expense), Net
Other income (expense), net primarily consists of foreign exchange gains and losses. Other income (expense), net also includes gains and losses associated with foreign currency forward contracts for those periods in which such contracts were outstanding.
Provision For Income Taxes
Provision for income taxes consists of U.S. federal and state income taxes and income taxes in foreign jurisdictions in which we conduct business. We maintain a full valuation allowance on our U.S. federal and state, Romanian, and U.K. DTAs, as we have concluded that it is more likely than not that these DTAs will not be realized. Our effective tax rate is affected by tax rates in foreign jurisdictions and the relative amounts of income we earn in those jurisdictions, as well as by non-deductible expenses as permanent differences and by changes in our valuation allowances.
Net Loss
Over the longer term, we seek to drive durable growth while improving profitability and aligning resources to maximize return on investment through operational efficiencies.
60
Results of Operations
The following table sets forth selected consolidated statement of operations data for each of the periods indicated (in thousands):
| Year Ended January 31, | |||||||||||
| 2023 | 2022 | ||||||||||
| Revenue: | |||||||||||
| Licenses | $ | 497,836 | $ | 481,427 | |||||||
| Subscription services | 508,823 | 369,867 | |||||||||
| Professional services and other | 51,922 | 40,958 | |||||||||
| Total revenue | 1,058,581 | 892,252 | |||||||||
| Cost of revenue: | |||||||||||
Licenses (1)
|
10,421 | 11,888 | |||||||||
Subscription services (1)(2)(3)(4)
|
87,366 | 60,565 | |||||||||
Professional services and other (2)(3)(4)
|
82,264 | 96,415 | |||||||||
| Total cost of revenue | 180,051 | 168,868 | |||||||||
| Gross profit | 878,530 | 723,384 | |||||||||
| Operating expenses: | |||||||||||
Sales and marketing(1)(2)(3)(4)
|
701,558 | 697,682 | |||||||||
Research and development(2)(3)(4)
|
285,750 | 276,657 | |||||||||
General and administrative(1)(2)(3)(4)
|
239,505 | 249,991 | |||||||||
| Total operating expenses | 1,226,813 | 1,224,330 | |||||||||
| Operating loss | (348,283) | (500,946) | |||||||||
| Interest income | 27,955 | 3,551 | |||||||||
| Other income (expense), net | 2,767 | (13,488) | |||||||||
| Loss before income taxes | (317,561) | (510,883) | |||||||||
| Provision for income taxes | 10,791 | 14,703 | |||||||||
| Net loss | $ | (328,352) | $ | (525,586) | |||||||
| (1) Includes amortization of acquired intangible assets as follows (in thousands): | Year Ended January 31, | ||||||||||
| 2023 | 2022 | ||||||||||
| Cost of licenses revenue | $ | 2,754 | $ | 2,521 | |||||||
| Cost of subscription services revenue | 1,811 | 1,100 | |||||||||
| Sales and marketing | 2,153 | 1,397 | |||||||||
| General and administrative | 178 | 101 | |||||||||
| Total amortization of acquired intangible assets | $ | 6,896 | $ | 5,119 | |||||||
| (2) Includes stock-based compensation expense as follows (in thousands): | Year Ended January 31, | ||||||||||
| 2023 | 2022 | ||||||||||
| Cost of subscription services revenue | $ | 11,894 | $ | 12,232 | |||||||
| Cost of professional services and other revenue | 11,855 | 29,849 | |||||||||
| Sales and marketing | 154,922 | 237,975 | |||||||||
| Research and development | 102,546 | 135,713 | |||||||||
| General and administrative | 88,623 | 99,814 | |||||||||
| Total stock-based compensation expense | $ | 369,840 | $ | 515,583 | |||||||
61
| (3) Includes employer payroll tax expense related to employee equity transactions as follows (in thousands): | Year Ended January 31, | ||||||||||
| 2023 | 2022 | ||||||||||
| Cost of subscription services revenue | $ | 272 | $ | 1,142 | |||||||
| Cost of professional services and other revenue | 263 | 4,516 | |||||||||
| Sales and marketing | 4,605 | 39,615 | |||||||||
| Research and development | 1,692 | 5,810 | |||||||||
| General and administrative | 930 | 3,001 | |||||||||
| Total employer payroll tax expense related to equity transactions | $ | 7,762 | $ | 54,084 | |||||||
| (4) Includes restructuring expense as follows (in thousands): | Year Ended January 31, | ||||||||||
| 2023 | 2022 | ||||||||||
| Cost of subscription services revenue | $ | 182 | $ | — | |||||||
| Cost of professional services and other revenue | 710 | — | |||||||||
| Sales and marketing | 19,491 | — | |||||||||
| Research and development | 494 | — | |||||||||
| General and administrative | 2,569 | — | |||||||||
| Total restructuring expense | $ | 23,446 | $ | — | |||||||
The following table sets forth our consolidated statement of operations data expressed as a percentage of revenue for the periods indicated:
| Year Ended January 31, | |||||||||||
| 2023 | 2022 | ||||||||||
| Revenue: | |||||||||||
| Licenses | 47 | % | 54 | % | |||||||
| Subscription services | 48 | % | 41 | % | |||||||
| Professional services and other | 5 | % | 5 | % | |||||||
| Total revenue | 100 | % | 100 | % | |||||||
| Cost of revenue: | |||||||||||
| Licenses | 1 | % | 1 | % | |||||||
| Subscription services | 8 | % | 7 | % | |||||||
| Professional services and other | 8 | % | 11 | % | |||||||
| Total cost of revenue | 17 | % | 19 | % | |||||||
| Gross profit | 83 | % | 81 | % | |||||||
| Operating expenses: | |||||||||||
| Sales and marketing | 66 | % | 78 | % | |||||||
| Research and development | 27 | % | 31 | % | |||||||
| General and administrative | 23 | % | 28 | % | |||||||
| Total operating expenses | 116 | % | 137 | % | |||||||
| Operating loss | (33) | % | (56) | % | |||||||
| Interest income | 3 | % | — | % | |||||||
| Other income (expense), net | — | % | (1) | % | |||||||
| Loss before income taxes | (30) | % | (57) | % | |||||||
| Provision for income taxes | 1 | % | 2 | % | |||||||
| Net loss | (31) | % | (59) | % | |||||||
62
Comparison of Fiscal Year 2023 and Fiscal Year 2022
Revenue
| Year Ended January 31, | |||||||||||||||||||||||
| 2023 | 2022 | Change | % Change | ||||||||||||||||||||
| (dollars in thousands) | |||||||||||||||||||||||
| Licenses | $ | 497,836 | $ | 481,427 | $ | 16,409 | 3 | % | |||||||||||||||
| Subscription services | 508,823 | 369,867 | 138,956 | 38 | % | ||||||||||||||||||
| Professional services and other | 51,922 | 40,958 | 10,964 | 27 | % | ||||||||||||||||||
| Total revenue | $ | 1,058,581 | $ | 892,252 | $ | 166,329 | 19 | % | |||||||||||||||
Total revenue increased by $166.3 million, or 19%, for fiscal year 2023 compared to fiscal year 2022, primarily due to a $139.0 million increase in subscription services revenue, related in part to the transition to our Flex Offerings, and a $16.4 million increase in licenses revenue. Approximately 34% of the increase in total revenue was from new customers and the remainder was attributable to existing customers. As we continued to expand our sales efforts in the U.S. and internationally, our revenue increased across all geographical regions.
Cost of Revenue and Gross Margin
| Year Ended January 31, | |||||||||||||||||||||||
| 2023 | 2022 | Change | % Change | ||||||||||||||||||||
| (dollars in thousands) | |||||||||||||||||||||||
| Licenses | $ | 10,421 | $ | 11,888 | $ | (1,467) | (12) | % | |||||||||||||||
| Subscription services | 87,366 | 60,565 | 26,801 | 44 | % | ||||||||||||||||||
| Professional services and other | 82,264 | 96,415 | (14,151) | (15) | % | ||||||||||||||||||
| Total cost of revenue | $ | 180,051 | $ | 168,868 | $ | 11,183 | 7 | % | |||||||||||||||
| Gross margin | 83 | % | 81 | % | |||||||||||||||||||
Total cost of revenue increased by $11.2 million, or 7%, for fiscal year 2023 compared to fiscal year 2022. Cost of licenses revenue decreased primarily due to a $1.9 million decrease in third-party software resale costs, partially offset by an increase in amortization of acquired intangible assets. Cost of subscription services revenue grew primarily due to a $15.4 million increase in personnel-related expenses as a result of higher headcount during fiscal year 2023. Cost of subscription services revenue was also impacted by a $7.2 million increase in hosting and software services expenses, a $1.6 million increase in third-party software resale costs, a $1.1 million increase in depreciation and amortization, and a $0.6 million increase in rent and other administrative costs. Cost of professional services and other revenue decreased primarily due to a $23.3 million decrease in personnel-related expenses, which included an $18.0 million decrease in stock-based compensation expense mostly resulting from the satisfaction of IPO-related performance conditions for RSUs during fiscal year 2022 and a $4.3 million decrease in employer payroll tax expense related to equity transactions, partially offset by a $0.6 million increase in employee termination benefits related to our restructuring actions beginning in the second quarter of fiscal year 2023, and the remainder of which was largely due to a decrease in headcount. Cost of professional services and other revenue was also impacted by an $8.1 million increase in costs associated with the use of third-party vendors to deliver professional services to our customers, a $0.6 million increase in software services expenses, and a $0.4 million increase in travel-related costs.
Our gross margin increased to 83% for fiscal year 2023 compared to 81% for fiscal year 2022, primarily as a result of higher stock-based compensation expense and employer payroll tax on settlement of equity awards recognized in fiscal year 2022 in connection with the satisfaction of IPO-related performance conditions for RSUs.
63
Operating Expenses
Sales and Marketing
| Year Ended January 31, | |||||||||||||||||||||||
| 2023 | 2022 | Change | % Change | ||||||||||||||||||||
| (dollars in thousands) | |||||||||||||||||||||||
| Sales and marketing | $ | 701,558 | $ | 697,682 | $ | 3,876 | 1 | % | |||||||||||||||
| Percentage of revenue | 66 | % | 78 | % | |||||||||||||||||||
Sales and marketing expense increased by $3.9 million, or 1%, for fiscal year 2023 compared to fiscal year 2022. This increase was primarily attributable to a $24.6 million increase in sales commissions, a $13.1 million increase in brand marketing and travel expenses due to the resumption of in-person events and user conferences (including our Forward 5 event), and an $8.2 million increase in software services costs used in sales support. Sales and marketing expense was also impacted by an $8.2 million increase in third-party consulting fees, a $3.2 million increase in rent, a $1.8 million increase in depreciation and amortization, and a $1.6 million increase in hosting costs. These increases were partially offset by a $57.0 million decrease in personnel-related expenses, which included an $83.1 million decrease in stock-based compensation mostly resulting from the satisfaction of IPO-related performance conditions for RSUs during fiscal 2022 and a $34.7 million decrease in employer payroll tax expense related to equity transactions, partially offset by a $38.0 million increase in salary-related expenses, a $19.0 million increase in employee termination benefits related to our restructuring actions beginning in the second quarter of fiscal year 2023, and a $3.8 million increase in general employee severance and other retirement benefits.
Research and Development
| Year Ended January 31, | |||||||||||||||||||||||
| 2023 | 2022 | Change | % Change | ||||||||||||||||||||
| (dollars in thousands) | |||||||||||||||||||||||
| Research and development | $ | 285,750 | $ | 276,657 | $ | 9,093 | 3 | % | |||||||||||||||
| Percentage of revenue | 27 | % | 31 | % | |||||||||||||||||||
Research and development expense increased by $9.1 million, or 3%, for fiscal year 2023 compared to fiscal year 2022. The increase was primarily attributable to a $5.5 million increase in third-party software service and hosting costs, a $2.3 million increase in travel-related expenses, a $1.9 million increase in third-party consulting fees, and a $1.4 million increase in depreciation and amortization and other allocated office costs. Research and development expense was also impacted by a $2.2 million decrease in personnel-related expenses, which included a $33.2 million decrease in stock-based compensation mostly resulting from the satisfaction of IPO-related performance conditions for RSUs during fiscal 2022 and a $4.1 million decrease in employer payroll tax expense related to equity transactions, partially offset by a $26.6 million increase in salaries primarily resulting from increased headcount, a $7.5 million increase in bonuses and other employee benefits, and a $0.4 million increase in employee termination benefits related to our restructuring actions beginning in the second quarter of fiscal year 2023.
General and Administrative
| Year Ended January 31, | |||||||||||||||||||||||
| 2023 | 2022 | Change | % Change | ||||||||||||||||||||
| (dollars in thousands) | |||||||||||||||||||||||
| General and administrative | $ | 239,505 | $ | 249,991 | $ | (10,486) | (4) | % | |||||||||||||||
| Percentage of revenue | 23 | % | 28 | % | |||||||||||||||||||
General and administrative expense decreased by $10.5 million, or 4%, for fiscal year 2023 compared to fiscal year 2022. This decrease was primarily attributable to a $6.7 million decrease in personnel-related expenses, which included an $11.2 million decrease in stock-based compensation mostly resulting from the satisfaction of IPO-related performance conditions for RSUs during fiscal 2022 and a $2.1 million decrease in employer payroll tax expense related to equity transactions, partially offset by a $4.2 million increase in salaries largely due to increased
64
headcount, and a $2.2 million increase in employee termination benefits related to our restructuring actions beginning in the second quarter of fiscal year 2023. General and administrative expense was also impacted by a $6.7 million decrease in third-party consulting fees, a $5.1 million decrease in other tax expense, and a $2.9 million decrease in hosted business applications. These decreases were partially offset by a $4.4 million increase in charitable donations, mainly driven by our contribution of Class A common shares to a donor-advised fund during the second quarter of fiscal year 2023 in connection with our Pledge 1% commitment, a $3.0 million increase in insurance expense, a $1.6 million increase in travel-related costs, a $1.3 million increase in depreciation and amortization, and a $1.1 million increase in rent expense.
Interest Income
| Year Ended January 31, | |||||||||||||||||||||||
| 2023 | 2022 | Change | % Change | ||||||||||||||||||||
| (dollars in thousands) | |||||||||||||||||||||||
| Interest income | $ | 27,955 | $ | 3,551 | $ | 24,404 | 687 | % | |||||||||||||||
| Percentage of revenue | 3 | % | — | % | |||||||||||||||||||
Interest income increased by $24.4 million, or 687%, for fiscal year 2023 compared to fiscal year 2022 as a result of a period-over-period increase in our marketable securities and the associated impact of increased interest rates on these accounts.
Other Income (Expense), Net
| Year Ended January 31, | |||||||||||||||||||||||
| 2023 | 2022 | Change | % Change | ||||||||||||||||||||
| (dollars in thousands) | |||||||||||||||||||||||
| Other income (expense), net | $ | 2,767 | $ | (13,488) | $ | 16,255 | 121 | % | |||||||||||||||
| Percentage of revenue | — | % | (1) | % | |||||||||||||||||||
Other income, net increased by $16.3 million, or 121%, for fiscal year 2023 compared to fiscal year 2022. The change was primarily attributable to a period-over-period favorable impact from foreign exchange, a period-over-period favorable impact from amortization on marketable securities, and an increase in sublease income during the current year. These increases were partially offset by a nonrecurring benefit recognized in the prior period from foreign currency forward contracts which were terminated at the end of fiscal year 2022.
Provision For Income Taxes
| Year Ended January 31, | |||||||||||||||||||||||
| 2023 | 2022 | Change | % Change | ||||||||||||||||||||
| (dollars in thousands) | |||||||||||||||||||||||
| Provision for income taxes | $ | 10,791 | $ | 14,703 | $ | (3,912) | (27) | % | |||||||||||||||
| Percentage of revenue | 1 | % | 2 | % | |||||||||||||||||||
Provision for income taxes decreased by $3.9 million, or 27%, for fiscal year 2023 compared to fiscal year 2022. The effective tax rate was (3.4)% and (2.9)% for fiscal years 2023 and 2022, respectively. The change was primarily driven by lower foreign tax expenses resulting from lower year-over-year earnings of our cost-plus margin entities, coupled with lower permanent differences in those jurisdictions.
Liquidity and Capital Resources
We have financed operations since our inception primarily through customer payments and net proceeds from sales of equity securities. Our principal uses of cash in recent periods have been to fund our operations, invest in capital expenditures, and engage in various business acquisitions. As of January 31, 2023 and 2022, our principal sources of liquidity were cash, cash equivalents, and marketable securities totaling $1,759.8 million and $1,884.7 million, respectively, and we had an accumulated deficit of $1,824.3 million and $1,495.9 million, respectively. During the fiscal years ended January 31, 2023 and 2022, we reported net losses of $328.4 million and $525.6 million, respectively, and net cash used in operations of $10.0 million and $55.0 million, respectively.
65
In April 2021, we completed our IPO, which resulted in the issuance of 13.0 million shares of our Class A common stock at a public offering price of $56.00 per share, including 3.6 million shares pursuant to the exercise in full of the underwriters’ option to purchase additional shares. Net proceeds were $687.9 million after deducting underwriting discounts and commissions of $35.6 million and offering expenses of $4.5 million.
In February 2021, we completed our Series F preferred stock financing with gross proceeds totaling $750.0 million. In July 2020, we completed our Series E preferred stock financing with gross proceeds totaling $225.9 million. In connection with our IPO, all shares of convertible preferred stock then outstanding automatically converted into shares of Class A common stock.
In October 2020, we entered into the Credit Facility (described further below) with an available borrowing capacity of $200.0 million.
In January 2020, we entered into an Amended and Restated Loan and Security Agreement with HSBC Bank USA, N.A, HSBC Ventures USA Inc., and Silicon Valley Bank, which provided a $100.0 million senior secured revolving credit facility, and which we repaid in full in July 2020.
Our future capital requirements will depend on many factors, including our revenue growth rate, sales of our products and services, license renewal activity, the timing and the amount of cash received from customers, the expansion of sales and marketing activities, the timing and extent of spending to support development efforts, the introduction of new and enhanced products, the continuing market adoption of our products, expenses associated with our international expansion, and the timing and extent of capital expenditures to invest in existing and new office spaces. We may in the future enter into arrangements to acquire or invest in complementary businesses, products, and technologies. We may be required to seek additional equity or debt financing. In the event that we require additional financing, we may not be able to raise such financing on terms acceptable to us or at all. If we are unable to raise additional capital or generate cash flows necessary to expand our operations and invest in continued innovation, we may not be able to compete successfully, which would harm our business, operations and financial condition.
We believe that our existing cash, cash equivalents, marketable securities, payments from customers, and borrowing capacity will be sufficient to fund our anticipated cash requirements for the next twelve months and the long term.
Credit Facility
In October 2020, we entered into the Credit Facility with HSBC Ventures USA Inc., Silicon Valley Bank, Sumitomo Mitsui Banking Corporation, and Mizuho Bank, LTD. Our obligations under the Credit Facility are secured by substantially all of our assets, except for our intellectual property. The Credit Facility contains certain customary covenants, including, but not limited to, those relating to additional indebtedness, liens, asset divestitures, and affiliate transactions. We may use the proceeds of future borrowings under the Credit Facility for refinancing other indebtedness, working capital, capital expenditures, and other general corporate purposes, including permitted business acquisitions.
Borrowings under the Credit Facility bear interest at a base rate, as defined in the Credit Facility, plus a margin of 2.0% or 3.0% depending on the base rate. The Credit Facility is subject to customary fees for loan facilities of this type, including ongoing commitment fees at a rate of 0.25% per annum on the daily amount available to be drawn. As of January 31, 2023, we had no outstanding debt under the Credit Facility.
Although we had a banking relationship with Silicon Valley Bank as of its closure on March 10, 2023, we did not experience any adverse impact to our liquidity or to our current or projected business operations, financial condition, or results of operations as a result such closure. However, uncertainty remains over liquidity concerns in the broader financial services industry, and there may be additional impacts to our business and our industry that we cannot predict at this time.
66
Cash Flows
The following table summarizes our cash flows for the periods presented:
| Year Ended January 31, | |||||||||||
| 2023 | 2022 | ||||||||||
| (dollars in thousands) | |||||||||||
Net cash used in operating activities(1)
|
$ | (9,981) | $ | (54,963) | |||||||
| Net cash used in investing activities | (289,143) | (35,442) | |||||||||
| Net cash (used in) provided by financing activities | (60,669) | 1,469,673 | |||||||||
| (1) Inclusive of: | |||||||||||
| Cash paid for employer payroll taxes related to employee equity transactions | $ | (9,112) | $ | (51,693) | |||||||
| Net (payments) receipts of employee tax withholdings on stock option exercises | (5,394) | 6,382 | |||||||||
| Cash paid for restructuring costs | (19,339) | — | |||||||||
Operating Activities
Our largest source of operating cash is cash generation from sales to our customers. Our primary uses of cash from operating activities are for personnel-related expenses, direct costs to deliver licenses and provide subscription and professional services, and marketing expenses. To date, our operating cash flows have generally been negative and we have supplemented working capital requirements primarily through net proceeds from the sale of equity securities.
Net cash used in operating activities for fiscal year 2023 of $10.0 million was driven by cash payments for operating expenditures, primarily associated with the compensation of our teams, including bonuses paid in the first quarter of fiscal year 2023 and employer payroll taxes related to employee equity transactions. Other cash operating expenditures included payments related to our workforce restructuring, and payments for professional services, software, and office rent. These outflows were partially offset by cash collections from our customers, which were approximately 26% higher than in the prior year.
Net cash used in operating activities for fiscal year 2022 of $55.0 million was driven by cash payments for operating expenditures, primarily associated with the compensation of our teams, including increased year-end fiscal 2021 sales commissions and bonuses paid in the first quarter of fiscal 2022 and employer payroll taxes related to employee equity transactions. Other cash operating expenditures included payments for professional services, software, and office rent.
Investing Activities
Net cash used in investing activities for fiscal year 2023 of $289.1 million was primarily driven by $237.0 million in net purchases of marketable securities, $29.5 million in cash consideration associated with the acquisition of Re:Infer, which is presented net of cash acquired, and $23.8 million in capital expenditures.
Net cash used in investing activities for fiscal year 2022 of $35.4 million was driven by $15.4 million in net purchases of marketable securities, capital expenditures of $8.9 million, payments related to business acquisitions of $5.5 million, capitalized software development costs of $3.0 million, and $2.7 million in other investing activities.
Financing Activities
Net cash used in financing activities for fiscal year 2023 of $60.7 million was primarily driven by payments of tax withholdings on net settlement of equity awards of $73.1 million, net payments of tax withholdings on sell-to-cover equity award transactions of $9.5 million, and $1.5 million in repurchases of unvested early exercised stock options, partially offset by proceeds from ESPP contributions of $15.0 million and proceeds from stock option exercises of $8.4 million.
Net cash provided by financing activities for fiscal year 2022 of $1,469.7 million was primarily driven by $749.8 million in net proceeds from issuance of Series F convertible preferred stock, $692.4 million in net proceeds from our IPO after deducting underwriting expenses and commissions, proceeds from ESPP contributions of $19.0
67
million, proceeds from stock option exercises of $12.2 million, and net receipts of tax withholdings on sell-to-cover equity award transactions of $10.4 million, partially offset by payments of tax withholdings on net settlement of equity awards of $10.5 million, and payments of IPO-related costs of $3.7 million.
Material Cash Requirements
In the normal course of business, we enter into non-cancelable purchase commitments with various parties, mainly for hosting services and software products and services. During fiscal year 2023, we made commitments to purchase $138.1 million of cloud infrastructure services from a third-party vendor and $82.5 million of service credits toward professional services from third-party alliance partners, which together constitute the majority of the increase in our non-cancelable purchase commitments during the fiscal year.
The following table summarizes the aggregate effect that our material contractual obligations as of January 31, 2023 are expected to have on our cash flows in the periods indicated (in thousands):
| Payments Due by Period | |||||||||||||||||||||||||||||
| Total | Less Than 1 Year |
1-3 Years | 3-5 Years | More Than 5 Years |
|||||||||||||||||||||||||
| (dollars in thousands) | |||||||||||||||||||||||||||||
| Operating lease commitments | $ | 93,413 | $ | 11,950 | $ | 17,816 | $ | 14,919 | $ | 48,728 | |||||||||||||||||||
| Purchase commitments | 214,654 | 66,846 | 135,677 | 12,131 | — | ||||||||||||||||||||||||
| Total contractual obligations | $ | 308,067 | $ | 78,796 | $ | 153,493 | $ | 27,050 | $ | 48,728 | |||||||||||||||||||
The amounts in the table above are associated with agreements that are enforceable and legally binding. Obligations under contracts that we can cancel without a significant penalty are not included in the table above.
Critical Accounting Estimates
Our consolidated financial statements are prepared in accordance with U.S. GAAP. The preparation of consolidated financial statements requires management to make estimates and assumptions that affect the amounts of assets and liabilities at the date of the consolidated financial statements and amounts of revenue and expenses reported during the period. Our estimates are based on historical experience and various other assumptions that we believe to be reasonable under the circumstances, and we evaluate our estimates on an ongoing basis. The following are the accounting estimates that we believe have the most significant impact on our consolidated financial statements.
Revenue Recognition
We recognize revenue in accordance with ASC 606, Revenue from Contracts with Customers. ASC 606 requires recognition of revenue when control of promised goods or services is transferred to customers, in an amount that reflects the consideration we expect to be entitled to receive in exchange for those goods or services. Revenue recognition is inherently judgmental, particularly for complex arrangements that include multiple performance obligations, which are common for us. Our most significant judgment relates to allocation of the transaction price, specifically determining the SSP for each performance obligation, which impacts the pattern and timing of revenue recognition.
At the inception of a contract with a customer, we assess the goods or services promised to identify distinct performance obligations. The distinct performance obligations identified in our typical contracts include, but are not limited to, software licenses, SaaS, maintenance and support, and professional services. The pattern and timing of revenue recognition for each of these performance obligations varies. Specifically, revenue from licenses is recognized at the point in time at which the customer is able to use and benefit from the software, which is generally upon delivery to the customer or upon commencement of the renewal term; revenue from SaaS and maintenance and support services is recognized ratably over the contract term; and revenue from professional services is recognized over time as the services are performed.
Most of our contracts contain multiple of these performance obligations. In such arrangements, the transaction price is allocated to the separate performance obligations on a relative SSP basis. Since the performance obligations have different revenue recognition models, SSP estimates directly affect the timing and amount of revenue recognized during a particular period. For example, if the SSP of a license delivered in one
68
period is greater than the SSP of professional services that are sold with that license but delivered in future periods, a greater portion of the transaction price will be recognized at contract inception in the current period versus over time as the services are performed in later periods.
Whenever possible, we allocate the transaction price based on observable SSP, which is the price of the same good or service in standalone sales to similar customers in similar circumstances. If observable SSP is not available, we estimate the SSP using data that may include historical prices, discounting practices, list prices, cost data and other observable inputs. We may have more than one SSP for individual performance obligations when our data population indicates that pricing practices vary by class of customer (for example, based on the customer’s geographic region). We update our SSPs at least annually.
For further information about our revenue recognition, refer to Note 2, Summary of Significant Accounting Policies—Revenue Recognition and Note 3, Revenue Recognition, included in Item 8 of this Annual Report on Form 10-K.
Stock-Based Compensation
We recognize stock-based compensation expense in accordance with the provisions of ASC 718, Compensation—Stock Compensation. ASC 718 requires the measurement and recognition of compensation expense for all stock-based awards made to employees, directors, and non-employees based on the grant date fair value of the awards.
During fiscal year 2023, we granted 30.0 million RSUs and 5.0 million stock options, and issued 1.2 million shares under our ESPP.
RSUs
The fair values of these 30.0 million RSUs were determined based on the closing price of our publicly traded Class A common stock on the respective grant dates (with grant date being the date of approval by the compensation committee of our board or directors or its delegates), and as such were not subject to estimation uncertainty.
Stock Options
The fair values of stock options were determined using the Black-Scholes pricing model, which considers the value of our Class A common stock, exercise price, expected term, expected volatility, risk-free interest rate, and expected dividend yield.
Of the 5.0 million stock options granted, 2.9 million were granted in-the-money with an exercise price of $0.10, which is our current broad-based granting practice in certain non-U.S. jurisdictions; given their immaterial exercise price, the fair values of these in-the-money stock options closely approximated the closing price of our publicly traded Class A common stock on the respective grant dates and were not sensitive to the other inputs to the Black-Scholes pricing model.
The remaining 2.1 million stock options were U.S. executive-level grants with an at-the-money exercise price, the fair values of which were sensitive to the other inputs of the Black-Scholes pricing model. The most subjective of these inputs are as follows:
•Expected term. We do not yet have sufficient relevant historical exercise data to provide a reasonable basis for estimation of expected term post-IPO; we presently use the simplified method permitted under Staff Accounting Bulletin 14, which deems the expected term to be the average of the time-to-vest and the contractual life. The expected term for the aforementioned 2.1 million stock options ranged from 5.3 to 6.1 years.
•Expected volatility. As a public market for our common stock did not exist prior to the IPO, we have limited trading history on which to base expectations of volatility; we presently estimate expected volatility based on the volatility of a group of similar publicly held entities, referred to as “guideline companies,” over a look-back period equivalent to the expected term. In evaluating the similarity of guideline companies, we consider factors such as industry, stage of life cycle, size, and degree of financial leverage. The expected volatility for the aforementioned 2.1 million stock options ranged from 59.4% to 61.8%. Beginning in fiscal year 2024, we will include our own stock price volatility within the group and will continue to increase the weighting of our own volatility over time as sufficient trading history is established.
69
A ten percent change in the Black-Scholes values of these 2.1 million stock options would have impacted our fiscal year 2023 stock-based compensation expense by $0.4 million.
ESPP
The fair values of ESPP awards were determined using the Black-Scholes pricing model, with the most subjective input being expected volatility. As a public market for our common stock did not exist prior to the IPO, we have limited trading history on which to base expectations of volatility; until late fiscal year 2023, we estimated expected volatility based on the volatility of the same group of guideline companies used for our stock options, over a look-back period equal to the six-month term of our ESPP offering periods. Beginning with our most recent offering period in the fourth quarter of fiscal year 2023, having established sufficient trading history, we estimated expected volatility using the volatility of our own Class A common stock over the look-back period. The expected volatility used in valuing ESPP offering periods outstanding during fiscal year 2023 ranged from 47.4% to 84.2%. A ten percent change in the Black-Scholes values of these ESPP awards would have impacted our fiscal year 2023 stock-based compensation expense by $0.8 million.
Recent Accounting Pronouncements
See Note 2, Summary of Significant Accounting Policies—Recently Adopted Accounting Pronouncements, included in Part II, Item 8 of this Annual Report on Form 10-K for more information.
Item 7A. Quantitative and Qualitative Disclosures About Market Risk
We are exposed to market risk in the ordinary course of our business. Market risk represents the risk of loss that may impact our financial position due to adverse changes in financial market prices and rates. Our market risk exposure is principally the result of fluctuations in interest rates and foreign currency exchange rates.
Interest Rate Risk
As of January 31, 2023, we had $1,402.1 million of cash and cash equivalents. Cash and cash equivalents consist of cash in banks, bank deposits, money market accounts, and treasury bills. In addition, we had $357.7 million of marketable securities, consisting of corporate bonds, municipal bonds, agency bonds, commercial paper, and treasury bills. Such interest-earning instruments carry a degree of interest rate risk. The primary objectives of our investment activities are the preservation of capital, the fulfillment of liquidity needs, and the fiduciary control of cash. We do not enter into investments for trading or speculative purposes. The Credit Facility allowed us to borrow up to $200.0 million as of January 31, 2023, but there were no amounts outstanding thereunder. The effect of a hypothetical 10% change in interest rates would not have had a material impact on our consolidated financial statements for fiscal year 2023.
Foreign Currency Exchange Risk
The functional currency of our non-U.S. subsidiaries is the local currency. Asset and liability balances denominated in non-U.S. dollar currencies are translated into U.S. dollars using period-end exchange rates, while translation of revenue and expenses is based on average monthly rates. Translation adjustments are recorded as a component of accumulated other comprehensive income (loss), and transaction gains and losses are recorded in other income (expense), net on our consolidated financial statements. Since the fourth fiscal quarter of 2021, we have from time to time used foreign currency forward contracts to reduce our potential exposure to currency fluctuations. If we are not able to successfully mitigate the risks associated with currency fluctuations, our results of operations could be adversely affected. The estimated translation impact to our consolidated financial statements of a hypothetical 10% change in foreign currency exchange rates would amount to $10.4 million for fiscal year 2023. For fiscal year 2023, approximately 51% of our revenue and approximately 34% of our expenses were denominated in non-U.S. dollar currencies, and we recognized net foreign currency transaction losses of $0.5 million.
70
Item 8. Financial Statements and Supplementary Data
INDEX TO CONSOLIDATED FINANCIAL STATEMENTS
 |
Page |
||||
Report of Independent Registered Public Accounting Firm (PCAOB ID Number |
|||||
Report of Predecessor Auditor (PCAOB ID Number 248)
|
|||||
71
Report of Independent Registered Public Accounting Firm
To the Stockholders and the Board of Directors
UiPath, Inc.:
Opinions on the Consolidated Financial Statements and Internal Control Over Financial Reporting
We have audited the accompanying consolidated balance sheet of UiPath, Inc. and subsidiaries (the Company) as of January 31, 2023, the related consolidated statements of operations, comprehensive loss, convertible preferred stock and stockholders’ equity (deficit), and cash flows for the year ended January 31, 2023, and the related notes (collectively, the consolidated financial statements). We also have audited the Company’s internal control over financial reporting as of January 31, 2023, based on criteria established in Internal Control – Integrated Framework (2013) issued by the Committee of Sponsoring Organizations of the Treadway Commission.
In our opinion, the consolidated financial statements referred to above present fairly, in all material respects, the financial position of the Company as of January 31, 2023, and the results of its operations and its cash flows for the year ended January 31, 2023, in conformity with U.S. generally accepted accounting principles. Also in our opinion, the Company maintained, in all material respects, effective internal control over financial reporting as of January 31, 2023 based on criteria established in Internal Control – Integrated Framework (2013) issued by the Committee of Sponsoring Organizations of the Treadway Commission.
Basis for Opinions
The Company’s management is responsible for these consolidated financial statements, for maintaining effective internal control over financial reporting, and for its assessment of the effectiveness of internal control over financial reporting, included in the accompanying Management's Report on Internal Control Over Financial Reporting. Our responsibility is to express an opinion on the Company’s consolidated financial statements and an opinion on the Company’s internal control over financial reporting based on our audits. We are a public accounting firm registered with the Public Company Accounting Oversight Board (United States) (PCAOB) and are required to be independent with respect to the Company in accordance with the U.S. federal securities laws and the applicable rules and regulations of the Securities and Exchange Commission and the PCAOB.
We conducted our audits in accordance with the standards of the PCAOB. Those standards require that we plan and perform the audits to obtain reasonable assurance about whether the consolidated financial statements are free of material misstatement, whether due to error or fraud, and whether effective internal control over financial reporting was maintained in all material respects.
Our audit of the consolidated financial statements included performing procedures to assess the risks of material misstatement of the consolidated financial statements, whether due to error or fraud, and performing procedures that respond to those risks. Such procedures included examining, on a test basis, evidence regarding the amounts and disclosures in the consolidated financial statements. Our audit also included evaluating the accounting principles used and significant estimates made by management, as well as evaluating the overall presentation of the consolidated financial statements. Our audit of internal control over financial reporting included obtaining an understanding of internal control over financial reporting, assessing the risk that a material weakness exists, and testing and evaluating the design and operating effectiveness of internal control based on the assessed risk. Our audits also included performing such other procedures as we considered necessary in the circumstances. We believe that our audits provide a reasonable basis for our opinions.
Definition and Limitations of Internal Control Over Financial Reporting
A company’s internal control over financial reporting is a process designed to provide reasonable assurance regarding the reliability of financial reporting and the preparation of financial statements for external purposes in accordance with generally accepted accounting principles. A company’s internal control over financial reporting includes those policies and procedures that (1) pertain to the maintenance of records that, in reasonable detail, accurately and fairly reflect the transactions and dispositions of the assets of the company; (2) provide reasonable assurance that transactions are recorded as necessary to permit preparation of financial statements in accordance with generally accepted accounting principles, and that receipts and expenditures of the company are being made only in accordance with authorizations of management and directors of the company; and (3) provide reasonable assurance regarding prevention or timely detection of unauthorized acquisition, use, or disposition of the company’s assets that could have a material effect on the financial statements.
72
Because of its inherent limitations, internal control over financial reporting may not prevent or detect misstatements. Also, projections of any evaluation of effectiveness to future periods are subject to the risk that controls may become inadequate because of changes in conditions, or that the degree of compliance with the policies or procedures may deteriorate.
Critical Audit Matter
The critical audit matter communicated below is a matter arising from the current period audit of the consolidated financial statements that was communicated or required to be communicated to the audit committee and that: (1) relates to accounts or disclosures that are material to the consolidated financial statements and (2) involved our especially challenging, subjective, or complex judgments. The communication of a critical audit matter does not alter in any way our opinion on the consolidated financial statements, taken as a whole, and we are not, by communicating the critical audit matter below, providing a separate opinion on the critical audit matter or on the accounts or disclosures to which it relates.
Revenue Recognition - Assessment of Terms and Conditions in Certain Contracts
As discussed in Note 2 to the consolidated financial statements, the Company derives revenue primarily from term licenses, maintenance and support services, SaaS products, and professional services. For contracts with multiple performance obligations, management allocates the transaction price of the contract to each performance obligation and recognizes revenue when, or as, a performance obligation is satisfied. Management applies judgment in identifying and evaluating any terms and conditions in contracts that may impact revenue recognition. For the year ended January 31, 2023, the Company recorded revenue of $1.06 billion.
We identified the assessment of terms and conditions in certain contracts as a critical audit matter. Specifically, complex auditor judgement was required in assessing the Company’s identification and evaluation of terms and conditions in certain contracts because of the complex accounting guidance, primarily related to the sale of term licenses.
The following are the primary procedures we performed to address this critical audit matter. We evaluated the design and tested the operating effectiveness of certain internal controls within the related revenue recognition process, including a control related to the identification and evaluation of terms and conditions in certain contracts that impact revenue recognition. For a selection of contracts, we assessed the terms and conditions in the contracts by examining the contracts and evaluating management’s determination of the impact of those terms and conditions on revenue recognition. For each of these contracts selected, we also assessed the recorded revenue by determining the revenue to be recorded in the current period using the terms and conditions in the underlying contract and comparing it to the Company’s recorded balances.
/s/ KPMG LLP
We have served as the Company’s auditor since 2022.
March 24, 2023
73
|
REPORT OF INDEPENDENT REGISTERED PUBLIC ACCOUNTING FIRM
Board of Directors and Stockholders
UiPath, Inc.
Opinion on the financial statements
We have audited the accompanying consolidated balance sheet of UiPath, Inc. (a Delaware corporation) and subsidiaries (the “Company”) as of January 31, 2022, the related consolidated statements of operations, comprehensive loss, convertible preferred stock and stockholders’ equity, and cash flows for each of the two years in the period ended January 31, 2022, and the related notes (collectively referred to as the “financial statements”). In our opinion, the financial statements present fairly, in all material respects, the financial position of the Company as of January 31, 2022, and the results of its operations and its cash flows for each of the two years in the period ended January 31, 2022, in conformity with accounting principles generally accepted in the United States of America.
Basis for opinion
These financial statements are the responsibility of the Company’s management. Our responsibility is to express an opinion on the Company’s financial statements based on our audits. We are a public accounting firm registered with the Public Company Accounting Oversight Board (United States) (“PCAOB”) and are required to be independent with respect to the Company in accordance with the U.S. federal securities laws and the applicable rules and regulations of the Securities and Exchange Commission and the PCAOB.
We conducted our audits in accordance with the standards of the PCAOB. Those standards require that we plan and perform the audit to obtain reasonable assurance about whether the financial statements are free of material misstatement, whether due to error or fraud. The Company is not required to have, nor were we engaged to perform, an audit of its internal control over financial reporting. As part of our audits we are required to obtain an understanding of internal control over financial reporting but not for the purpose of expressing an opinion on the effectiveness of the Company’s internal control over financial reporting. Accordingly, we express no such opinion.
Our audits included performing procedures to assess the risks of material misstatement of the financial statements, whether due to error or fraud, and performing procedures that respond to those risks. Such procedures included examining, on a test basis, evidence regarding the amounts and disclosures in the financial statements. Our audits also included evaluating the accounting principles used and significant estimates made by management, as well as evaluating the overall presentation of the financial statements. We believe that our audits provide a reasonable basis for our opinion.
/s/
We served as the Company’s auditor from 2018 to 2022.
April 4, 2022
| ||
74
UiPath, Inc.
Consolidated Balance Sheets
Amounts in thousands except per share data
As of January 31, |
|||||||||||
| 2023 | 2022 | ||||||||||
| ASSETS | |||||||||||
| Current assets | |||||||||||
| Cash and cash equivalents | $ | $ | |||||||||
| Marketable securities | |||||||||||
Accounts receivable, net of allowance for credit losses of $ |
|||||||||||
| Contract assets | |||||||||||
| Deferred contract acquisition costs | |||||||||||
| Prepaid expenses and other current assets | |||||||||||
| Total current assets | |||||||||||
| Marketable securities, non-current | |||||||||||
| Contract assets, non-current | |||||||||||
| Deferred contract acquisition costs, non-current | |||||||||||
| Property and equipment, net | |||||||||||
| Operating lease right-of-use assets | |||||||||||
| Intangible assets, net | |||||||||||
| Goodwill | |||||||||||
| Deferred tax assets | |||||||||||
| Other assets, non-current | |||||||||||
| Total assets | $ | $ | |||||||||
| LIABILITIES AND STOCKHOLDERS’ EQUITY | |||||||||||
| Current liabilities | |||||||||||
| Accounts payable | $ | $ | |||||||||
| Accrued expenses and other current liabilities | |||||||||||
| Accrued compensation and employee benefits | |||||||||||
| Deferred revenue | |||||||||||
| Total current liabilities | |||||||||||
| Deferred revenue, non-current | |||||||||||
| Operating lease liabilities, non-current | |||||||||||
| Other liabilities, non-current | |||||||||||
| Total liabilities | |||||||||||
| Commitments and contingencies (Note 11) | |||||||||||
| Stockholders’ equity: | |||||||||||
Preferred stock, $ |
|||||||||||
Class A common stock, $ |
|||||||||||
Class B common stock, $ |
|||||||||||
| Additional paid-in capital | |||||||||||
| Accumulated other comprehensive income | |||||||||||
| Accumulated deficit | ( |
( |
|||||||||
| Total stockholders’ equity | |||||||||||
| Total liabilities and stockholders’ equity | $ | $ | |||||||||
The accompanying notes are an integral part of these consolidated financial statements.
75
UiPath, Inc.
Consolidated Statements of Operations
Amounts in thousands except per share data
Year Ended January 31, |
|||||||||||||||||
| 2023 | 2022 | 2021 | |||||||||||||||
| Revenue: | |||||||||||||||||
| Licenses | $ | $ | $ | ||||||||||||||
| Subscription services | |||||||||||||||||
| Professional services and other | |||||||||||||||||
| Total revenue | |||||||||||||||||
| Cost of revenue: | |||||||||||||||||
| Licenses | |||||||||||||||||
| Subscription services | |||||||||||||||||
| Professional services and other | |||||||||||||||||
| Total cost of revenue | |||||||||||||||||
| Gross profit | |||||||||||||||||
| Operating expenses: | |||||||||||||||||
| Sales and marketing | |||||||||||||||||
| Research and development | |||||||||||||||||
| General and administrative | |||||||||||||||||
| Total operating expenses | |||||||||||||||||
| Operating loss | ( |
( |
( |
||||||||||||||
| Interest income | |||||||||||||||||
| Other income (expense), net | ( |
||||||||||||||||
| Loss before income taxes | ( |
( |
( |
||||||||||||||
| Provision for (benefit from) income taxes | ( |
||||||||||||||||
| Net loss | $ | ( |
$ | ( |
$ | ( |
|||||||||||
| Net loss per share attributable to common stockholders, basic and diluted | $ | ( |
$ | ( |
$ | ( |
|||||||||||
| Weighted-average shares used in computing net loss per share attributable to common stockholders, basic and diluted | |||||||||||||||||
The accompanying notes are an integral part of these consolidated financial statements.
76
UiPath, Inc.
Consolidated Statements of Comprehensive Loss
Amounts in thousands
Year Ended January 31, |
|||||||||||||||||
| 2023 | 2022 | 2021 | |||||||||||||||
| Net loss | $ | ( |
$ | ( |
$ | ( |
|||||||||||
| Other comprehensive (loss) income, net of tax: | |||||||||||||||||
| Unrealized loss on available-for-sale marketable securities, net |
( |
( |
( |
||||||||||||||
| Foreign currency translation adjustments | ( |
( |
|||||||||||||||
| Other comprehensive (loss) income | ( |
( |
|||||||||||||||
| Comprehensive loss | $ | ( |
$ | ( |
$ | ( |
|||||||||||
The accompanying notes are an integral part of these consolidated financial statements.
77
UiPath, Inc.
Consolidated Statements of Convertible Preferred Stock and Stockholders’ Equity (Deficit)
Amounts in thousands
| Convertible preferred stock | Common stock (Class A) |
Common stock (Class B) |
Additional paid-in capital |
Accumulated other comprehensive income (loss) |
Accumulated deficit |
Total stockholders’ equity (deficit) | ||||||||||||||||||||||||||||||||||||||||||||||||||||||||
| Shares | Amount | Shares | Amount | Shares | Amount | Amount | Amount | Amount | Amount | |||||||||||||||||||||||||||||||||||||||||||||||||||||
| Balance as of January 31, 2020 |
|
$ |
|
|
$ |
|
|
$ |
|
$ |
|
$ |
|
$ | ( |
$ | ( |
|||||||||||||||||||||||||||||||||||||||||||||
Issuance of convertible preferred stock, net of issuance costs of $ |
— | — | — | — | — | — | — | — | ||||||||||||||||||||||||||||||||||||||||||||||||||||||
| Issuance of common stock upon exercise of stock options and restricted stock awards | — | — | — | — | — | — | ||||||||||||||||||||||||||||||||||||||||||||||||||||||||
| Issuance of common stock upon vesting of restricted stock awards | — | — | — | — | — | — | — | |||||||||||||||||||||||||||||||||||||||||||||||||||||||
| Stock-based compensation expense related to common stock secondary transactions | — | — | — | ( |
— | — | — | |||||||||||||||||||||||||||||||||||||||||||||||||||||||
| Stock-based compensation | — | — | — | — | — | — | — | — | ||||||||||||||||||||||||||||||||||||||||||||||||||||||
| Other comprehensive loss, net of tax | — | — | — | — | — | — | — | ( |
— | ( |
||||||||||||||||||||||||||||||||||||||||||||||||||||
| Net loss | — | — | — | — | — | — | — | — | ( |
( |
||||||||||||||||||||||||||||||||||||||||||||||||||||
| Balance as of January 31, 2021 |
|
$ |
|
|
$ |
|
|
$ |
|
$ |
|
$ | ( |
$ | ( |
$ | ( |
|||||||||||||||||||||||||||||||||||||||||||||
| Issuance of convertible preferred stock, net of issuance costs | — | — | — | — | — | — | — | — | ||||||||||||||||||||||||||||||||||||||||||||||||||||||
| Conversion of convertible preferred stock to common stock upon initial public offering | ( |
( |
— | — | — | — | ||||||||||||||||||||||||||||||||||||||||||||||||||||||||
| Issuance of common stock upon initial public offering, net of underwriting discounts and commissions and other issuance costs | — | — | — | — | — | — | — | |||||||||||||||||||||||||||||||||||||||||||||||||||||||
| Conversion of shares of Class B common stock into shares of Class A common stock | — | — | — | ( |
— | — | — | — | — | |||||||||||||||||||||||||||||||||||||||||||||||||||||
| Shares issued as consideration for business acquisition | — | — | — | — | — | — | — | |||||||||||||||||||||||||||||||||||||||||||||||||||||||
| Issuance of common stock upon exercise of stock options | — | — | — | — | — | — | — | |||||||||||||||||||||||||||||||||||||||||||||||||||||||
| Vesting of early exercised stock options | — | — | — | — | — | — | — | — | ||||||||||||||||||||||||||||||||||||||||||||||||||||||
| Issuance of common stock under the employee stock purchase plan | — | — | — | — | — | — | — | |||||||||||||||||||||||||||||||||||||||||||||||||||||||
| Issuance of common stock upon settlement of restricted stock units | — | — | — | — | — | — | — | — | — | |||||||||||||||||||||||||||||||||||||||||||||||||||||
| Tax withholdings on settlement of restricted stock units | — | — | ( |
— | — | — | ( |
— | — | ( |
||||||||||||||||||||||||||||||||||||||||||||||||||||
| Stock-based compensation | — | — | — | — | — | — | — | — | ||||||||||||||||||||||||||||||||||||||||||||||||||||||
| Other comprehensive income, net of tax | — | — | — | — | — | — | — | — | ||||||||||||||||||||||||||||||||||||||||||||||||||||||
| Net loss | — | — | — | — | — | — | — | — | ( |
( |
||||||||||||||||||||||||||||||||||||||||||||||||||||
| Balance as of January 31, 2022 |
|
$ |
|
|
$ |
|
|
$ |
|
$ |
|
$ |
|
$ | ( |
$ |
|
|||||||||||||||||||||||||||||||||||||||||||||
| Issuance of common stock upon exercise of stock options | — | — | — | — | — | — | — | |||||||||||||||||||||||||||||||||||||||||||||||||||||||
| Vesting of early exercised stock options | — | — | — | — | — | — | — | — | ||||||||||||||||||||||||||||||||||||||||||||||||||||||
| Issuance of common stock upon settlement of restricted stock units | — | — | — | — | — | — | — | |||||||||||||||||||||||||||||||||||||||||||||||||||||||
| Tax withholdings on settlement of restricted stock units | — | — | ( |
— | — | — | ( |
— | — | ( |
||||||||||||||||||||||||||||||||||||||||||||||||||||
| Charitable donation of Class A common stock | — | — | — | — | — | — | — | |||||||||||||||||||||||||||||||||||||||||||||||||||||||
| Shares issued in connection with business acquisition | — | — | — | — | — | — | — | |||||||||||||||||||||||||||||||||||||||||||||||||||||||
| Issuance of common stock under the employee stock purchase plan | — | — | — | — | — | — | — | |||||||||||||||||||||||||||||||||||||||||||||||||||||||
| Repurchase of unvested early exercised stock options | — | — | ( |
— | — | — | — | — | — | — | ||||||||||||||||||||||||||||||||||||||||||||||||||||
| Stock-based compensation | — | — | — | — | — | — | — | — | ||||||||||||||||||||||||||||||||||||||||||||||||||||||
| Other comprehensive loss, net of tax | — | — | — | — | — | — | — | ( |
— | ( |
||||||||||||||||||||||||||||||||||||||||||||||||||||
| Net loss | — | — | — | — | — | — | — | — | ( |
( |
||||||||||||||||||||||||||||||||||||||||||||||||||||
| Balance as of January 31, 2023 | — | $ | — |
|
$ |
|
|
$ |
|
$ |
|
$ |
|
$ | ( |
$ |
|
|||||||||||||||||||||||||||||||||||||||||||||
The accompanying notes are an integral part of these consolidated financial statements.
78
UiPath, Inc.
Consolidated Statements of Cash Flows
Amounts in thousands
The accompanying notes are an integral part of these consolidated financial statements.
Year Ended January 31, |
|||||||||||||||||
| 2023 | 2022 | 2021 | |||||||||||||||
| Cash flows from operating activities: | |||||||||||||||||
| Net loss | $ | ( |
$ | ( |
$ | ( |
|||||||||||
| Adjustments to reconcile net loss to net cash (used in) provided by operating activities: | |||||||||||||||||
| Depreciation and amortization | |||||||||||||||||
| Amortization of deferred contract acquisition costs | |||||||||||||||||
| Reversal of deferred contract acquisition costs and accrued sales commissions, net | ( |
||||||||||||||||
| Net amortization on marketable securities | ( |
||||||||||||||||
| Abandonment and impairment charges | — | ||||||||||||||||
| Stock-based compensation expense | |||||||||||||||||
| Charitable donation of Class A common stock | |||||||||||||||||
| Amortization of operating lease right-of-use assets | |||||||||||||||||
| Provision for deferred income taxes | ( |
( |
|||||||||||||||
| Other non-cash (credits) charges, net | ( |
||||||||||||||||
| Changes in operating assets and liabilities: | |||||||||||||||||
| Accounts receivable | ( |
( |
( |
||||||||||||||
| Contract assets | ( |
( |
( |
||||||||||||||
| Deferred contract acquisition costs | ( |
( |
( |
||||||||||||||
| Prepaid expenses and other assets | ( |
( |
( |
||||||||||||||
| Accounts payable | ( |
||||||||||||||||
| Accrued expenses and other liabilities | ( |
||||||||||||||||
| Accrued compensation and employee benefits | |||||||||||||||||
| Operating lease liabilities, net | ( |
( |
( |
||||||||||||||
| Deferred revenue | |||||||||||||||||
| Net cash (used in) provided by operating activities | ( |
( |
|||||||||||||||
| Cash flows from investing activities: | |||||||||||||||||
| Purchases of marketable securities | ( |
( |
( |
||||||||||||||
| Sales of marketable securities | |||||||||||||||||
| Maturities of marketable securities | |||||||||||||||||
| Purchases of property and equipment | ( |
( |
( |
||||||||||||||
| Payments related to business acquisitions, net of cash acquired | ( |
( |
( |
||||||||||||||
| Capitalized software development costs | ( |
( |
|||||||||||||||
| Other investing, net (1) | ( |
||||||||||||||||
| Net cash used in investing activities | ( |
( |
( |
||||||||||||||
| Cash flows from financing activities: | |||||||||||||||||
| Proceeds from initial public offering, net of underwriting discounts and commissions | |||||||||||||||||
| Payments of initial public offering costs | ( |
( |
|||||||||||||||
| Proceeds from issuance of convertible preferred stock | |||||||||||||||||
| Issuance costs related to convertible preferred stock | ( |
( |
|||||||||||||||
| Proceeds from exercise of stock options | |||||||||||||||||
| Payments of tax withholdings on net settlement of equity awards | ( |
( |
|||||||||||||||
| Net (payments) receipts of tax withholdings on sell-to-cover equity award transactions | ( |
||||||||||||||||
| Proceeds from employee stock purchase plan contributions | |||||||||||||||||
| Repurchase of unvested early exercised stock options | ( |
||||||||||||||||
| Proceeds from credit agreement | |||||||||||||||||
| Repayment of credit agreement | ( |
||||||||||||||||
| Payment of deferred loan costs related to senior secured credit facility | ( |
||||||||||||||||
| Net cash (used in) provided by financing activities | ( |
||||||||||||||||
| Effect of exchange rate changes | ( |
( |
|||||||||||||||
| Net (decrease) increase in cash, cash equivalents, and restricted cash | ( |
||||||||||||||||
| Cash, cash equivalents, and restricted cash at beginning of period | |||||||||||||||||
| Cash, cash equivalents, and restricted cash at end of period | $ | $ | $ | ||||||||||||||
| Supplemental disclosures of cash flow information: | |||||||||||||||||
| Cash paid for interest | $ | $ | $ | ||||||||||||||
| Cash paid for income taxes | |||||||||||||||||
| Supplemental disclosures of non-cash investing and financing activity: | |||||||||||||||||
| Stock-based compensation capitalized for software development | $ | $ | $ | ||||||||||||||
| Value of shares issued in payment of business acquisitions | |||||||||||||||||
| Deferred consideration related to business acquisitions | |||||||||||||||||
| Reduction in accrued expenses and other liabilities for vesting of early exercised stock options | |||||||||||||||||
| Tax withholdings on net settlement of restricted stock units, accrued but not yet paid | |||||||||||||||||
| Property and equipment included in accounts payable | |||||||||||||||||
79
UiPath, Inc.
Notes to Consolidated Financial Statements
| 1 | Organization and Description of Business | |||||||
UiPath, Inc. (the “Company,” “we,” “us,” or “our”) was incorporated in Delaware in June 2015 and is headquartered in New York, New York. Our end-to-end automation platform, the UiPath Business Automation Platform, offers a robust set of capabilities that allows our customers to discover opportunities for automation, automate using a digital workforce that seamlessly collaborates with humans, and operate a mission critical automation program at scale.
We have legal presence in 32 countries, with our principal operations in the U.S., Romania, and Japan.
| 2 | Summary of Significant Accounting Policies | |||||||
Basis of Presentation
Fiscal Year
Our fiscal year ends on January 31. References to fiscal years 2023, 2022, and 2021 refer to the fiscal years ended January 31, 2023, 2022, and 2021, respectively.
Stock Split
On July 9, 2020, we effected a three -for-one stock split of our outstanding common stock and convertible preferred stock, without any change in the par value per share. All information related to common stock, convertible preferred stock, equity awards, and net loss per share presented in our consolidated financial statements and the accompanying notes reflects the impact of this stock split.
Use of Estimates
The preparation of consolidated financial statements in conformity with U.S. GAAP requires management to make estimates and assumptions that affect the amounts of assets and liabilities at the balance sheet date and the amounts of revenue and expenses reported during the period. We evaluate estimates based on historical and anticipated results, trends, and various other assumptions. Such estimates include, but are not limited to, certain aspects of revenue recognition, estimated expected period of benefit for deferred contract acquisition costs, allowance for credit losses, fair value of financial assets and liabilities, fair value of acquired assets and assumed liabilities, useful lives of long-lived assets, capitalized software development costs, carrying value of operating lease ROU assets and operating lease liabilities, incremental borrowing rates for operating leases, amount of stock-based compensation expense including determination of fair value of common stock prior to our IPO, timing and amount of contingencies, costs related to our restructuring actions, uncertain tax positions, and valuation allowance for deferred income taxes. Actual results could differ from these estimates and assumptions.
80
UiPath, Inc.
Notes to Consolidated Financial Statements
recognized transaction (losses) gains of $(0.5 ) million, $(17.2 ) million, and $22.4 million, respectively, excluding the impact of foreign currency forward contracts, which are discussed below.
Derivative Financial Instruments
From time to time, we use derivative financial instruments, such as foreign currency forward contracts, to manage foreign currency exposures. We account for our derivative instruments as either assets or liabilities and carry them at fair value. These foreign currency contracts are not designated and do not qualify as hedging instruments, as defined by ASC 815, Derivatives and Hedging. Our foreign currency forward contract was terminated on January 28, 2022. We did not have foreign currency forward contracts during fiscal year 2023.
Concentration of Risks
Financial instruments that potentially subject us to significant concentrations of credit risk consist principally of cash and cash equivalents, marketable securities and accounts receivable. We maintain our cash balance at financial institutions that management believes are high-credit, quality financial institutions, where deposits exceed the FDIC limits. As of January 31, 2023 and 2022, 98 % and 96 % of our cash and cash equivalents were concentrated in the U.S., EU countries, and Japan, respectively.
We extend differing levels of credit to customers based on creditworthiness, do not require collateral deposits, and when necessary maintain reserves for potential credit losses based upon the expected collectability of accounts receivable. We manage credit risk related to our customers by performing periodic evaluations of creditworthiness and applying other credit risk monitoring procedures.
Fair Value of Financial Instruments
We utilize valuation techniques that maximize the use of observable inputs and minimize the use of unobservable inputs to the extent possible. We determine fair value based on assumptions that market participants would use in pricing an asset or liability in the principal or most advantageous market. When considering market participant assumptions in fair value measurements, the fair value hierarchy distinguishes between observable and unobservable inputs, which are categorized in one of the following levels:
Level 1—Quoted prices in active markets for identical assets or liabilities that we can access at the measurement date.
Level 2—Inputs other than quoted prices included within Level 1 that are observable for the asset or liability, either directly or indirectly, such as:
•quoted prices for similar assets or liabilities in active markets;
•quoted prices for identical or similar assets or liabilities in markets that are not active; or
•inputs other than quoted prices that are observable or can be corroborated by observable market data.
Level 2 inputs must be observable for substantially the full term of the asset or liability.
Level 3—Unobservable inputs for the asset or liability that are supported by little or no market activity and that are significant to the fair value.
Financial instruments consist of cash equivalents, marketable securities, accounts receivable, derivative financial instruments, and accounts payable. Marketable securities and derivative instruments are recorded at fair
81
UiPath, Inc.
Notes to Consolidated Financial Statements
Cash and Cash Equivalents
We consider all highly liquid investments purchased with original maturity dates of three months or less to be cash equivalents.
Marketable Securities
Our marketable securities consist of corporate bonds, municipal bonds, agency bonds, treasury bills and commercial paper with original maturity dates of more than three months from the date of purchase. We determine the appropriate classification of our marketable securities at the time of purchase and reevaluate such designation at each balance sheet date. We have classified and accounted for our marketable securities as available-for-sale securities based on our intentions with regard to these instruments and we classify them as current or non-current assets in the consolidated balance sheets based on their stated maturity dates.
The fair value of available-for-sale marketable securities is remeasured each reporting period. Any premiums and discounts are amortized or accreted over the life of the related available-for-sale security as an adjustment to yield. Interest income is recognized when earned. Unrealized gains and losses on marketable securities are reported as a separate component of accumulated other comprehensive income on the consolidated balance sheets until realized.
82
UiPath, Inc.
Notes to Consolidated Financial Statements
Property and Equipment, Net
Property and equipment are recorded at historical cost, less accumulated depreciation. Property and equipment are depreciated on a straight-line basis over the estimated useful lives of the assets. Useful lives by asset category are as follows:
| Asset Category | Estimated Useful Life | |||||||
| Computer and equipment | ||||||||
| Furniture and fixtures | ||||||||
| Leasehold improvements |
Shorter of remaining lease term or estimated useful life
(
|
|||||||
Internal-Use Software
Pursuant to ASC 350-40, Internal Use Software, we capitalize costs incurred to implement cloud computing arrangements that are service contracts and costs incurred to develop internal-use software, which has historically included our SaaS products. ASC 350-40 prescribes capitalization of costs incurred during the application development stage, costs incurred to develop or obtain software that allows for access to or conversion of old data by new systems, and costs incurred in connection with upgrades and enhancements to internal-use software if it is probable that such expenditures will result in additional functionality. These capitalized costs exclude training costs, project management costs, and data migration costs. We evaluate our long-lived assets, including these capitalized costs, for indicators of possible impairment when events or changes in circumstances indicate the carrying amount of an asset or asset group may not be recoverable.
Beginning in the fourth quarter of fiscal 2022, we began to broadly market on-premises versions of certain of our SaaS products, thereby establishing a pattern of marketing internal-use software and a rebuttable presumption that we intend to market any SaaS products we develop. As a result, our ongoing and future SaaS projects must be accounted for under ASC 985-20, Costs of Software to be Sold, Leased or Marketed, which is discussed below under "Software Development Costs."
Costs previously capitalized under ASC 350-40 in connection with development of our SaaS products are amortized on a straight-line basis over the product’s estimated useful life of five years and are included in cost of subscription services revenue on the consolidated statements of operations. Capitalized costs include salaries, benefits, and stock-based compensation charges for employees that are directly involved in developing our SaaS products. These capitalized costs are included in other assets, non-current on the consolidated balance sheets. Gross capitalized internal-use software development costs were $7.5 million and $10.1 million as of January 31, 2023 and 2022, respectively. Amortization expense was $1.3 million, $1.2 million, and $0.5 million for fiscal years 2023, 2022, and 2021, respectively. Accumulated amortization was $3.0 million and $1.7 million as of January 31, 2023 and 2022, respectively.
Software Development Costs
We account for costs incurred to develop software to be licensed in accordance with ASC 985-20, Costs of Software to be Sold, Leased or Marketed. These costs include internal development costs and license fees paid to third parties for their software that is integrated into our products. Beginning in the fourth quarter of fiscal year 2022, we also account for costs incurred to develop our SaaS products in accordance with ASC 985-20. This guidance requires that all costs to establish technological feasibility be expensed as they are incurred. Technological feasibility is established when the working model is complete. Costs incurred subsequent to establishing
83
UiPath, Inc.
Notes to Consolidated Financial Statements
technological feasibility are capitalized until the product is available for general release to customers, at which point they are amortized on a product-by-product basis. Management evaluates the useful life of these assets on an annual basis and tests for impairment whenever events or changes in circumstances occur that could impact their recoverability.
Our internal development costs are amortized over the estimated useful life of the software, which is five years , on a straight-line basis, and are included in cost of licenses revenue or cost of subscription services revenue in the consolidated statements of operations based on the nature of the underlying product. Capitalized costs include salaries, benefits, and stock-based compensation charges for employees that are directly involved in developing our products. Capitalized costs are included in other assets, non-current on the consolidated balance sheets. Gross capitalized software development costs were $4.3 0.9 million, $0.7 million, and $0.5 million for fiscal years 2023, 2022 and 2021, respectively. Accumulated amortization was $2.1 million and $1.2 million as of January 31, 2023 and 2022, respectively.
Leases
We determine if an arrangement contains a lease at inception based on whether there is an identified asset and whether we control the use of the identified asset throughout the period of use. We classify leases as either financing or operating leases. We do not have any financing leases.
Operating lease liabilities represent our obligation to make payments arising from a lease. Operating lease liabilities are recognized at the lease commencement date based on the present value of future lease payments over the lease term. The present value of lease payments is discounted based on our incremental borrowing rate unless the rate implicit in the lease is readily determinable, which generally is not the case. We estimate our incremental borrowing rate based on information available at the lease commencement date for collateralized borrowings with a similar term, amount, borrower creditworthiness, and economic environment.
Operating lease ROU assets represent our right to use an underlying asset for the lease term. Our operating lease ROU assets are measured based on the corresponding operating lease liability adjusted for (1) payments made to the lessor at or before the commencement date, (2) initial direct costs incurred, and (3) tenant incentives under the lease.
Options to renew or terminate the lease are recognized as part of our operating lease ROU assets and operating lease liabilities when it is reasonably certain the options will be exercised.
We do not allocate consideration between lease and non-lease components, such as maintenance costs, as we have elected to not separate lease and non-lease components for any leases within our existing classes of assets. Operating lease expense for fixed lease payments is recognized on a straight-line basis over the lease term. Variable lease payments for real estate taxes, insurance, maintenance, and utilities, which are generally based on our pro-rata share of the total property, are expensed as incurred and are not included in the measurement of the operating lease ROU assets or operating lease liabilities. In addition, we do not recognize ROU assets and lease liabilities for short-term leases which have a lease term of 12 months or less and do not include an option to purchase the underlying asset that we are reasonably certain to exercise. Lease cost for short-term leases is recognized on a straight-line basis over the lease term.
Business Acquisitions
Assets acquired and liabilities assumed in a business combination are recorded at their respective fair values at the date of the acquisition. Determination of the fair value of assets acquired and liabilities assumed relies on
84
UiPath, Inc.
Notes to Consolidated Financial Statements
management judgments and often involves the use of estimates and assumptions, including but not limited to assumptions about future cash inflows and outflows, discount rates, and lives of intangible and other assets. Any excess of the purchase price over the fair value of the net assets acquired is recognized as goodwill.
During the one-year measurement period following an acquisition, we may record adjustments to the fair value of the assets acquired and liabilities assumed, with the corresponding offset to goodwill. Upon the conclusion of the measurement period, subsequent adjustments, if any, are recorded in our consolidated statements of operations.
Acquisition costs, such as legal and consulting fees, are expensed as incurred.
Goodwill and Intangible Assets
Goodwill represents the excess of the purchase price in a business acquisition over the fair value of the net assets acquired and is not amortized. We test goodwill for impairment at the reporting unit level at least annually in November and may test more frequently when events or changes in circumstances indicate that the carrying value may not be recoverable.
At the time of testing, if we determine that it is more likely than not that the estimated fair value of our single reporting unit is less than its carrying value, a quantitative assessment is performed by comparing the fair value of the reporting unit with its carrying value. In order to make this determination, we may make an initial assessment of qualitative factors, or may proceed directly to the quantitative impairment test. There were no
Acquired intangible assets consist primarily of developed technology and customer relationships resulting from our business acquisitions. Intangible assets are recorded at fair value on the date of acquisition and are amortized over their estimated useful lives.
Impairment of Long-Lived Assets
We evaluate our long-lived assets for indicators of possible impairment when events or changes in circumstances suggest that the carrying amount of an asset or asset group may not be recoverable. We assess recoverability by comparing the carrying amount of such asset or asset group to the net undiscounted future cash flows we expect the asset or asset group to generate. If the carrying amount of an asset or asset group exceeds the related undiscounted cash flows, it is considered to be impaired and an impairment charge is recognized for the amount by which the carrying value of the asset or asset group exceeds its fair value.
There were no events or changes in circumstances during fiscal years 2023 and 2022 which indicated potential impairment of our long-lived assets. During fiscal year 2020, we concluded that the carrying values of long-lived assets related to our Houston office, including operating lease ROU assets, leasehold improvements, and furniture and fixtures, exceeded their estimated fair values as the result of a restructuring plan.
Revenue Recognition
We derive revenue from the sale of: (1) software licenses for use of our proprietary software and related maintenance and support; (2) the right to access certain software products we host (i.e., SaaS); and (3) professional services. For certain of our products that are available both on-premise and via SaaS, we sell a single offering that allows customers the choice of either deployment option throughout the term of contract. These Flex Offerings are comprised of three types of performance obligations: term license, maintenance and support, and SaaS.
In accordance with ASC 606, Revenue from Contracts with Customers, revenue is recognized when or as a customer obtains control of the promised goods and services. The amount of revenue recognized reflects the consideration to which we expect to be entitled in exchange for those goods or services. To achieve the core principle of ASC 606, we apply the following five steps:
1.Identification of the contract, or contracts, with the customer;
2.Identification of the performance obligations in the contract;
3.Determination of the transaction price;
85
UiPath, Inc.
Notes to Consolidated Financial Statements
4.Allocation of the transaction price to the performance obligations in the contract; and
5.Recognition of the revenue when, or as, a performance obligation is satisfied.
Our significant performance obligations and our application of ASC 606 to each of those performance obligations are discussed in further detail below.
Payment terms and conditions vary by contract type, although terms generally require payment within 30 to 60 days of the invoice date. In certain arrangements, we receive payment from a customer either before or after the performance obligation has been satisfied; however, our contracts do not contain a significant financing component. The primary purpose of our invoicing terms is to provide customers with simplified and predictable ways of purchasing our products and services, not to receive financing from our customers or to provide customers with financing. We apply the practical expedient in ASC 606 and do not evaluate payment terms of one year or less for the existence of a significant financing component. Revenue is recorded net of sales tax. We generally do not offer a right of refund in our contracts.
Licenses
We primarily sell term licenses (including the term license portion of Flex Offerings), which provide customers the right to use software for a specified period of time. Revenue for licenses is recognized at the point in time at which the customer is able to use and benefit from the software, which is generally upon delivery to the customer or upon commencement of the renewal term. For licenses revenue, we generally invoice when the license(s) are provided or annually at contract anniversary.
Subscription Services
We generate subscription services revenue through the provision of: (1) maintenance and support, which include technical support and unspecified updates and upgrades on a when-and-if-available basis for our licenses, and (2) SaaS products, including those sold as part of our Flex Offerings.
Maintenance and support represent stand-ready obligations for which revenue is recognized ratably over the term of the arrangements. For maintenance and support, we generally invoice when the associated license(s) are provided or annually at contract anniversary.
Customers do not have the contractual right to take possession of the software underlying our SaaS products. Therefore, SaaS products are stand-ready obligations to provide access to our products, and the related revenue is recognized ratably over the contractual term of the arrangement, as control of the services is transferred to the customer. We generally invoice for our SaaS products when the customer is provided access and may begin using the SaaS products or annually at contract anniversary.
Professional Services and Other
Professional services and other revenue consists of fees associated with professional services for process automation, customer education, and training services. Our professional services contracts are structured on a time and materials or fixed price basis, and the related revenue is recognized as the services are rendered. We use a cost-based input method as the measure of progress toward satisfying the performance obligation. For professional services, we invoice as the services are provided or in advance.
Contracts with Multiple Performance Obligations
Most of our contracts with customers contain multiple performance obligations. The transaction price is allocated to the separate performance obligations on a relative SSP basis. Whenever possible, we allocate the transaction price based on observable SSP, which is the price of the same good or service in standalone sales to similar customers in similar circumstances. If observable SSP is not available, we estimate the SSP using data that may include historical prices, discounting practices, list prices, cost data, and other observable inputs. Our SSP reflects the amount we would charge for each performance obligation if it were sold separately in standalone sales to similar customers in similar circumstances in similar geographies.
86
UiPath, Inc.
Notes to Consolidated Financial Statements
Consideration Payable to Customers
From time to time, we enter into arrangements wherein we sell our products and services to a customer or partner while also having made commitments to purchase products or services from that customer or partner or make investments to enable that customer or partner to create or enhance their RPA practice. These commitments are treated as consideration payable to a customer, and therefore as a reduction to the transaction price, when it is determined that the payment is not in exchange for a distinct good or service that is priced at fair market value.
Modifications
We frequently modify contracts to offer customers additional products or services. The additional products and services are generally determined to be distinct from those products or services transferred to the customer before the modification. We evaluate whether the price for the additional products and services reflects the SSP in order to determine the appropriate modification model to apply. If the price reflects SSP, the purchase of additional products and services is accounted for as a separate contract. If the price does not reflect SSP, we account for the modification as the termination of the existing contract and the creation of a new contract.
Contract Balances
Contract assets consist of unbilled accounts receivable related to goods or services that have been transferred to customers but whose payment is contingent upon future performance.
Contract liabilities consist of deferred revenue. Revenue is deferred when we invoice in advance of performance under a contract.
Often, certain performance obligations under a contract will be in a contract asset position while other performance obligations under the same contract are in a contract liability position. Contract assets and liabilities pertaining to the same contract are netted in the consolidated balance sheets.
Deferred Contract Acquisition Costs
We defer sales commissions that are incremental to the acquisition of customer contracts. These costs are recorded as deferred contract acquisition costs on the consolidated balance sheets. We determine whether costs should be deferred based on the terms of our sales compensation plans and whether the sales commissions are incremental to a customer contract (i.e. would not have occurred absent the customer contract). Under our current sales compensation plan, commissions for renewals of subscription contracts are not commensurate with the commissions paid on the initial contract.
We allocate deferred contract acquisition costs to performance obligations in proportion to the transaction price allocated to each performance obligation and amortize the costs accordingly. Commissions allocated to licenses and license renewals are expensed at the time the corresponding licenses revenue is recognized. Commissions allocated to subscription services are capitalized and amortized on a straight-line basis over a period of five years for initial contracts, reflecting our estimate of the expected period that we will benefit from those commissions. We determine the period of benefit by taking into consideration the length of our customer contracts, retention rate, the technology lifecycle, and other factors. Commissions paid on renewal contracts that are allocated to subscription services are capitalized and amortized over the renewal term. We apply the practical expedient in ASC 340-40, Other Assets and Deferred Costs to expense costs as incurred for costs to obtain a contract with a customer when the amortization period would have been one year or less.
We periodically review deferred contract acquisition costs to determine whether events or changes in circumstances have occurred that could impact the period of benefit. There were no
During fiscal year 2021, sales commissions for renewal of a subscription contract were commensurate with the sales commissions paid for the acquisition of the initial subscription contract because there was minimal to no difference in sales commission rates between new and renewal contracts. Sales commissions paid upon the initial acquisition of a contract were amortized over the contract term, while sales commissions paid related to renewal contracts were amortized over the renewal term. The change to the sales compensation plan for fiscal 2022 was accounted for as a change in accounting estimate, of which the impact to fiscal year 2021 was $9.2 million, resulting
87
UiPath, Inc.
Notes to Consolidated Financial Statements
Cost of Revenue
Licenses
Cost of licenses revenue consists of all direct costs to deliver our licenses to customers, amortization of software development costs related to our licenses, and amortization of acquired developed technology.
Subscription Services
Cost of subscription services revenue primarily consists of personnel-related expenses of our customer support and technical support teams, including salaries and bonuses, stock-based compensation expense, and employee benefit costs. Cost of subscription services revenue also includes third-party consulting services, hosting costs related to our SaaS products, amortization of acquired developed technology and capitalized development costs related to SaaS products, and allocated overhead. Overhead is allocated to cost of subscription services revenue based on applicable headcount. We recognize these expenses as they are incurred.
Professional Services and Other
Cost of professional services and other revenue primarily consists of personnel-related expenses of our professional services team, including salaries and bonuses, stock-based compensation expense, and employee benefit costs. Cost of professional services and other revenue also includes third-party consulting services and allocated overhead. We recognize these expenses as they are incurred.
Sales and Marketing
Sales and marketing expenses consist primarily of personnel-related expenses associated with our sales and marketing employees and related sales support teams, including salaries and bonuses, stock-based compensation expense, and employee benefit costs, sales and partner commissions, marketing events, advertising costs, travel, trade shows, other marketing materials, and allocated overhead.
Research and Development
Research and development expenses consist primarily of personnel-related expenses, including salaries and bonuses, stock-based compensation expense, and employee benefits costs, for our research and development employees, and allocated overhead. Research and development expenditures are expensed as incurred.
General and Administrative
General and administrative expenses consist primarily of personnel-related expenses, including salaries and bonuses, stock-based compensation expense, and employee benefits costs, associated with our finance, legal, human resources, compliance, and other administrative employees, as well as accounting and legal professional services fees, other corporate-related expenses, and allocated overhead.
Stock-Based Compensation
We recognize stock-based compensation expense in accordance with the provisions of ASC 718, Compensation—Stock Compensation. ASC 718 requires the measurement and recognition of compensation expense for all stock-based awards made to employees, directors, and non-employees based on the grant date fair value of the awards. The fair value of each stock option is determined using the Black-Scholes pricing model. The fair value of each RSU and RSA is determined based on the fair value of our Class A common stock on the grant date. The fair value of ESPP awards is determined using the Black-Scholes pricing model.
88
UiPath, Inc.
Notes to Consolidated Financial Statements
Income Taxes
Pursuant to ASC 740, Income Taxes, we account for our income taxes using the asset and liability method, whereby DTAs and DTLs are recognized based on temporary differences between the bases used for financial reporting and income tax reporting purposes. Deferred income taxes are provided based on the enacted tax rates and laws that will be in effect at the time such temporary differences are expected to reverse. A valuation allowance is provided for DTAs if it is more likely than not that we will not realize those tax assets through future operations.
ASC 740 prescribes a two-step approach to recognizing and measuring uncertain tax positions: (1) evaluate the tax position for recognition by determining if the weight of available evidence indicates that it is more likely than not that the position will be sustained on audit, including resolution of related appeals or litigation processes, if any; and (2) measure the tax benefit as the largest amount which is more likely than not of being realized and effectively settled. We consider many factors when evaluating and estimating tax positions and tax benefits, which may require periodic adjustments, and which may not accurately reflect actual outcomes.
We recognize any interest and penalties related to uncertain tax positions as a component of provision for (benefit from) income taxes in the consolidated statements of operations.
Net Loss Per Share Attributable to Common Stockholders
Basic and diluted net loss per share is calculated by dividing net loss attributable to common stockholders by the weighted average number of shares of common stock outstanding during the period. Net loss is allocated between Class A and Class B common stock based on the weighted-average shares outstanding for each class. Diluted net loss per share is the same as basic net loss per share because potentially dilutive common stock equivalents are anti-dilutive when in a net loss position.
In a period of net income, diluted net income per share would be calculated by giving effect to all potentially dilutive securities outstanding for the period (including unvested RSUs and unexercised stock options under our equity incentive plans, outstanding purchase periods under our ESPP, unvested restricted stock awards and early exercised options subject to repurchase, and returnable common stock issued in connection with business acquisitions) using the treasury stock method.
For past periods in which our convertible preferred stock was outstanding, we computed net income or loss per share using the two-class method. The two-class method requires income available to common stockholders for the period to be allocated between common stock and participating securities based upon their respective rights to receive dividends as if all income for the period had been distributed. We considered our convertible preferred stock to be a participating security, as holders had non-forfeitable dividend rights in the event of our declaration of a dividend for shares of common stock. Our convertible preferred stock did not contractually require holders to participate in our losses. As such, net loss for the relevant periods presented was not allocated to our convertible preferred stock.
All potentially dilutive common stock equivalents were anti-dilutive in fiscal years 2023, 2022, and 2021, as we were in a net loss position for these periods.
89
UiPath, Inc.
Notes to Consolidated Financial Statements
The following table presents our long-lived assets other than financial instruments, net of accumulated depreciation and amortization, by geographic region (in thousands):
| As of January 31, | |||||||||||
| 2023 | 2022 | ||||||||||
| U.S. | $ | $ | |||||||||
| Romania | |||||||||||
| United Kingdom (1) | |||||||||||
| Netherlands | |||||||||||
| Rest of world (1) | |||||||||||
| Total long-lived assets | $ | $ | |||||||||
| (1) Prior period amounts have been expanded to conform to current period presentation | |||||||||||
Variable Interest Entity
When we make an initial investment in or establish other variable interests in an entity, we determine whether that entity is considered a VIE, and, if so, whether we are the primary beneficiary of that VIE. The primary beneficiary of a VIE is a party that meets both of the following criteria: (1) it has the power to direct the activities that most significantly impact the economic performance of the VIE; and (2) it has the obligation to absorb losses or the right to receive benefits that could be potentially significant to the VIE. Periodically, we assess whether any change in our interest in or relationship with the entity affects our determination as to whether the entity is a VIE, and, if so, whether we are the primary beneficiary.
We consolidate any VIE of which we are the primary beneficiary. If we are not the primary beneficiary of a VIE, we account for the investment or other variable interests in that VIE in accordance with the applicable accounting guidance.
During the third quarter of fiscal 2022, we entered into an agreement whereby we have acquired a variable interest in a special purpose LLC owned by our Co-CEO Daniel Dines, that owns a specific aircraft. This arrangement allows us to use the aircraft, when available, for business purposes in the course of our normal operations at rates that approximate the cost of operating the aircraft but that do not exceed current market rates. We determined at the inception of this agreement that the LLC is a VIE. Our variable interest is limited to sharing cost savings; we do not have any obligation to fund losses of the LLC, do not have a minimum commitment related to our use of the aircraft, have not guaranteed the LLC's debt, and do not have any other involvement with the LLC. We have determined that the governance structure of the LLC does not allow us to direct the activities that would significantly impact its economic performance, such as approving terms or pricing associated with the chartering of the aircraft or participating in decision-making related to financing. As such, we are not the primary beneficiary of the LLC and accordingly do not consolidate it in our consolidated financial statements.
Recently Adopted Accounting Pronouncements
In June 2016, the FASB issued ASU No. 2016-13, Financial Instruments—Credit Losses (Topic 326): Measurement of Credit Losses on Financial Instruments, to amend previous accounting guidance that required the measurement of all expected losses to be based on historical experience, current conditions, and reasonable and supportable forecasts. For trade receivables, contract assets, and other financial instruments, the new guidance requires us to use a forward-looking expected loss model that reflects probable losses, rather than the incurred loss model, for recognizing credit losses. We adopted ASU No. 2016-13 and all subsequent amendments on a modified retrospective basis on February 1, 2022, and the adoption did not have a material impact on our consolidated financial statements.
In December 2019, the FASB issued ASU No. 2019-12, Income Taxes (Topic 740)—Simplifying the Accounting for Income Taxes, which is intended to simplify various aspects related to accounting for income taxes. ASU No. 2019-12 removes certain exceptions associated with (1) intraperiod tax allocations, (2) recognition of DTLs for equity method investments of foreign subsidiaries, and (3) the calculation of income taxes in an interim period when in a loss position within the framework of ASC 740. ASU No. 2019-12 also clarifies and amends existing guidance to encourage consistent application. We adopted the applicable provisions of ASU No. 2019-12 on a
90
UiPath, Inc.
Notes to Consolidated Financial Statements
modified retrospective basis on February 1, 2022, and the adoption did not have a material impact on our consolidated financial statements.
In October 2021, the FASB issued ASU No. 2021-08, Business Combinations (Topic 805)—Accounting for Contract Assets and Contract Liabilities from Contracts with Customers, to amend the current accounting guidance in ASC 805 to require entities to apply ASC 606 to recognize and measure contract assets and contract liabilities acquired in a business combination. We early adopted ASU No. 2021-08 on a prospective basis on February 1, 2022, and the adoption did not have a material impact on our consolidated financial statements.
| 3 | Revenue Recognition | |||||||
Disaggregation of Revenue
The following table summarizes revenue by geographical region (dollars in thousands):
| Year Ended January 31, | |||||||||||||||||||||||||||||||||||
| 2023 | 2022 | 2021 | |||||||||||||||||||||||||||||||||
| Amount | Percentage of Revenue |
Amount | Percentage of Revenue |
Amount | Percentage of Revenue |
||||||||||||||||||||||||||||||
Americas(1)
|
$ | % | $ | % | $ | % | |||||||||||||||||||||||||||||
| Europe, Middle East, and Africa | % | % | % | ||||||||||||||||||||||||||||||||
Asia-Pacific(2)
|
% | % | % | ||||||||||||||||||||||||||||||||
| Total revenue | $ | % | $ | % | $ | % | |||||||||||||||||||||||||||||
(1)Revenue from the U.S. represented 46 %, 43 % and 39 % of our total revenues for fiscal years 2023, 2022, and 2021, respectively.
(2)Revenue from Japan represented 10 %, 11 % and 14 % of our total revenues for fiscal years 2023, 2022, and 2021, respectively.
Contract Balances
Significant changes in our contract assets and deferred revenue balances during the periods presented were as follows (in thousands):
Year Ended January 31, |
||||||||||||||
| Contract Assets | 2023 | 2022 | ||||||||||||
| Beginning balance | $ | $ | ||||||||||||
| Contract assets recognized during the year | ||||||||||||||
| Amounts transferred to accounts receivable from unbilled accounts receivable presented at the beginning of the year | ( |
( |
||||||||||||
| Translation adjustments | ( |
( |
||||||||||||
| Ending balance | $ | $ | ||||||||||||
| Contract assets, current | $ | $ | ||||||||||||
| Contract assets, non-current | ||||||||||||||
| Total contract assets | $ | $ | ||||||||||||
91
UiPath, Inc.
Notes to Consolidated Financial Statements
Year Ended January 31, |
||||||||||||||
| Deferred Revenue | 2023 | 2022 | ||||||||||||
| Beginning balance | $ | $ | ||||||||||||
| Additions to deferred revenue during the year | ||||||||||||||
| Additions to deferred revenue from business acquisitions | ||||||||||||||
| Revenue recognized that was included in deferred revenue at the beginning of the period | ( |
( |
||||||||||||
| Revenue recognized that was not included in deferred revenue at the beginning of the period | ( |
( |
||||||||||||
| Translation adjustments | ( |
( |
||||||||||||
| Ending balance | $ | $ | ||||||||||||
| Deferred revenue, current | $ | $ | ||||||||||||
| Deferred revenue, non-current | ||||||||||||||
| Total deferred revenue | $ | $ | ||||||||||||
Remaining Performance Obligations
Our remaining performance obligations are comprised of licenses, subscription services, and professional services and other revenue not yet delivered. As of January 31, 2023, the aggregate amount of the transaction price allocated to remaining performance obligations was $894.0 million, which consists of both billed consideration in the amount of $520.0 million and unbilled consideration in the amount of $374.0 million that we expect to recognize as revenue. We expect to recognize 63 % of our remaining performance obligations as revenue in the next twelve months , and the remainder thereafter.
Deferred Contract Acquisition Costs
Our deferred contract acquisition costs are comprised of sales commissions that represent incremental costs to obtain customer contracts, and are determined based on sales compensation plans. The following table represents a rollforward of our deferred contract acquisition costs (in thousands):
Year Ended January 31, |
|||||||||||
| 2023 | 2022 | ||||||||||
| Beginning balance | $ | $ | |||||||||
| Additions to deferred contract acquisition costs | |||||||||||
| Amortization of deferred contract acquisition costs | ( |
( |
|||||||||
| Translation adjustments | ( |
( |
|||||||||
| Ending balance | $ | $ | |||||||||
| Deferred contract acquisition costs, current | $ | $ | |||||||||
| Deferred contract acquisition costs, non-current | |||||||||||
| Total deferred contract acquisition costs | $ | $ | |||||||||
92
UiPath, Inc.
Notes to Consolidated Financial Statements
| 4 | Marketable Securities | |||||||
The following is a summary of our marketable securities (in thousands):
| As of January 31, 2023 | |||||||||||||||||||||||
| Amortized Cost |
Gross Unrealized Gains |
Gross Unrealized Losses |
Estimated Fair Value |
||||||||||||||||||||
| Commercial paper | $ | $ | $ | $ | |||||||||||||||||||
Treasury bills (1)
|
( |
||||||||||||||||||||||
| Corporate bonds | ( |
||||||||||||||||||||||
| Municipal bonds | ( |
||||||||||||||||||||||
| Agency bonds | ( |
||||||||||||||||||||||
| Total marketable securities | $ | $ | $ | ( |
$ | ||||||||||||||||||
(1) Treasury bills with both amortized cost and estimated fair value of $ | |||||||||||||||||||||||
| As of January 31, 2022 | |||||||||||||||||||||||
| Amortized Cost |
Gross Unrealized Gains |
Gross Unrealized Losses |
Estimated Fair Value |
||||||||||||||||||||
| Commercial paper | $ | $ | $ | $ | |||||||||||||||||||
| Corporate bonds | ( |
||||||||||||||||||||||
| Municipal bonds | ( |
||||||||||||||||||||||
| Total marketable securities | $ | $ | $ | ( |
$ | ||||||||||||||||||
As of January 31, 2023 and 2022, $2.9 million and $19.5 million, respectively, of our marketable securities had remaining contractual maturities of one year or more, and the remainder had contractual maturities of less than one year.
As of January 31, 2023 and 2022, $3.5 million and zero , respectively, of interest receivable was included in prepaid expenses and other current assets on the consolidated balance sheets. The Company did not recognize an allowance for credit losses against interest receivable as of January 31, 2023.
Unrealized losses during the period are a result of changes in market conditions. We do not believe that any unrealized losses are attributable to credit-related factors based on our evaluation of available evidence. To determine whether a decline in value is related to credit loss, we evaluate, among other factors: the extent to which the fair value is less than the amortized cost basis and any adverse conditions specifically related to an issuer of a security or its industry.
93
UiPath, Inc.
Notes to Consolidated Financial Statements
| 5 | Fair Value Measurement | |||||||
The following tables present our financial assets and liabilities measured at fair value on a recurring basis as of January 31, 2023 and 2022 (in thousands):
| As of January 31, 2023 | |||||||||||||||||||||||
| Level 1 | Level 2 | Level 3 | Total | ||||||||||||||||||||
| Financial Assets: | |||||||||||||||||||||||
| Money market funds | $ | $ | $ | $ | |||||||||||||||||||
| Treasury bills | |||||||||||||||||||||||
| Total cash equivalents | |||||||||||||||||||||||
| Commercial paper | |||||||||||||||||||||||
| Treasury bills | |||||||||||||||||||||||
| Corporate bonds | |||||||||||||||||||||||
| Municipal bonds | |||||||||||||||||||||||
| Agency bonds | |||||||||||||||||||||||
| Total marketable securities | |||||||||||||||||||||||
| Total | $ | $ | $ | $ | |||||||||||||||||||
| As of January 31, 2022 | |||||||||||||||||||||||
| Level 1 | Level 2 | Level 3 | Total | ||||||||||||||||||||
| Financial Assets: | |||||||||||||||||||||||
| Money market funds | $ | $ | $ | $ | |||||||||||||||||||
| Total cash equivalents | |||||||||||||||||||||||
| Commercial paper | |||||||||||||||||||||||
| Corporate bonds | |||||||||||||||||||||||
| Municipal bonds | |||||||||||||||||||||||
| Total marketable securities | |||||||||||||||||||||||
| Total | $ | $ | $ | $ | |||||||||||||||||||
Our money market funds, treasury bills and agency bonds are classified within Level 1 of the fair value hierarchy because they are valued based on quoted market prices in active markets. We classify commercial paper, corporate bonds, and municipal bonds as Level 2 because they are valued using inputs other than quoted prices which are directly or indirectly observable in the market, including readily-available pricing sources for the identical underlying security which may not be actively traded. None
| 6 | Business Acquisitions | |||||||
Fiscal Year 2023 Acquisitions
Re:infer
On July 29, 2022, we acquired all of the outstanding capital stock of Re:infer, a natural language processing company focused on unstructured documents and communications. Re:infer uses machine learning technology to mine context from communication messages and transform them into actionable data. With this acquisition, we gained technology and an experienced team which we believe will accelerate our technology roadmap, expand the breadth of our current AI-powered automation capabilities, and unlock new automation opportunities for our customers. The Re:infer acquisition was accounted for as a business combination.
94
UiPath, Inc.
Notes to Consolidated Financial Statements
The total purchase consideration for the acquisition of Re:infer was $44.6 million, consisting of the following:
| Cash paid at closing | $ | ||||
Fair value of Class A common stock issued at closing ( |
|||||
| Loan note to be paid on first anniversary of closing (included in accrued expenses and other current liabilities) | |||||
| Loan note to be paid on second anniversary of closing (included in other liabilities, non-current) | |||||
| Working capital adjustment | |||||
| Total | $ | ||||
At closing, we also issued an additional 0.4 million shares of Class A common stock that will be released to sellers in equal installments on the first, second, and third anniversaries of the closing date, subject to certain employment-related clawback provisions. The aggregate fair value of these shares totaled $7.6 million and will be expensed as compensation for post-acquisition services over the three years following the acquisition date.
The following table summarizes the fair values of the assets acquired and liabilities assumed as of the acquisition date (in thousands):
| July 29, 2022 | |||||
| Net tangible assets | $ | ||||
| Intangible assets | |||||
| Goodwill | |||||
| Total assets acquired | |||||
| Deferred tax liabilities assumed | ( |
||||
| Total | $ | ||||
The following table sets forth the identifiable intangible assets acquired and their estimated useful lives as of the date of acquisition:
| Fair Value (in thousands) |
Estimated Useful Life (in years) |
||||||||||
| Developed technology | $ | ||||||||||
| Customer relationships | |||||||||||
| Total | $ | ||||||||||
The acquisition of Re:infer generated goodwill of $34.4 million representing expected synergies and acquired skilled workforce. None of this goodwill is deductible for tax purposes.
During fiscal year 2023, we incurred transaction costs in connection with the Re:infer acquisition of $1.1 million, which are included in general and administrative expenses in the consolidated statements of operations.
Fiscal Year 2022 Acquisitions
Cloud Elements
On March 19, 2021, we acquired all of the outstanding capital stock of Cloud Elements, the provider of an API integration platform for SaaS application providers and the digital enterprise. The acquisition of Cloud Elements brought technology and an experienced team which we believe accelerates our technology roadmap in areas such as native integrations and system event automation triggers. The Cloud Elements acquisition was accounted for as a business combination.
95
UiPath, Inc.
Notes to Consolidated Financial Statements
The total purchase consideration for the acquisition of Cloud Elements was $36.1 million, which consisted of the following (in thousands):
| Amount | |||||
| Cash | $ | ||||
| Fair value of common stock | |||||
| Total | $ | ||||
The following table summarizes the fair values of the assets acquired and liabilities assumed as of the acquisition date (in thousands):
| March 19, 2021 | |||||
| Cash | $ | ||||
| Accounts receivable | |||||
| Other assets | |||||
| Intangible assets | |||||
| Goodwill | |||||
| Total assets acquired | |||||
| Total liabilities assumed | ( |
||||
| Total | $ | ||||
The following table sets forth the identifiable intangible assets acquired and their estimated useful lives as of the date of acquisition:
| Fair Value (in thousands) |
Estimated Useful Life (in years) |
||||||||||
| Developed technology | $ | ||||||||||
| Customer relationships | |||||||||||
| Trade name | |||||||||||
| Total | $ | ||||||||||
The acquisition of Cloud Elements generated $27.7 million in goodwill due to the synergies expected and the skilled workforce acquired. None of this goodwill is deductible for tax purposes.
We incurred transaction costs in connection with the Cloud Elements acquisition of $1.1 million. Of these transaction costs, $0.9 million was included in general and administrative expenses in the consolidated statement of operations for fiscal year 2022, and the remainder was recognized in fiscal year 2021.
| 7 | Intangible Assets and Goodwill | |||||||
Intangible Assets, Net
Intangible assets, net consisted of the following as of January 31, 2023 (dollars in thousands):
| Intangible Assets, Gross |
Accumulated Amortization |
Intangible Assets, Net |
Weighted-Average Remaining Useful Life (Years) |
||||||||||||||||||||
| Developed technology | $ | $ | ( |
$ | |||||||||||||||||||
| Customer relationships | ( |
||||||||||||||||||||||
| Trade names and trademarks | ( |
||||||||||||||||||||||
| Other intangibles | ( |
||||||||||||||||||||||
| Total | $ | $ | ( |
$ | |||||||||||||||||||
96
UiPath, Inc.
Notes to Consolidated Financial Statements
Intangible assets, net consisted of the following as of January 31, 2022 (dollars in thousands):
| Intangible Assets, Gross |
Accumulated Amortization |
Intangible Assets, Net |
Weighted-Average Remaining Useful Life (Years) |
||||||||||||||||||||
| Developed technology | $ | $ | ( |
$ | |||||||||||||||||||
| Customer relationships | ( |
||||||||||||||||||||||
| Trade names and trademarks | ( |
||||||||||||||||||||||
| Other intangibles | ( |
||||||||||||||||||||||
| Total | $ | $ | ( |
$ | |||||||||||||||||||
We record amortization expense associated with acquired developed technology in cost of licenses revenue and cost of subscription services revenue, trade names and trademarks in sales and marketing expense, customer relationships in sales and marketing expense, and other intangibles in general and administrative expense in the consolidated statements of operations. Amortization expense of intangible assets was $6.9 million, $5.1 million and $2.6 million for fiscal years 2023, 2022, and 2021, respectively.
The expected future amortization expense related to intangible assets as of January 31, 2023 was as follows (in thousands):
Year Ended January 31, |
Amount | |||||||
| 2024 | $ | |||||||
| 2025 | ||||||||
| 2026 | ||||||||
| 2027 | ||||||||
| 2028 | ||||||||
| Thereafter | ||||||||
| Total | $ | |||||||
Goodwill
Changes in the carrying amount of goodwill were as follows during the periods presented (in thousands):
| Carrying Amount | |||||
Balance as of January 31, 2021 |
$ | ||||
| Acquisition of Cloud Elements | |||||
| Effect of foreign currency translation | ( |
||||
Balance as of January 31, 2022 |
|||||
| Acquisition of Re:infer | |||||
| Effect of foreign currency translation | |||||
Balance as of January 31, 2023 |
$ | ||||
| 8 | Operating Leases | |||||||
Our operating leases consist of real estate and vehicles and have remaining lease terms of one year to 15 years. For purposes of calculating operating lease liabilities, lease terms may be deemed to include options to extend the lease when it is reasonably certain that we will exercise those options. Our operating lease arrangements do not contain any material restrictive covenants or residual value guarantees.
97
UiPath, Inc.
Notes to Consolidated Financial Statements
Lease costs are presented below (in thousands):
Year Ended January 31, |
|||||||||||||||||
| 2023 | 2022 | 2021 | |||||||||||||||
| Operating lease cost | $ | $ | $ | ||||||||||||||
| Short-term lease cost | |||||||||||||||||
| Variable lease cost | |||||||||||||||||
Sublease income(1)
|
( |
( |
|||||||||||||||
| Total lease cost | $ | $ | $ | ||||||||||||||
(1) Included in other income (expense), net in the consolidated statements of operations
| |||||||||||||||||
Supplemental balance sheet information related to leases is as follows (in thousands):
As of January 31, |
|||||||||||
| 2023 | 2022 | ||||||||||
| Assets: | |||||||||||
| Operating lease right-of-use assets | $ | $ | |||||||||
| Liabilities: | |||||||||||
| $ | $ | ||||||||||
| Operating lease liabilities, non-current | |||||||||||
| Total operating lease liabilities | $ | $ | |||||||||
Supplemental cash flow information related to operating leases was as follows for the periods presented (in thousands):
Year Ended January 31, |
|||||||||||||||||
| 2023 | 2022 | 2021 | |||||||||||||||
| Cash paid for amounts included in the measurement of operating lease liabilities | $ | $ | $ | ||||||||||||||
| Operating lease ROU assets obtained in exchange for new operating lease liabilities | $ | $ | $ | ||||||||||||||
The following table represents the weighted-average remaining lease term and discount rate for the periods presented:
Year Ended January 31, |
|||||||||||
| 2023 | 2022 | ||||||||||
| Weighted-average remaining lease term (years) | |||||||||||
| Weighted-average discount rate | % | % | |||||||||
98
UiPath, Inc.
Notes to Consolidated Financial Statements
Future undiscounted lease payments for our operating lease liabilities as of January 31, 2023 were as follows (in thousands):
| Amount | |||||
Year Ended January 31, |
|||||
| 2024 | $ | ||||
| 2025 | |||||
| 2026 | |||||
| 2027 | |||||
| 2028 | |||||
| Thereafter | |||||
| Total operating lease payments | |||||
| Less: imputed interest | ( |
||||
| Total operating lease liabilities | $ | ||||
As of January 31, 2023, we had non-cancellable commitments in the amount of $2.1 million related to operating leases of real estate facilities that have not yet commenced.
| 9 | Consolidated Balance Sheet Components | |||||||
Prepaid Expenses and Other Current Assets
Prepaid expenses and other current assets consisted of the following (in thousands):
As of January 31, |
|||||||||||
| 2023 | 2022 | ||||||||||
| Prepaid expenses and service credits (1) | $ | $ | |||||||||
| Other current assets (1) | |||||||||||
| Prepaid expenses and other current assets | $ | $ | |||||||||
| (1) Prior period amounts have been combined to conform to current presentation | |||||||||||
Property and Equipment, Net
Property and equipment, net consisted of the following (in thousands):
As of January 31, |
|||||||||||
| 2023 | 2022 | ||||||||||
| Computers and equipment | $ | $ | |||||||||
| Leasehold improvements | |||||||||||
| Furniture and fixtures | |||||||||||
| Construction in progress | |||||||||||
| Property and equipment, gross | |||||||||||
| Less: accumulated depreciation | ( |
( |
|||||||||
| Property and equipment, net | $ | $ | |||||||||
Depreciation expense was $8.6 million, $6.8 million, and $8.4 million for fiscal years 2023, 2022, and 2021, respectively.
99
UiPath, Inc.
Notes to Consolidated Financial Statements
Accrued Expenses and Other Current Liabilities
Accrued expenses and other current liabilities consisted of the following (in thousands):
As of January 31, |
|||||||||||
| 2023 | 2022 | ||||||||||
| Accrued expenses | $ | $ | |||||||||
| Withholding tax from employee equity transactions | |||||||||||
| Employee stock purchase plan withholdings | |||||||||||
| Payroll taxes and other benefits payable | |||||||||||
| Income tax payable | |||||||||||
| Value-added taxes payable | |||||||||||
| Operating lease liabilities, current | |||||||||||
| Deferred consideration for business acquisition, current | |||||||||||
| Other | |||||||||||
| Accrued expenses and other current liabilities | $ | $ | |||||||||
| 10 | Credit Facility | |||||||
On October 30, 2020, we entered into the Credit Facility with HSBC Ventures USA Inc., Silicon Valley Bank, Sumitomo Mitsui Banking Corporation, and Mizuho Bank, LTD. The Credit Facility replaced the two-year $100.0 million senior secured revolving credit agreement described in the Final Prospectus, which was repaid in full in July 2020. Substantive changes from that agreement include a credit limit of $200.0 million, an extension of maturity to October 30, 2023 and the removal of certain financial covenants. The Credit Facility contains certain customary covenants, including, but not limited to, those relating to additional indebtedness, liens, asset divestitures, and affiliate transactions. We may use the proceeds of future borrowings under the Credit Facility for refinancing other indebtedness, working capital, capital expenditures and other general corporate purposes, including permitted business acquisitions. Our obligations under the Credit Facility are secured by substantially all of our assets, except for our intellectual property.
Borrowings under the Credit Facility bear interest at a base rate, as defined in the Credit Facility, plus a margin of 2.0 % or 3.0 % depending on the base rate. The Credit Facility is subject to customary fees for loan facilities of this type, including ongoing commitment fees at a rate of 0.25 % per annum on the daily amount available to be drawn.
As of January 31, 2023 and 2022, there were no
| 11 | Commitments and Contingencies | |||||||
Letters of Credit
We had a total of $4.3 million and $5.3 million in letters of credit outstanding in favor of certain landlords for office space and for credit line facilities as of January 31, 2023 and 2022, respectively. These letters of credit renew annually and expire on various dates through fiscal year 2025.
Indemnification
In the ordinary course of business, we may provide indemnification of varying scope and terms to customers, vendors, directors, and officers with respect to certain matters, including, but not limited to, losses arising out of our breach of such agreements, services to be provided by us, or from intellectual property infringement claims made by third parties.
100
UiPath, Inc.
Notes to Consolidated Financial Statements
These indemnification provisions may survive termination of the underlying agreement and the potential amount of future payments we could be required to make under these indemnification provisions may not be subject to maximum loss clauses. The maximum potential amount of future payments we could be required to make under these indemnification provisions is indeterminable. As of January 31, 2023 and 2022, we have not accrued a liability for these indemnification arrangements because the likelihood of incurring a payment obligation, if any, in connection with these indemnification arrangements was remote.
Workforce Restructuring
On June 24, 2022, our board of directors approved restructuring actions to manage our operating expenses by reducing our global workforce by approximately 5 %. The workforce reduction aimed to simplify our go-to-market approach and improve sales productivity. In connection with these workforce reductions, we also ceased use of our office in Brooklyn, NY. On November 10, 2022, our board of directors approved further restructuring actions to reduce our global workforce across functions by an additional 6 %. We substantially completed these actions and recognized related restructuring costs, consisting predominantly of employee termination benefits and contractual changes, during fiscal year 2023, with any remaining activities expected to be completed by the second quarter of fiscal year 2024. We incurred $23.4 million of expense related to our restructuring actions for fiscal year 2023, of which $22.3 million relates to employee termination benefits and the remainder relates to lease abandonment costs.
The following table shows the total amount incurred during fiscal year 2023 and the liability, which is recorded in accrued compensation and employee benefits in the consolidated balance sheets, for restructuring-related costs as of January 31, 2023 (in thousands):
| Accrued restructuring costs as of January 31, 2022 | $ | ||||
Restructuring costs incurred during fiscal year 2023
|
|||||
Amount paid during fiscal year 2023 |
( |
||||
| Write-off of assets associated with Brooklyn office | ( |
||||
Accrued restructuring costs as of January 31, 2023 |
$ | ||||
The following table shows the restructuring charges incurred during fiscal year 2023 (in thousands):
| Employee Termination Benefits | Lease Exit Costs | Total Restructuring Costs | |||||||||||||||
| Cost of subscription services revenue | $ | $ | $ | ||||||||||||||
| Cost of professional services and other revenue | |||||||||||||||||
| Sales and marketing | |||||||||||||||||
| Research and development | |||||||||||||||||
| General and administrative | |||||||||||||||||
| Total | $ | $ | $ | ||||||||||||||
Defined Contribution Plans
We sponsor retirement plans for qualifying employees, including a 401(k) plan in the U.S. and defined contribution plans in certain other countries, to which we make matching contributions. Our total matching contributions to all defined contribution plans during fiscal years 2023, 2022, and 2021 were $14.5 million, $10.4 million and $5.1 million, respectively.
Litigation
From time to time, we may be involved in lawsuits, claims, investigations, and proceedings, consisting of intellectual property, commercial, employment, and other matters, which arise in the ordinary course of business. In accordance with ASC 450, Contingencies, we make a provision for a liability when it is both probable that a liability has been incurred and the amount of the loss can be reasonably estimated.
We are not presently a party to any litigation the outcome of which, we believe, if determined adversely to us, would individually or taken together have a material adverse effect on our business, operating results, cash flows, or
101
UiPath, Inc.
Notes to Consolidated Financial Statements
financial condition. We have determined that the existence of a material loss is neither probable nor reasonably possible.
Warranty
We warrant to customers that our platform will operate substantially in accordance with its specifications. Historically, no significant costs have been incurred related to product warranties. Based on such historical experience, the probability of incurring such costs in the future is deemed remote. As such, no accruals for product warranty costs have been made.
Non-Cancelable Purchase Obligations
In the normal course of business, we enter into non-cancelable purchase commitments with various parties, mainly for hosting services and software products and services. During fiscal year 2023, we made commitments to purchase $138.1 million of cloud infrastructure services from a third-party vendor and $82.5 million of service credits toward products and services from strategic alliance partners, which together constitute the majority of the increase in our non-cancelable purchase commitments during the fiscal year.
As of January 31, 2023, we had outstanding non-cancelable purchase obligations with a term of 12 months or longer as follows (in thousands):
Year Ended January 31, |
Amount | |||||||
| 2024 | $ | |||||||
| 2025 | ||||||||
| 2026 | ||||||||
| 2027 | ||||||||
| 2028 | ||||||||
| Thereafter | ||||||||
| Total | $ | |||||||
| 12 | Convertible Preferred Stock and Stockholders' Equity (Deficit) | |||||||
Convertible Preferred Stock
| Series of Convertible Preferred Stock |
Shares Authorized |
Shares Issued and Outstanding |
Original Issue Price per Share |
Carrying Value Net of Issuance Costs |
Aggregate Liquidation Preference |
|||||||||||||||||||||||||||
| A-1 | $ | $ | $ | |||||||||||||||||||||||||||||
| A-2 | $ | |||||||||||||||||||||||||||||||
| B-1 | $ | |||||||||||||||||||||||||||||||
| B-2 | $ | |||||||||||||||||||||||||||||||
| C-1 | $ | |||||||||||||||||||||||||||||||
| C-2 | $ | |||||||||||||||||||||||||||||||
| D-1 | $ | |||||||||||||||||||||||||||||||
| D-2 | $ | |||||||||||||||||||||||||||||||
| E | $ | |||||||||||||||||||||||||||||||
| Total | $ | $ | ||||||||||||||||||||||||||||||
102
UiPath, Inc.
Notes to Consolidated Financial Statements
In February 2021, we issued to certain investors approximately 12.0 million shares of Series F convertible preferred stock at a purchase price of $62.28 per share, for an aggregate purchase price of $750.0 million.
The principle rights, privileges, and preferences of our convertible preferred stock were as follows:
Voting
The holder of each share of convertible preferred stock was entitled to the number of votes equal to the number of shares of convertible preferred stock held by such holder as of the record date for determining stockholders entitled to vote. As of January 31, 2021, the holders of the shares of Series A-1 and A-2 convertible preferred stock were entitled to elect two directors, the holders of the shares of Series B-1 and B-2 convertible preferred stock were entitled to elect one director, the holders of the shares of common stock were entitled to elect two directors, and the holders of the shares of common stock and convertible preferred stock, voting together as a single class, were entitled to elect the remaining number of directors.
Redemption and Liquidation
Holders of our convertible preferred stock did not have any date-specific redemption rights. However, certain redemption provisions did apply following certain deemed liquidation events, which are considered contingent redemption provisions that are not solely within our control. Accordingly, the convertible preferred stock was presented outside of permanent equity in the mezzanine section of the consolidated balance sheets as of January 31, 2021.
Conversion
Each share of convertible preferred stock was convertible at the option of the holder without payment of additional consideration at any time into Class A common stock at the relevant Conversion Rate for the series. The initial conversion price per share for each series of convertible preferred stock was equal to the original issue price for such series (i.e., 1 :1 conversion).
Each share of convertible preferred stock was to automatically convert into shares of Class A common stock at the then applicable Conversion Rate upon the earlier to occur of (a) our sale of Class A common stock in an IPO, the price of which is at least equal to the original issue price per share for the Series D convertible preferred stock, and that results in at least $75 million of proceeds in the aggregate (net of underwriting discounts and commissions) (a “Qualified Public Offering”), (b) the date specified by vote or written consent of the preferred majority, or (c) the business day immediately prior to the first trading day with respect to our initial listing of Class A common stock for trading on the Nasdaq Stock Market, the New York Stock Exchange or another exchange or marketplace approved by our board of directors.
Pursuant to the above, immediately prior to the completion of our IPO, all convertible preferred stock outstanding, totaling approximately 306.3 million shares, was automatically converted into an equivalent number of shares of Class A common stock on a one -to-one basis and their carrying value of $1,971.8 million was reclassified to stockholders’ equity.
Preferred Stock
In April 2021, we amended and restated our certificate of incorporation, which authorized 20.0 million shares of preferred stock.
Common Stock
In April 2021, we amended and restated our certificate of incorporation, which authorized a total of 2.0 billion shares of Class A common stock and 115.7 million shares of Class B common stock.
Each share of Class B common stock will convert automatically into Class A common stock, on a one -to-one basis, upon certain circumstances, including: (1) the sale or transfer of such share of Class B common stock (except under certain circumstances described in the amended and restated certificate of incorporation), (2) a date fixed by the board of directors that is no less than 120 days and no more than 180 days following the date that the number of shares of Class B common stock outstanding is less than 20 % of the number of shares of Class B
103
UiPath, Inc.
Notes to Consolidated Financial Statements
common stock outstanding immediately prior to the completion of the IPO, or (3) six months after the death or incapacity of Daniel Dines. The Class A common stock is entitled to one vote per share and the Class B common stock is entitled to thirty-five votes per share.
At IPO, we reserved 2.8 million shares of our Class A common stock to fund our social impact and environmental, social, and governance initiatives. During fiscal year 2023, we contributed 0.3 million shares of our Class A common stock to a donor-advised fund in connection with our Pledge 1% commitment. The aggregate fair value of the shares on the contribution date of $5.5 million was recorded within general and administrative expense in the consolidated statements of operations.
Secondary Transactions
During fiscal year 2021, certain of our employees sold shares of our Class A and Class B common stock to new and existing investors. We recognized $5.0 million in stock-based compensation expense as a result of these transactions related to the excess of the selling price per share paid to the applicable employees over the then-assessed fair market value of the purchased shares. Shares of Class B common stock sold in such secondary transactions each converted into one share of our Class A common stock at closing.
Dividends
Holders of common stock are entitled to receive dividends whenever funds are legally available and when declared by the board of directors, subject to the priority rights of holders of preferred stock. No dividends have been declared by the board of directors from inception through January 31, 2023.
Accumulated Other Comprehensive Income (Loss)
Changes in the components of accumulated other comprehensive income (loss) were as follows during the periods presented (in thousands):
| Foreign Currency Translation Adjustments | Unrealized Loss on Marketable Securities | Accumulated Other Comprehensive Income (Loss) | |||||||||||||||
| Balance as of January 31, 2021 | $ | ( |
$ | ( |
$ | ( |
|||||||||||
| Other comprehensive income (loss), net of tax | ( |
||||||||||||||||
| Balance as of January 31, 2022 | $ | $ | ( |
$ | |||||||||||||
| Other comprehensive loss, net of tax | ( |
( |
( |
||||||||||||||
| Balance as of January 31, 2023 | $ | $ | ( |
$ | |||||||||||||
| 13 | Equity Incentive Plans and Stock-Based Compensation | |||||||
2021 Stock Plan
In April 2021, prior to and in connection with the IPO, we adopted the 2021 Plan, which provides for grants of incentive stock options, nonstatutory stock options, stock appreciation rights, RSAs, RSUs, performance awards, and other forms of awards. As of January 31, 2023, we have reserved 145.9 million shares of our Class A common stock to be issued under the 2021 Plan. In addition, the number of shares of our Class A common stock reserved for issuance under the 2021 Plan will automatically increase on February 1 of each year for a period of 10 years, beginning on February 1, 2022 and continuing through February 1, 2031, in an amount equal to (1) 5 % of the total number of shares of our common stock (both Class A and Class B) outstanding on the preceding January 31, or (2) a lesser number of shares determined by our board of directors no later than the February 1 increase.
104
UiPath, Inc.
Notes to Consolidated Financial Statements
2021 Employee Stock Purchase Plan
In April 2021, prior to and in connection with the IPO, we adopted the ESPP. As of January 31, 2023, the ESPP authorizes the issuance of 15.9 million shares of our Class A common stock under purchase rights granted to our employees or to employees of any of our designated affiliates. The number of shares of our Class A common stock reserved for issuance will automatically increase on February 1 of each year for a period of 10 years, beginning on February 1, 2022 and continuing through February 1, 2031, by the lesser of (1) 1 % of the total number of shares of our common stock (both Class A and Class B) outstanding on the preceding January 31; and (2) 15.5 million shares, except before the date of any such increase, our board of directors may determine that such increase will be less than the amount set forth by (1) and (2) above. The plan allows participants to purchase shares at the lesser of (a) 85 % of the fair market value our Class A common stock as of the commencement of the offering period, and (b) 85 % of the fair market value of our Class A common stock on the corresponding purchase date.
Prior Stock Plans
In June 2015, we adopted the 2015 Plan. The 2015 Plan was terminated in June 2018 in connection with the adoption of the 2018 Plan. Accordingly, no shares are available for future issuance under the 2015 Plan following the adoption of the 2018 Plan.
In June 2018, we adopted the 2018 Plan, which provided for grants of stock-based awards, including RSUs, RSAs, and stock options. The 2018 Plan was terminated in April 2021 in connection with the adoption of the 2021 Plan. Accordingly, no shares are available for future issuance under the 2018 Plan following the adoption of the 2021 Plan.
Outstanding Equity Awards
Stock Options
Stock options generally vest over four years and expire ten years from the date of grant. Vested stock options generally expire three months after termination of employment. Stock option activity during fiscal year 2023 was as follows:
| Options Outstanding | |||||||||||||||||||||||
| Stock Options (in thousands) | Weighted-Average Exercise Price |
Weighted-Average Remaining Contractual Life (Years) |
Aggregate Intrinsic Value (in thousands) |
||||||||||||||||||||
Balance as of January 31, 2022 |
$ | $ | |||||||||||||||||||||
| Granted | $ | ||||||||||||||||||||||
| Exercised | ( |
$ | |||||||||||||||||||||
| Forfeited | ( |
$ | |||||||||||||||||||||
| Expired | $ | ||||||||||||||||||||||
Balance as of January 31, 2023 |
$ | $ | |||||||||||||||||||||
Vested and exercisable as of January 31, 2023 |
$ | $ | |||||||||||||||||||||
The weighted-average grant date fair value of stock options granted during fiscal years 2023, 2022, and 2021 was $12.23 , $45.78 and $17.45 per share, respectively. The intrinsic value of stock options exercised during fiscal years 2023, 2022, and 2021 was $83.6 million, $557.5 million, and $839.0 million, respectively.
As of January 31, 2023, unrecognized compensation expense associated with unvested stock options granted and outstanding was $122.9 million, to be recognized over a weighted-average remaining period of 2.7 years.
105
UiPath, Inc.
Notes to Consolidated Financial Statements
Fair value of each stock option grant was estimated on the date of grant using the Black-Scholes pricing model with the following assumptions:
| 2023 | 2022 | 2021 | |||||||||||||||
| Weighted-Average | Weighted-Average | Range | |||||||||||||||
| Expected term (years) | |||||||||||||||||
| Expected volatility | |||||||||||||||||
| Risk-free interest rate | |||||||||||||||||
| Expected dividend yield | |||||||||||||||||
During fiscal years 2023, 2022, and 2021, our compensation committee approved modifications to allow acceleration of the service-based vesting condition of certain employee stock options upon termination. These modifications, which were considered improbable-to-probable (Type 3) modifications under ASC 718, resulted in accelerated vesting of 0.3 million, 0.2 million and 0.3 million shares of Class A common stock subject to outstanding stock options, and incremental compensation expense of $2.8 million, $2.9 million, and $4.6 million was recognized during fiscal years 2023, 2022, and 2021, respectively.
In July 2020, we repriced 4.6 million stock options which had been issued in fiscal years 2021 and 2020 after the Series D convertible preferred stock financing closing date. In conjunction with the modification of these stock options, we recognized incremental compensation expense of approximately $1.6 million. Expense related to vested shares of $0.9 million was expensed on the repricing date and the remaining amount of $0.7 million related to unvested shares was amortized over the remaining vesting period of such options.
Early Exercised Options
Certain stock option holders have the right to exercise unvested options, subject to a repurchase right held by us at the original exercise price in the event of voluntary or involuntary termination of employment of the option holders, until the options are fully vested. During fiscal year 2023, we repurchased 0.4 million unvested early exercised options in the amount of $1.5 million.
Cash proceeds associated with early exercises are recorded within accrued expenses and other current liabilities and other liabilities, non-current in our consolidated balance sheets, depending on the future vesting dates of the associated options. Such accrued amounts were not material and $2.8
Restricted Stock Units
RSUs granted under the 2021 Plan generally vest over four years . RSUs are forfeited in case of termination of employment or service before the satisfaction of service-based vesting conditions.
RSU activity during fiscal year 2023 was as follows:
| RSUs (in thousands) | Weighted-Average Grant Date Fair Value Per Share |
||||||||||
Unvested as of January 31, 2022 |
$ | ||||||||||
| Granted | $ | ||||||||||
| Vested (1) | ( |
$ | |||||||||
| Forfeited | ( |
$ | |||||||||
Unvested as of January 31, 2023 |
$ | ||||||||||
(1) Class A common stock has not been issued in connection with | |||||||||||
The vesting date fair value of RSUs that vested during fiscal years 2023, 2022, and 2021 was $228.8 million, $1.4 billion, and none , respectively.
106
UiPath, Inc.
Notes to Consolidated Financial Statements
Prior to the IPO, we granted RSUs under the 2018 Plan that vested upon the satisfaction of both a service-based condition (generally four years ) and a performance-based condition. The performance-based vesting condition was deemed satisfied on April 23, 2021, the date that our IPO was completed. At that time, we recognized $233.0 million of cumulative stock-based compensation expense for the portion of these RSUs for which the service-based vesting condition had been fully or partially satisfied.
As of January 31, 2023, unrecognized compensation expense associated with unvested RSUs was approximately $703.3 million, to be recognized over a weighted-average remaining period of 2.8 years.
During fiscal year 2023, our compensation committee approved modifications to allow accelerated vesting of approximately 0.5 million RSUs upon employee terminations. The modifications, which were considered improbable-to-probable (Type 3) modifications under ASC 718, resulted in a net reduction of $7.4 million in the fair value of the modified awards due to the decrease in our stock price between the grant and modification dates.
During fiscal year 2022, our compensation committee approved modifications to allow accelerated vesting of approximately 0.2 million RSUs upon employee terminations, resulting in the recognition of $10.9 million of incremental expense. In addition, during fiscal year 2022, our compensation committee approved adjustments to the vesting schedules of our unvested RSUs which standardize their future vesting schedules by shifting each vesting date to the first day of the calendar quarter in which that vesting date was originally scheduled to occur. These adjustments caused a slight reduction in service periods for the affected tranches and resulted in $2.2 million of expense acceleration during fiscal year 2022.
Restricted Stock Awards
In September 2020, we issued 0.1 million RSAs to a member of our board of directors at a grant date fair value of $33.22 per share, totaling $4.0 million. Such RSAs vest monthly over four years from the grant date. The unvested shares are subject to a repurchase right held by us at the original purchase price. As of January 31, 2023, total unrecognized compensation expense related to unvested RSAs was $1.6 million, to be recognized over the remaining vesting period of 1.6 years.
Employee Stock Purchase Plan Awards
The fair value of ESPP awards was estimated using the Black-Scholes option pricing model with the following weighted average assumptions:
Year Ended January 31, |
Year Ended January 31, |
||||||||||
| 2023 | 2022 | ||||||||||
| Expected term (years) | |||||||||||
| Expected volatility | |||||||||||
| Risk-free interest rate | |||||||||||
| Expected dividend yield | |||||||||||
During the fiscal year ended January 31, 2023, 1.2 million shares were purchased under the ESPP at a weighted average purchase price of $13.28 per share.
As of January 31, 2023, unrecognized compensation expense related to the ESPP was approximately $2.9 million, to be recognized over a weighted-average remaining period of 0.4 years.
Stock-Based Compensation Associated with Business Acquisition
At the closing of the acquisition of Re:infer on July 29, 2022, we issued 0.4 million shares of Class A common stock (outside of the 2021 Plan) that will be released to certain employee sellers in equal installments on the first, second, and third anniversaries of the closing date, subject to employment-related clawback provisions. As of
107
UiPath, Inc.
Notes to Consolidated Financial Statements
January 31, 2023, total unrecognized compensation expense related to these shares was $6.4 million, which is to be recognized over a weighted-average remaining period of 2.5 years.
Stock-based Compensation Expense
Stock-based compensation expense is classified in the consolidated statements of operations as follows (in thousands):
Year Ended January 31, |
|||||||||||||||||
| 2023 | 2022 | 2021 | |||||||||||||||
| Cost of subscription services revenue | $ | $ | $ | ||||||||||||||
| Cost of professional services and other revenue | |||||||||||||||||
| Sales and marketing | |||||||||||||||||
| Research and development | |||||||||||||||||
| General and administrative | |||||||||||||||||
| Total | $ | $ | $ | ||||||||||||||
The expense presented in the above table is net of capitalized stock-based compensation relating to software development costs of zero , $4.5 million, and $0.3 million for fiscal years 2023, 2022, and 2021, respectively.
See Note 12, Convertible Preferred Stock and Stockholders' Equity (Deficit) for further information regarding stock-based compensation expense recognized in connection with secondary transactions.
| 14 | Income Taxes | |||||||
The U.S. and foreign components of (loss) income before income taxes for fiscal years 2023, 2022, and 2021 are as follows (in thousands):
Year Ended January 31, |
|||||||||||||||||
| 2023 | 2022 | 2021 | |||||||||||||||
| U.S. | $ | ( |
$ | ( |
$ | ( |
|||||||||||
| Foreign | ( |
( |
|||||||||||||||
| Loss before income taxes | $ | ( |
$ | ( |
$ | ( |
|||||||||||
The components of the provision for (benefit from) income taxes for fiscal years 2023, 2022, and 2021 are as follows (in thousands):
Year Ended January 31, |
|||||||||||||||||
| 2023 | 2022 | 2021 | |||||||||||||||
| Provision for (benefit from) income taxes | |||||||||||||||||
| Current expense | |||||||||||||||||
| Federal | $ | $ | $ | ||||||||||||||
| State | |||||||||||||||||
| Foreign | |||||||||||||||||
| Total current expense | |||||||||||||||||
| Deferred expense (benefit) | |||||||||||||||||
| Federal | |||||||||||||||||
| State | |||||||||||||||||
| Foreign | ( |
( |
|||||||||||||||
| Total deferred expense (benefit) | $ | $ | ( |
$ | ( |
||||||||||||
| Total provision for (benefit from) income taxes | $ | $ | $ | ( |
|||||||||||||
108
UiPath, Inc.
Notes to Consolidated Financial Statements
The following is a reconciliation of the statutory federal income tax rate to our effective tax rate for fiscal years 2023, 2022, and 2021:
Year Ended January 31, |
|||||||||||||||||
| 2023 | 2022 | 2021 | |||||||||||||||
| Federal statutory income tax rate | % | % | % | ||||||||||||||
| Foreign taxes | ( |
( |
|||||||||||||||
| Non-deductible expenses | ( |
( |
( |
||||||||||||||
| Stock-based compensation | ( |
( |
|||||||||||||||
| Valuation allowance | ( |
( |
( |
||||||||||||||
| Research and development credits | |||||||||||||||||
| Other, net | ( |
( |
( |
||||||||||||||
| Effective income tax rate | ( |
% | ( |
% | % | ||||||||||||
Significant components of DTAs and DTLs as of January 31, 2023 and 2022 are as follows (in thousands):
As of January 31, |
|||||||||||
| 2023 | 2022 |
||||||||||
| Deferred tax assets: | |||||||||||
| Net operating loss carryforwards | $ | $ | |||||||||
| Accruals and reserves | |||||||||||
| Stock-based compensation | |||||||||||
| Deferred revenue | |||||||||||
| Research and development | |||||||||||
| Foreign exchange | |||||||||||
| Depreciation and amortization | |||||||||||
| Excessive borrowing | |||||||||||
| Other | |||||||||||
| Total deferred tax assets, gross | |||||||||||
| Less: valuation allowance | ( |
( |
|||||||||
| Total deferred tax assets, net of valuation allowance | |||||||||||
| Deferred tax liabilities: | |||||||||||
| Intangible assets | ( |
( |
|||||||||
| Foreign exchange | ( |
||||||||||
| Depreciation and amortization | ( |
||||||||||
| Commissions | ( |
( |
|||||||||
| Other | ( |
||||||||||
| Total deferred tax liabilities | ( |
( |
|||||||||
| Net deferred tax assets | $ | $ | |||||||||
| Net deferred tax assets | $ | $ | |||||||||
| Net deferred tax liabilities (included in other liabilities, non-current) | ( |
( |
|||||||||
| Net deferred tax assets | $ | $ | |||||||||
We have evaluated the available positive and negative evidence supporting the realization of our U.S. federal and state, Romanian, and U.K. DTAs, including cumulative losses and the amount and timing of future taxable income, and have determined that it is more likely than not that these assets will not be realized. Accordingly, we have recorded a full valuation allowance against U.S. federal and state, Romanian, and U.K DTAs as of January 31, 2023 and 2022.
109
UiPath, Inc.
Notes to Consolidated Financial Statements
The table below details the changes in DTA valuation allowances for fiscal years 2023 and 2022 (in thousands):
| Beginning Balance |
Valuation Allowance Recorded During the Period |
Valuation Allowance Released During the Period |
Ending Balance |
||||||||||||||||||||
Year ended January 31, 2023 |
$ | $ | $ | $ | |||||||||||||||||||
Year ended January 31, 2022 |
$ | $ | $ | $ | |||||||||||||||||||
As of January 31, 2023, we had U.S. federal NOLs of $979.9 million available to offset future taxable income, all of which can be carried forward indefinitely. As of January 31, 2022 we had U.S. federal NOLs of $1,015.4 million, $1,006.1 million of which could be carried forward indefinitely, and $9.3 million of which were to begin expiring in 2035.
As of January 31, 2023 and 2022, we had state NOLs of $771.5 million and $648.5 million, respectively, which begin expiring in 2024.
As of January 31, 2023 and 2022, we had Romanian NOLs of $601.6 million and $531.4 million, respectively, which begin expiring in 2024. As of January 31, 2023 and 2022, we had Japanese NOLs of $10.4 million and $13.5 million, respectively, which begin expiring in 2027. Additionally, as of January 31, 2023 and 2022, we had U.K. NOLs of $135.1 million and $139.2 million, respectively, which may be carried forward indefinitely.
Pursuant to Section 382 of the IRC, annual use of our U.S. NOLs may be limited in the event a cumulative change in ownership of more than 50% occurs within a three-year period. We determined that two such ownership changes have occurred. The first resulted in an annual limitation, independent of net unrealized built-in gains, of $0.1 million for our NOLs as of April 24, 2017 but did not result in permanent disallowance of any NOLs. The second resulted in an annual limitation, independent of net unrealized built-in gains, of $29.0 million for our NOLs as of July 9, 2020 but did not result in permanent disallowance of any NOLs.
We do not provide for deferred taxes on $76.0 million of the undistributed earnings of our foreign subsidiaries as of January 31, 2023, because we intend to indefinitely reinvest such undistributed earnings in our non-U.S. operations.
As of January 31, 2023, we had gross unrecognized tax benefits totaling $2.3 million related to income taxes, which would impact the effective tax rate if recognized. Of this amount, the total liability pertaining to uncertain tax positions was $0.5 million, excluding interest and penalties, which are accounted for as a component of our income tax provision. As of January 31, 2022, we had gross unrecognized tax benefits of $2.5 million. Of this amount, the total liability pertaining to uncertain tax positions was $0.6 million, excluding interest and penalties
Our tax positions are subject to income tax audits in multiple tax jurisdictions globally, and we believe that we have provided adequate reserves for our income tax uncertainties in all open tax years. Our Romanian subsidiary is currently under audit for tax years from 2017 through 2022. Our Indian subsidiary is currently under audit for tax years from 2019 through 2021.
We file income tax returns in the U.S. federal jurisdiction, various state jurisdictions, and various international jurisdictions. Tax years 2019 and forward generally remain open for examination for federal and state tax purposes. Tax years 2017 and forward generally remain open for examination for foreign tax purposes. To the extent utilized in future years’ tax returns, NOLs at January 31, 2023 and 2022 will remain subject to examination until the respective tax year is closed.
110
UiPath, Inc.
Notes to Consolidated Financial Statements
| 15 | Net Loss Per Share Attributable to Common Stockholders | |||||||
The following table sets forth the computation of basic and diluted net loss per share attributable to common stockholders for the periods presented (in thousands except per share amounts):
Year Ended January 31, |
|||||||||||||||||||||||||||||||||||
| 2023 | 2022 | 2021 | |||||||||||||||||||||||||||||||||
| Class A | Class B | Class A | Class B | Class A | Class B | ||||||||||||||||||||||||||||||
| Numerator: | |||||||||||||||||||||||||||||||||||
| Net loss | $ | ( |
$ | ( |
$ | ( |
$ | ( |
$ | ( |
$ | ( |
|||||||||||||||||||||||
| Denominator: | |||||||||||||||||||||||||||||||||||
| Weighted-average shares used in computing net loss per share attributable to common stockholders, basic and diluted | |||||||||||||||||||||||||||||||||||
| Net loss per share attributable to common stockholders, basic and diluted | $ | ( |
$ | ( |
$ | ( |
$ | ( |
$ | ( |
$ | ( |
|||||||||||||||||||||||
Anti-dilutive common stock equivalents excluded from the computation of diluted net loss per share attributable to common stockholders were as follows (in thousands):
Year Ended January 31, |
|||||||||||||||||||||||||||||||||||
| 2023 | 2022 | 2021 | |||||||||||||||||||||||||||||||||
| Class A | Class B | Class A | Class B | Class A | Class B | ||||||||||||||||||||||||||||||
| Convertible preferred stock | |||||||||||||||||||||||||||||||||||
| Unvested RSUs | |||||||||||||||||||||||||||||||||||
| Outstanding stock options | |||||||||||||||||||||||||||||||||||
| Shares subject to repurchase from RSAs and early exercised stock options | |||||||||||||||||||||||||||||||||||
| Shares issuable under 2021 ESPP | |||||||||||||||||||||||||||||||||||
| Returnable shares issued in connection with business acquisition | |||||||||||||||||||||||||||||||||||
| Total weighted-average anti-dilutive common stock equivalents | |||||||||||||||||||||||||||||||||||
111
UiPath, Inc.
Notes to Consolidated Financial Statements
| 16 | Related Party Transactions | |||||||
For a description of certain related party transactions, see Note 12, Convertible Preferred Stock and Stockholders' Equity (Deficit)—Secondary Transactions.
Since the third quarter of fiscal 2022, we have made use of an aircraft owned by Daniel Dines, our Co-CEO, through a special purpose limited liability company in which we have a variable interest. The aircraft is operated by a third-party aircraft management company. Mr. Dines, through the special purpose limited liability company, obtained financing for the aircraft and bears all associated operating, personnel, and maintenance costs. We are able to use the aircraft, when available, for business purposes in the course of our normal operations at rates that approximate the cost of operating the aircraft but that do not exceed current market rates. For fiscal years 2023 and 2022 we incurred expenses of $1.9 million and $1.1 million, respectively, related to our business use of the aircraft.
112
Item 9. Changes in and Disagreements with Accountants on Accounting and Financial Disclosure
None.
Item 9A. Controls and Procedures
Evaluation of Disclosure Controls and Procedures
Our disclosure controls and procedures are designed to ensure that information required to be disclosed in our reports filed or submitted under the Exchange Act is recorded, processed, summarized, and reported within the time periods specified in the SEC’s rules and forms. In addition, they are designed to ensure that such information is accumulated and communicated to our management, including our Co-CEOs and CFO, as appropriate to allow timely decisions regarding required disclosure.
Pursuant to in Rules 13(a)-13(e) and 15(d)-15(e) under the Exchange Act, our management, under the supervision and with the participation of our Co-CEOs and CFO, performed an evaluation of the effectiveness of our disclosure controls and procedures as of the end of the period covered by this Annual Report on Form 10-K. Based on such evaluation, our Co-CEOs and CFO concluded that our disclosure controls and procedures were effective at a reasonable assurance level as of January 31, 2023.
Management's Report on Internal Control over Financial Reporting
Our management is responsible for establishment and maintenance of adequate internal control over financial reporting as defined in Rules 13a-15(f) and 15d-15(f) under the Exchange Act. Internal control over financial reporting is a process designed under the supervision and with the participation of our management, including our Co-CEOs and CFO, to provide reasonable assurance regarding the reliability of financing reporting and the preparation of financial statements for external purposes in accordance with U.S. GAAP.
Under the supervision and with the participation of our Co-CEOs and CFO, and under the oversight of our Board of Directors, our management performed an evaluation of the effectiveness of our internal control over financial reporting as of the end of the period covered by this Annual Report on Form 10-K, based on the criteria set forth in Internal Control—Integrated Framework (2013) issued by the Committee of Sponsoring Organizations of the Treadway Commission. Based on such evaluation, our management concluded that our internal control over financial reporting was effective as of January 31, 2023.
The effectiveness of our internal control over financial reporting as of January 31, 2023 has been audited by KPMG LLP, an independent registered public accounting firm, as stated in its report which is included in Part II, Item 8 of this Annual Report on Form 10-K.
Changes in Internal Control Over Financial Reporting
During the fiscal quarter ended January 31, 2023 no change in internal control over financial reporting was identified in connection with the evaluation required by Rule 13a-15(d) and Rule 15d-15(d) of the Exchange Act that has materially affected, or is reasonably likely to materially affect, our internal control over financial reporting.
Limitations on Effectiveness of Controls and Procedures
Our management, including our Co-CEOs and CFO, believes that our disclosure controls and procedures and internal control over financial reporting are designed to provide reasonable assurance of achieving their objectives and are effective at a reasonable assurance level. However, any control system, no matter how well designed and operated, can only provide reasonable, not absolute, assurance that its objectives will be met. There are inherent limitations to the effectiveness of any system of disclosure controls and procedures and internal control over financial reporting, including resource constraints, errors in judgment, and the possibility that controls and procedures will be circumvented by collusion, by management override, or by mistake. Additionally, the design of any control system is based in part on management assumptions about the likelihood of future events, and there can be no assurance that the system will succeed in achieving its objectives under all potential future scenarios. As a result of these limitations, our management does not expect that our disclosure controls and procedures and
113
internal control over financial reporting will prevent all potential errors or fraud or detect all potential misstatements due to error or fraud.
Item 9B. Other Information
Not applicable.
Item 9C. Disclosure Regarding Foreign Jurisdictions that Prevent Inspections
Not applicable.
114
PART III
Item 10. Directors, Executive Officers and Corporate Governance
The information required by this item is incorporated by reference to the definitive Proxy Statement for the 2023 Annual Meeting of Stockholders, which will be filed with the SEC no later than 120 days after the end of our fiscal year ended January 31, 2023.
We have adopted a Code of Conduct that applies to all employees, including executive officers, and to directors. The Code of Conduct is available on our website at ir.uipath.com. If we ever were to amend or waive any provision of our Code of Conduct that applies to our principal executive officer, principal financial officer, principal accounting officer or any person performing similar functions, or to any of our directors or other executive officers, we intend to satisfy our disclosure obligations, if any, with respect to any such waiver or amendment by posting such information on our website set forth above rather than by filing a Current Report on Form 8-K.
Item 11. Executive Compensation
The information required by this item is incorporated by reference to the definitive Proxy Statement for the 2023 Annual Meeting of Stockholders, which will be filed with the SEC no later than 120 days after the end of our fiscal year ended January 31, 2023.
Item 12. Security Ownership of Certain Beneficial Owners and Management and Related Stockholder Matters
The information required by this item is incorporated by reference to the definitive Proxy Statement for the 2023 Annual Meeting of Stockholders, which will be filed with the SEC no later than 120 days after the end of our fiscal year ended January 31, 2023.
Item 13. Certain Relationships and Related Party Transactions, and Director Independence
The information required by this item is incorporated by reference to the definitive Proxy Statement for the 2023 Annual Meeting of Stockholders, which will be filed with the SEC no later than 120 days after the end of our fiscal year ended January 31, 2023.
Item 14. Principal Accounting Fees and Services
The information required by this item is incorporated by reference to the definitive Proxy Statement for the 2023 Annual Meeting of Stockholders, which will be filed with the SEC no later than 120 days after the end of our fiscal year ended January 31, 2023.
115
PART IV
Item 15. Exhibit and Financial Statement Schedules
(a) The following documents are filed as part of this Annual Report on Form 10-K:
(1) Consolidated Financial Statements
The consolidated financial statements are filed as a part of this Annual Report on Form 10-K under Item 8. Financial Statements and Supplementary Data.
(2) Financial Statement Schedules
The financial statement schedules are omitted because they are either not applicable or because the information required is presented in the financial statements and notes thereto under Item 8. Financial Statements and Supplementary Data.
(3) Exhibit Index
The exhibits listed below are filed, furnished, or incorporated by reference as part of this Annual Report on Form 10-K.
| Exhibit Number |
Description |
Form | File No. | Exhibit | Filing Date | Filed Herewith | ||||||||||||||||||||||||||||||||
| 3.1 | 8-K | 001-40348 | 3.1 | 04/28/2021 | ||||||||||||||||||||||||||||||||||
| 3.2 | 8-K | 001-40348 | 3.2 | 03/10/2023 | ||||||||||||||||||||||||||||||||||
| 3.3 | X | |||||||||||||||||||||||||||||||||||||
| 4.1 | S-1/A | 333-254738 | 4.1 | 04/19/2021 | ||||||||||||||||||||||||||||||||||
| 4.2 | 10-K | 001-40348 | 4.2 | 04/04/2022 | ||||||||||||||||||||||||||||||||||
| 10.1 | S-1 | 333-254738 | 10.1 | 03/26/2021 | ||||||||||||||||||||||||||||||||||
| 10.2† | S-1 | 333-254738 | 10.2 | 03/26/2021 | ||||||||||||||||||||||||||||||||||
| 10.3† | S-1 | 333-254738 | 10.3 | 03/26/2021 | ||||||||||||||||||||||||||||||||||
| 10.4† | S-1 | 333-254738 | 10.4 | 03/26/2021 | ||||||||||||||||||||||||||||||||||
| 10.5† | S-1 | 333-254738 | 10.5 | 03/26/2021 | ||||||||||||||||||||||||||||||||||
| 10.6† | S-1 | 333-254738 | 10.6 | 03/26/2021 | ||||||||||||||||||||||||||||||||||
| 10.7† | S-1 | 333-254738 | 10.7 | 03/26/2021 | ||||||||||||||||||||||||||||||||||
| 10.8† | S-1/A | 333-254738 | 10.8 | 04/12/2021 | ||||||||||||||||||||||||||||||||||
| 10.9† | S-1/A | 333-254738 | 10.9 | 04/12/2021 | ||||||||||||||||||||||||||||||||||
| 10.10† | S-1/A | 333-254738 | 10.10 | 04/12/2021 | ||||||||||||||||||||||||||||||||||
| 10.11† | S-1/A | 333-254738 | 10.11 | 04/12/2021 | ||||||||||||||||||||||||||||||||||
| 10.12† | S-1 | 333-254738 | 10.12 | 03/26/2021 | ||||||||||||||||||||||||||||||||||
| 10.13† | S-1 | 333-254738 | 10.13 | 03/26/2021 | ||||||||||||||||||||||||||||||||||
| 10.14† | S-1 | 333-254738 | 10.14 | 03/26/2021 | ||||||||||||||||||||||||||||||||||
| 10.15† | S-1 | 333-254738 | 10.15 | 03/26/2021 | ||||||||||||||||||||||||||||||||||
| 10.16† | S-1 | 333-254738 | 10.16 | 03/26/2021 | ||||||||||||||||||||||||||||||||||
| 10.17† | S-1 | 333-254738 | 10.17 | 03/26/2021 | ||||||||||||||||||||||||||||||||||
| 10.18 | S-1 | 333-254738 | 10.19 | 03/26/2021 | ||||||||||||||||||||||||||||||||||
| 10.19 | S-1 | 333-254738 | 10.20 | 03/26/2021 | ||||||||||||||||||||||||||||||||||
| 10.20 | S-1 | 333-254738 | 10.21 | 03/26/2021 | ||||||||||||||||||||||||||||||||||
| 10.21† | S-1/A | 333-254738 | 10.22 | 04/12/2021 | ||||||||||||||||||||||||||||||||||
| 10.22++ | 10-Q | 001-40348 | 10.1 | 12/10/2021 | ||||||||||||||||||||||||||||||||||
| 10.23† | 10-Q | 001-40348 | 10.1 | 06/03/2022 | ||||||||||||||||||||||||||||||||||
| 10.24† | 10-Q | 001-40348 | 10.2 | 06/03/2022 | ||||||||||||||||||||||||||||||||||
| 10.25† | 10-Q | 001-40348 | 10.1 | 09/08/2022 | ||||||||||||||||||||||||||||||||||
| 16.1 | 8-K | 001-40348 | 16.1 | 04/20/2022 | ||||||||||||||||||||||||||||||||||
| 21.1 | X | |||||||||||||||||||||||||||||||||||||
| 23.1 | X | |||||||||||||||||||||||||||||||||||||
| 23.2 | X | |||||||||||||||||||||||||||||||||||||
| 24.1 | X | |||||||||||||||||||||||||||||||||||||
| 31.1 | X | |||||||||||||||||||||||||||||||||||||
| 31.2 | X | |||||||||||||||||||||||||||||||||||||
| 31.3 | X | |||||||||||||||||||||||||||||||||||||
| 32.1^ | X | |||||||||||||||||||||||||||||||||||||
| 101.SCH | XBRL Taxonomy Extension Schema Document | |||||||||||||||||||||||||||||||||||||
| 101.CAL | XBRL Taxonomy Extension Calculation Linkbase Document | |||||||||||||||||||||||||||||||||||||
| 101.DEF | XBRL Taxonomy Extension Definition Linkbase Document | |||||||||||||||||||||||||||||||||||||
| 101.LAB | XBRL Taxonomy Extension Label Linkbase Document | |||||||||||||||||||||||||||||||||||||
| 101.PRE | XBRL Taxonomy Extension Presentation Linkbase Document | |||||||||||||||||||||||||||||||||||||
| 104 | Cover Page Interactive Data File (formatted as Inline XBRL and contained in Exhibit 101) | |||||||||||||||||||||||||||||||||||||
† Indicates management contract or compensatory plan.
++ Pursuant to Item 601(b)(10)(iv) of Regulation S-K promulgated by the Securities and Exchange Commission, certain portions of this exhibit have been redacted. The registrant hereby agrees to furnish supplementally to the Securities and Exchange Commission, upon its request, an unredacted copy of this exhibit.
^ The certifications furnished in Exhibit 32.1 hereto are deemed to accompany this Annual Report on Form 10-K and are not deemed “filed” for purposes of Section 18 of the Exchange Act, or otherwise subject to the liability of that section, nor shall they be deemed incorporated by reference into any filing under the Securities Act or the Exchange Act, irrespective of any general incorporation language contained in such filing.
Item 16. Form 10-K Summary
None.
116
SIGNATURES
Pursuant to the requirements of Section 13 or 15(d) of the Securities Exchange Act of 1934, the registrant has duly caused this report to be signed on its behalf by the undersigned thereunto duly authorized.
| UIPATH, INC. | ||||||||
| By: | /s/ Ashim Gupta | |||||||
| Name: | Ashim Gupta | |||||||
| Title: | Chief Financial Officer | |||||||
| Date: | March 24, 2023 | |||||||
KNOW ALL PERSONS BY THESE PRESENTS, that each person whose signature appears below constitutes and appoints Daniel Dines and Brad Brubaker, and each one of them, as his or her true and lawful attorneys-in-fact and agents, with full power of substitution and resubstitution, for him or her and in their name, place and stead, in any and all capacities, to sign any and all amendments to this Annual Report on Form 10-K, and to file the same, with all exhibits thereto and other documents in connection therewith, with the Securities and Exchange Commission, granting unto said attorneys-in-fact and agents, and each of them, full power and authority to do and perform each and every act and thing requisite and necessary to be done in connection therewith, as fully to all intents and purposes as he or she might or could do in person, hereby ratifying and confirming all that said attorneys-in-fact and agents or any of them, or his or her substitute or substitutes, may lawfully do or cause to be done by virtue hereof.
Pursuant to the requirements of the Securities Exchange Act of 1934, this report has been signed below by the following persons on behalf of the registrant and in the capacities and on the dates indicated.
| Signature | Title | Date | ||||||||||||
| /s/ Daniel Dines | Co-Chief Executive Officer and Chairman | March 24, 2023 | ||||||||||||
| Daniel Dines |
(Principal Executive Officer)
|
|||||||||||||
| /s/ Robert Enslin | Co-Chief Executive Officer | March 24, 2023 | ||||||||||||
| Robert Enslin |
(Principal Executive Officer)
|
|||||||||||||
| /s/ Ashim Gupta | Chief Financial Officer | March 24, 2023 | ||||||||||||
| Ashim Gupta |
(Principal Financial Officer)
|
|||||||||||||
| /s/ Hitesh Ramani | Chief Accounting Officer | March 24, 2023 | ||||||||||||
| Hitesh Ramani | (Principal Accounting Officer) | |||||||||||||
| /s/ Philippe Botteri | Director | March 24, 2023 | ||||||||||||
| Philippe Botteri | ||||||||||||||
| /s/ Michael Gordon | Director | March 24, 2023 | ||||||||||||
| Michael Gordon | ||||||||||||||
| /s/ Daniel D. Springer | Director | March 24, 2023 | ||||||||||||
| Daniel D. Springer | ||||||||||||||
| /s/ Laela Sturdy | Director | March 24, 2023 | ||||||||||||
| Laela Sturdy | ||||||||||||||
| /s/ Jennifer Tejada | Director | March 24, 2023 | ||||||||||||
| Jennifer Tejada | ||||||||||||||
| /s/ Richard P. Wong | Director | March 24, 2023 | ||||||||||||
| Richard P. Wong | ||||||||||||||
117